Location: Home >> Detail
J Sustain Res. 2024;6(1):e240003. https://doi.org/10.20900/jsr20240003
 ,
María Raquel Agost-Felip 2,3,
Patricia Huedo 1,2
,
María Raquel Agost-Felip 2,3,
Patricia Huedo 1,2
1 Department of Mechanical Engineering and Construction, Universitat Jaume I, Avenida Sos y Bainat sn, Castellón de la Plana 12071, Spain
2 Interuniversitary Institute for Local Development, Universitat Jaume I, Avenida Sos y Bainat sn, Castellón de la Plana 12071, Spain
3 Department of Developmental, Educational and Social Psychology and Methodology, Universitat Jaume I, Avenida Sos y Bainat sn, Castellón de la Plana 12071, Spain
* Correspondence: María José Ruá.
Background: The United Nations 2030 Agenda involves a multifactorial system through 17 Sustainable Development Goals. The 11th is directly linked with urban sustainability, but all the goals should be considered. The diagnosis of urban environments is a complex challenge given the large number of involved factors, especially in vulnerable areas where urban and social problems often co-exist.
Methods: The proposed methodology is carried out in two stages. Firstly, an up-down approach is conducted to obtain data on urban vulnerability, from secondary sources. The information is disaggregated territorially, which does not necessarily fit the reality of the social fabric. Secondly, a bottom-up approach is performed, where the ad-hoc information provided by the Social Services experts, leads to three dimensions to evaluate social vulnerability.
Results: As a result, a Vulnerability Index of Social Services (IVSS) is obtained from the linear combination of the normalized indicators, calculated from the selected variables, and weighted according to social services experts. The model is transferred to maps using Geographic Information Systems to identify the areas of priority intervention in the municipality. By way of example, the model was developed in the municipality of Vinaroz (E Spain). The model could be extrapolated to other contexts, by adapting the model to the site.
Conclusions: Sharing information among Local Administrations departments, such as Urbanism and Social Services, has proved very useful to reach more equitable urban planning. This enforces the cross-cutting perspective included by the 2030 Agenda motto “leave no-one behind” (LNOB) and contributes to social equity.
SDGs, Sustainable Development Goals; LNOB, Leave No One Behind; SS, Social Services; GIS, Geographical Information System; SUS, Sensitive Urban Spaces; IVSS, Index of Vulnerability from Social Services; VI, Vulnerability Index
The United Nations 2030 Agenda includes, for the first time, the role of urban areas in sustainable development. Sustainable Development Goal 11, SDG 11, specifically addresses cities and human settlements by indicating that they must be inclusive, safe, resilient and sustainable. By extension, the New Urban Agenda [1] refers to urbanisation as a driver of sustained and inclusive economic growth, social and cultural development, and environmental protection, and to its potential contributions to achieve transformative and sustainable development.
Of the SDG 11 targets, the need for slum upgrading is highlighted as a priority for intervention in vulnerable areas. This target is key because vulnerable urban areas often present situations that combine residential exclusion and social exclusion [2–6]. Moreover, all the SDG targets integrate special attention paid to the most vulnerable people and, in fact, “leave no-one behind” (LNOB) is the central transformative promise of the 2030 Agenda for Sustainable Development and its SDGs.
Local interventions in urban environments are generally managed by Local Administrations. It is usually the Local Councils in each municipality that directly deal with the problems in their territory because they have first-hand information. Thus, for example, in Spain, the drafting of the Urban Development Plans of municipalities falls mainly in the town planning department of the Town/City Council, but they require the approval of the Regional Administration. Similarly, at the social level, local Social Services (SS) manage the resources available to care for the most vulnerable population.
In this paper, we propose a model for assessing urban vulnerability that incorporates information provided by SS about their interventions. Thus, it considers a social vulnerability dimension and constitutes a very useful key factor in assessing the population’s vulnerability. This dimension can contribute to better diagnose the situation in those areas that require greater social intervention to, therefore, allocate resources to those places where they are most needed. The model is named IVSS, an acronym for “Index of Vulnerability from Social Services”.
Assessing vulnerable urban areas allows resources to be targeted to those areas with the greatest need. Assessment models are often based on indicators that can detect traces of vulnerability, but it is difficult for them to respond in a balanced way to different realities, and it is not possible to obtain a perfect universal model that matches all situations, as revealed in the Background section. These models can provide a broad overview, and can be generally used and be very useful to establish comparisons at the territorial level. Their application can be relatively simple because indicators are obtained from secondary sources. However, their broad application has the disadvantage of losing the specificities of each case. For this reason, it may be advisable to obtain information from primary sources. In this case, including the information held by SS is proposed given that their work focuses precisely on assisting the neediest people in each population through assistance and the granting of aid of different kinds due to their highly vulnerable situation. This model could be used for different purposes, at the local level, for policy implementation or to be included in broader standard models with other dimensions to improve the identification of vulnerability, including a psychosocial perspective.
For this purpose, a municipality was selected in the Valencian Community (E Spain) that, a priori, presents features of vulnerability. This selection allows the specific conditions of the municipality to be particularised and to be tested in a practical case. This is Vinaroz, a town in the north part of the region. The model presents the case study results, but proposes the general working methodology being extrapolated to other municipalities in the region. It would also be adaptable to other regions.
The IVSS model is not aligned only with international criteria (SDG11, target 11.1), but also adapts to the guidelines established in the regulatory framework and local policies. In this case, it responds to Article 25 of Regional Law 3/2019 on Inclusive Social Services of the Valencian Community, which includes the need to act in vulnerable spaces. Specifically, Article 25 defines vulnerable spaces as those places that, due to their urban/residential, social, employment or economic characteristics, require comprehensive action to favour the social inclusion of people and communities, and to improve citizens’ quality of life.
A key aspect in this study is the geolocation of the data in the municipality, which highlights the importance of selecting the most suitable scale and criteria for territorial planning. In any case, Geographical Information System (GIS) tools are incorporated. They allow a graphic diagnosis to be made of information to apply criteria to distribute resources in the territory according to its geographical organisation.
The structure of this manuscript is as follows.
Firstly, the Materials and Methods section presents a Background subsection, with a review of the state of the art of the “urban vulnerability” term. It discusses how its assessment is based on categories of analysis and how different authors work with it in distinct geographical contexts. This is followed by the Methods subsection, which includes the methodologies adopted in the paper. The Results section briefly presents and justifies the selection of the case study municipality and sequentially describes the phases followed to develop the new model. It also contains the results obtained in its application in the case study.
The implementation of measures to overcome situations of urban vulnerability requires a territorial analysis to identify those areas with vulnerability problems. It is necessary to characterise the territory to be able to act precisely in the most deteriorated areas at the urban and building levels to, thus, contribute to improve the socio-economic conditions of these areas.
The territorial dimension constitutes the physical support of the economic and social dimensions, and is a key point to analyse because of the interrelationships that are established with the socio-economic fabric of a given place. Urban and architectural interventions may have the power to reduce situations of vulnerability and contribute to social initiatives [7]. Thus, for example, variables like residential quality act as a proxy variable to identify different socio-economic sectors in the territory by providing evidence that allows public policies to be applied where they are most needed [8]. Other studies relate the issue of housing prices to identify spatially identifiable variables that may be related to social and territorial vulnerability [9]. Méndez et al. [10] evaluated the degree of vulnerability to the crisis in Spain during the 2006–2013 period by means of a synthetic Vulnerability Index (VI) based on three vulnerability dimensions, with five indicators each: Real Estate, Economic-Labour and Socio-demographic. They make a calculation with a ranking by provinces, and also evaluate populations with more than 20,000 inhabitants. The territorial study introduces the question of scale and, as there are differences between areas within cities, how it is advisable to analyse on a neighbourhood or defined area scale for urban homogeneity reasons because they can be considered functional units [11].
There are many examples in the literature that combine urban and social dimensions by working from different perspectives and in several contexts. Of the most recent references and using the PRISMA methodology (Preferred Reporting Items for Systematic Reviews and Meta-Analyses) [12], the “urban vulnerability index” keywords were used in the Web of Science database. This search resulted in 1805 references, with 880 references left after including publications only from the last 4 years: 2020–2023. Subsequently, the sample was reduced to 139 references after eliminating those belonging to categories, such as medicine, geology, etc., and by limiting to the disciplines that are relevant to this work, such as urban planning and social issues. A review of the title and abstract of papers allowed us to reject many of these references, which are more related to environmental risks due to climate change and natural disasters, such as floods or earthquakes. Finally, 15 directly related papers were selected and thoroughly reviewed by the authors. The main conclusions are summarised below.
The references vary in geographical context terms. The work of Effat et al. analyses deprived areas without urban planning in the city of Assiut, south of Cairo (Egypt), by including the indicators proposed by the New Urban Agenda. It introduces 13 subindicators related to shelter, social degradation, environmental degradation and economic degradation. It identifies the most vulnerable districts, such as those with the highest percentage of slums, the highest population density, the highest urban sprawl rates and poor connection to services [13]. Hanoon et al. apply an integrated vulnerability model to the city of Nasiriyah in Iraq. The model is composed of four dimensions: urban, social, building and environment [14]. The study by Krishnan and Firoz, which aims to assist urban planning, building construction and land and resource management for a sustainable environment, assesses environmental quality by developing an index for the Ernakulam district in Kerala, India, using 19 composite variables classified into three domains: ecological, meteorological and socio-economic [15].
In US urban areas, Buck et al. attempt to establish a relation between the three sustainability dimensions and residential segregation by using the urban areas corresponding to 933 census tracts. The results show that an increase in urban segregation corresponds to decreased sustainability. The socio-economic dimensions negatively correlate with segregation, while the environmental dimension positively correlates, which reinforces the consideration of inequalities when planning urban revitalisation. The authors emphasise the fact that a spatial scale is essential for understanding and improving social outcomes [16].
In Latin America, different problems are detected and seem to have a more social approach. For example, in Colombia Hernández and Zuluaga identify the socio-economic factors that influence vulnerability to poverty, such as the existence of female-headed households, self-employment, job loss and bankruptcy of family businesses, factors that positively correlate with vulnerability. Others like years of schooling, being an employee and access to credit reduce vulnerability, and show the need to improve the social safety net to guarantee access to basic social services for the most vulnerable [17]. Jiménez-García et al. propose a social VI of households and neighbourhoods linked with situations of socio-economic deprivation and lack of resources to cope with risks of violence in 81 lower-middle and lower class neighbourhoods in three cities: Bogotá, Lima and Santiago [18]. Cadena-Vargas develops a social VI to uncover spatial patterns of social inequality based on the 2010 population census in Mexico. The obtained results indicate a socio-spatial segregation process related to migratory flows, economic informality, the concentration of the indigenous population and remoteness from major urban centres of economic activity [19].
Davino et al., examine social vulnerability in the city of Rome by calculating and mapping an index based on seven dimensions (housing, social context, education, labour market, urban mobility, social relations, economic well-being) [20]. In a comparative study between Spain and Mexico, Mercader et al. apply a model in neighbourhoods from a multidisciplinary work by proposing a methodology to calculate an index that considers four dimensions: Building, Urban, Environmental and Social (BUES) consisting of 32 variables related to residential environments [21].
In Spain, proposals are numerous, and the indices proposed by the Ministry to assess urban vulnerability [22], which is based on census information, are available as a reference. Three indicators make up the index: percentage of unemployed people, percentage of people with no education and percentage of dwellings in buildings in poor conditions showing only extreme vulnerability and leaving out other previous stages or relevant dimensions. In Madrid, Martín-Consuegra et al., link the poor thermal quality of residential buildings in less favoured neighbourhoods as an important vector for inhabitants’ vulnerability [23]. Some studies focus on the city of Barcelona. Anton-Alonso and Cruz-Gomez find that, in the metropolitan area, there is a marked persistence of extreme vulnerability in certain places, which is partly due to the growth that took place between 1950 and 1975 when neighbouring municipalities in the southern and northern parts of the city welcomed low-income populations in massive urban developments. Many were unplanned, with low-quality housing and environments [24]. Piasek et al., present a factor analysis of the main components. It results in four urban vulnerability dimensions (social class, gentrification, social and employment, and physical & architectural) and an integrated VI for the city of Barcelona and its neighbourhoods, mapped in geographic information systems and provides clues for policy intervention [25]. Fernandez-Aragón et al., compose a comprehensive index made up of four partial VIs that they apply to the city of Bilbao: socio-demographic, socio-labour, socio-residential and participation. The index is applied to the neighbourhoods of the municipality of Bilbao and is compared to previous studies conducted in the area [26]. In the Valencian Community, an assessment model promoted by the Regional Government [27,28] allows the identification of the residential, socio-economic and socio-demographic vulnerability of the census sections in the region.
Previous urban sustainability assessments, which have focused on social variables connected to vulnerable people’s needs, are analysed. For example, to award the ISUDS (Integrated Sustainable Urban Development Strategy, in the European Regional Development Funding benchmark), and as part of the Spanish 2014–2020 Multiregional Operational Programme, using indicators that consider the fight against poverty and social exclusion or against school dropout is proposed, including the needs of vulnerable people like children. Thus, an indicator is proposed to measure the percentage of people with access to SS locally in ISUDS cities. Other indicator systems, such as the Urban Audit Indicators of Local Agenda 21 for medium and large cities, incorporate indicators that take into account the elderly or immigrants as being vulnerable. The Spanish urban agenda, in Strategic Objective 6 of Social Cohesion and Equal Opportunities, presents two specific objectives to: reduce the risk of poverty and social exclusion in disadvantaged urban environments by providing a vision related to the socio-economic level in urban areas; seek equality by gender, age and disability, including the most vulnerable groups.
Authors specialised in social work refer to the importance of the social perspective. Fantova highlights the role of SS in relation to care because services protect and promote people’s integration [29]. Belchior-Rocha points out that environmental problems are also social problems, and emphasises that social work as a scientific field assumes the importance of including environmental problems in social intervention, and indicates that it is especially important when dealing with vulnerable communities. This work states that social vulnerability accentuates the harm of being exposed to environmental hazards and amplifies their effects [30]. Some authors, such as Carroll, focus on people who are often vulnerable, such as the elderly, and reflect on the importance of neighbourhoods for the elderly and how they encounter more exclusion problems, especially in vulnerable neighbourhoods [31]. In other studies, the focus lies on migrants’ residential segregation [32].
Some studies raise the question of including psychosocial intervention as a reference for detecting situations of vulnerability. Giménez-Bertomeu et al. analyse territorial vulnerability by implementing indicators to measure it from SS [33]. Ruá et al, propose a model for identifying vulnerable areas, which they apply to the city of Castellón de la Plana, with four dimensions (urban, residential, socio-demographic and socio-economic) and 29 indicators. In this work, aspects related to social vulnerability are incorporated based on the population data of SS, specifically on the number of interventions carried out by SS in the city and the subsidies granted for vulnerable populations in different programmes to attend dependency, school absenteeism, etc. This information results in an evaluation model that is sensitive to situations of social vulnerability by reinforcing this aspect and complementing the physical diagnosis of the urban environment [34].
The reviewed models highlight the different realities at the international level, with urban environments in cities in Africa or Asia, in the United States or Europe not being comparable. They are mostly wide-ranging models, which take into account general variables, such as those of the New Urban Agenda and, in certain cases, they are models adapted to specific environments. The differences between the more urban-focussed models and the more social approaches are also evident. Thus, authors in the social work field attach more importance to social variables to identify situations of vulnerability. Some authors already draw attention to psychosocial variables and propose indicators using SS as a source of information due to their direct relationship with vulnerable people. The model proposed here is aligned with the latter, and uses a case study to illustrate the application of the model, in a medium-sized municipality in eastern Spain. The collection of this primary information has been possible thanks to the participation and feedback from the SS technicians of the analysed municipality.
MethodThe model designed in this work is a mixed analysis model, and is used by applying both quantitative and qualitative methodologies. For this purpose, different data sources were applied and the study variables were defined. The IVSS model includes three phases, which are outlined in Figure 1. It presents the objectives, methods, and main results in each stage, coded by letters O, M and R, respectively. The manuscript will be organized accordingly:
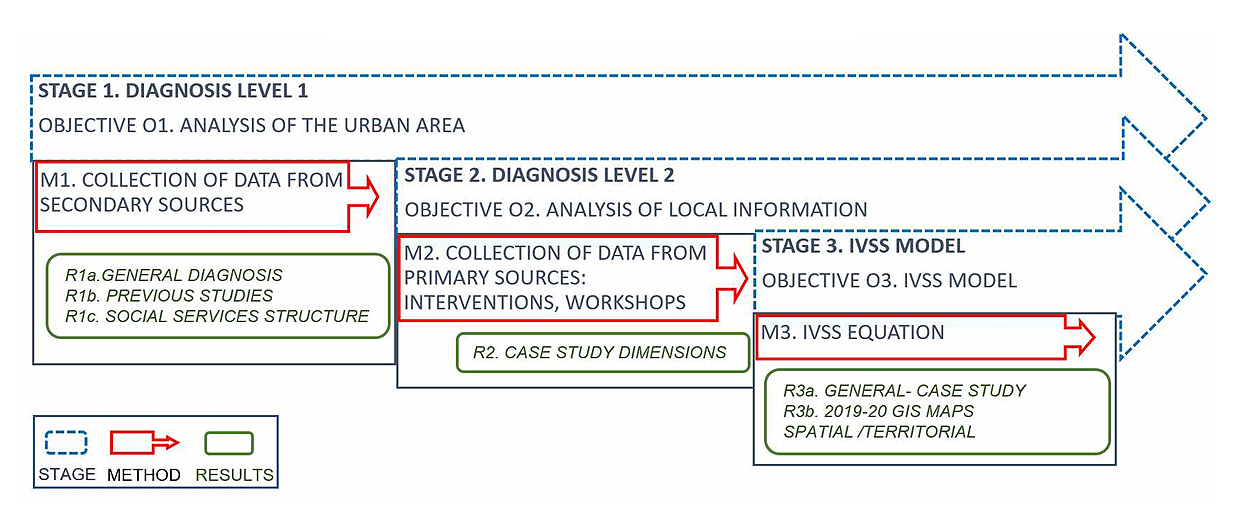 Figure 1. Stages and methods for the vulnerability diagnosis process from the SS perspective.
1. Diagnosis Level 1: the main objective is to obtain a macrolevel diagnosis of the area to be studied from a top-down approach. Data are collected from available secondary sources, such as statistics on the studied area from official sources and previous studies of the urban vulnerability analysis. The functioning and organisation of SS are also analysed, as are the type of interventions, the assistance they provide and how they manage their resources in the territory. The information obtained from different sources is grouped into: an analysis of territorial data: official statistical sources, previous reports and municipal plans; an analysis of data on SS in the territory.
2. Diagnosis Level 2: data are collected from primary sources in the study area, thus complementing with a bottom-up approach the top-down approach proposed in the first phase. Here the aims are to identify areas of community intervention, and to incorporate the technical criteria of SS professionals and the criteria of other agents with competencies in the territory, such as the municipality’s urban planning technicians. It includes a participatory process with technicians, which includes “ad hoc” workshops, systematically collected on record sheets. From this phase, indicators are extracted to evaluate the key areas for the psycho-social assessment. The 2019–2020 SS interventions are collected.
3. The IVSS Model: the IVSS model is proposed by means of an equation that weighs the key areas on the dimension. The model is developed with the support of SS technical experts, who are familiar with the particularities of the municipality and the assistance programmes offered by this service. Firstly, the information collected from secondary sources is compared to them to check whether the results coincide with their knowledge of the municipality. The technicians’ proposal is to include information from their interventions for vulnerable people.
A two-fold approach to data calculation is put forward and different applications are suggested. The first approach corresponds to the analysis of the total interventions in the municipality. It is called the “Spatial Approach” and consists of the geolocation of the files in the municipality. This approach can be very useful for optimising SS interventions by enabling a more equitable distribution of resources and the application of strategies in the analysed territory. A second approach uses the census tract as the measurement unit because it is a standardised administrative unit that is commonly employed for collecting population information. It is called the “Territorial Approach” because, etymologically, the territory term implies limits or boundaries. In this way, it is possible to identify and compare the vulnerable areas of the municipality, in this case census sections, and to obtain the most vulnerable areas and the number of affected people, by defining the boundaries within the municipality itself, which are circumscribed to administratively defined areas. In addition, employing a standardised unit like the census tract allows the proposed index to be incorporated as a new dimension into an integral vulnerability analysis. This scale has already been used in other vulnerability studies [27,28,35]. In other words, this IVSS could be integrated into pre-existing models that use the census section as a unit, with other analysis dimensions, such as demographic, urban, economic, etc., to complete and improve the diagnosis by detecting local social vulnerability problems.
The final mapping of territorial vulnerability from the SS perspective is presented using GIS maps with a practical application.
The model could be extrapolated to other territories after logically adapting levels to the new context.
In the first stage, a general diagnosis of the territory under study is undertaken. From the available official sources, the most relevant data are extracted according to the study purpose. In this case, the official statistical data and the tools and studies that already exist, and refer to partial or global vulnerability studies, approximate or offer an idea of the current situation of the analysed area. It also analyses the way in which the SS intervention zones are distributed to be compared to the different criteria for the distribution of urban areas and to correlate all the possible forms of organisation. The main results are summarised in the following subsections.
R1a. General diagnosisVinaroz is a coastal municipality in the Valencian Community in the Castellón province, the most northerly of the Valencian Autonomous Community, and is the capital of the Bajo Maestrazgo region. The municipality is in the most north-eastern part of the region, province and the Valencian Autonomous Community (see Figure 2A).
According to Abad and Echaves, of 2015, the highest VI by Spanish provinces places Castellón in first position in the national territory and Vinaroz in a prominent position in the analysis by towns.
The Vinaroz population is 28,862 inhabitants according to the Spanish National Institute of Statistics [36], with 14,267 men and 14,595 women, which represents 34.71% of the population of the region, 4.92% of the province and 0.57% of the Valencian Community. Of the population in the municipality, 80.7% are Spanish, 9.1% belong to European Union nationalities, and the remaining population belongs to the rest of the world.
At the economic level, the 2021 data show the seasonality of some economic activities linked with the situation on the coast, with the service sector being that with the highest rates (76.07%) compared to agriculture (6.52%), construction (5.97%) or industry (7.01%). The unemployment rate is 10.72%, which is slightly higher than the rate for the region (9.70%) and for the Castellón province (9.62%), and is similar to the rate for the Valencian Autonomous Community (10.96%), but is higher for women than for men.
At the socio-economic level, some values of poverty and exclusion indicators are included from the Statistical Portal of the Valencian Government, 2020, although they are disaggregated down to the county level, with no specific data available for the municipality. The Bajo Maestrazgo region, to which Vinaroz belongs, has worse values than the provincial and regional averages with higher poverty indicator rates; for example, the AROPE factor, risk of poverty and social exclusion and lower income [37]. These data reveal concerns about the socio-economic situation and potential vulnerability in the municipality, which justify the selection of the study area.
Another important issue concerns the territorial organisation of the municipality. In terms of its administrative organisation, Vinaroz is made up of a single district, divided into 17 census sections, as Figure 2B depicts, where the urban nucleus is detailed in the coastal area surrounded by larger rural census tracts. This is relevant for using standardised units for territorial areas.
R1b. Previous studiesIn addition to the above-presented statistical data, other secondary sources have been used as a reference for assessing vulnerability and are applied to the case study. The tool designed by the Valencian Government in collaboration with the Valencian Cartographic Institute (Generalitat Valenciana, 2018) [28], which was reviewed and updated in 2020, contains the Sensitive Urban Spaces (SUS) viewer tool. This tool forms part of the Observatory of Habitat and Urban Segregation, and its objective is to identify, by means of mapping, sensitive urban areas. It is useful for public administrations to establish priorities when defining and implementing policies to improve citizens’ quality of life.
The SUS tool establishes the VI of three dimensions (Residential R, Socio-economic E and Socio-demographic D), and determines four vulnerability typologies: Integral Vulnerability, when the 66th percentile is exceeded on all three dimensions; Medium Poly Vulnerability, when it is exceeded on two dimensions; Low poly vulnerability, when only one dimension is exceeded; residual vulnerability, otherwise. Thus, SUS are defined as those in which there is Integral Vulnerability or Medium Poly Vulnerability, with a VI higher than the 75th quartile. The model is described by Serrano et al. (2020) [38]. It presents the results in the Valencian territory, with 3472 census sections in all according to INE data from 1 January 2019. As a result, there are 778 SUS; 22.41%. The VI considers nine indicators, three per dimension: R1. Average surface area per inhabitant of residential properties; R2. Accessibility; R3. Cadastral value; E1. Uneducated population; E2. Average income level; E3. Estimated registered unemployment rate with a gender perspective; D1. Gender dependency ratio; D2. Deprivation index; D3. Gendered immigrant population.
According to this tool, for Vinaroz, only the census tracts around the port area display outstanding vulnerability (Figure 2B). The results reveal that 5.72% of the municipal population presents high residential vulnerability, with 1640 inhabitants in census section 1001, and 29.81% presents medium residential vulnerability, which affects 8550 inhabitants in six census sections. There is no high socio-demographic vulnerability, but medium socio-demographic vulnerability affects 74.33% of the population, with 21,320 inhabitants in 13 of the 17 census sections. High socio-economic vulnerability represents 11.42% of the municipal population, i.e., 3277 inhabitants in census sections 1007 and 1010. Medium socio-economic vulnerability represents 41.12%, with 11,795 inhabitants in seven census sections. As regards the combined index, six census sections are SUS (1001, 1003, 1005, 1006, 1007, 1016), with 8121 affected inhabitants, which is 28.31% of the population.
Another relevant source for the vulnerability analysis is the Pla Estratègic de la Ciutat de Vinaroz (Strategic Plan of the City of Vinaroz) [39]. The basic indicators that define these areas are classified into four categories of indicators: (1) demographic indicators, such as the total population aged over 64, foreigners and the dependency index; (2) socio-economic indicators, such as the unemployed population, young, female, uneducated and level of income; (3) residential indicators, total housing with habitability deficit and aged older than 50; (4) urban environment indicators, such as pollution, green surfaces, facilities, mobility and conversion of pedestrian routes.
Vulnerable areas are identified in this plan, and some of these areas directly correspond to the SUS analysis. Thus, five vulnerable areas are detected (Figure 2C) and coincide with the SUS tool proposal, including the neighbourhoods closest to the port area in the old part of the city (Neighbourhoods: A1. Nucli Antic, A2. Barri dels Mariners, A3. Centelles, A4. Camí Fondo, A5. 15 d’Abril Group). In this case, three other areas with specific problems (the urban area closest to Vinalab, the urban area of Colònia Europa and the residential areas to the west of the old N-340, known locally as Les Capçades) are also added. The local scale allows a closer approach to the municipality’s current reality.
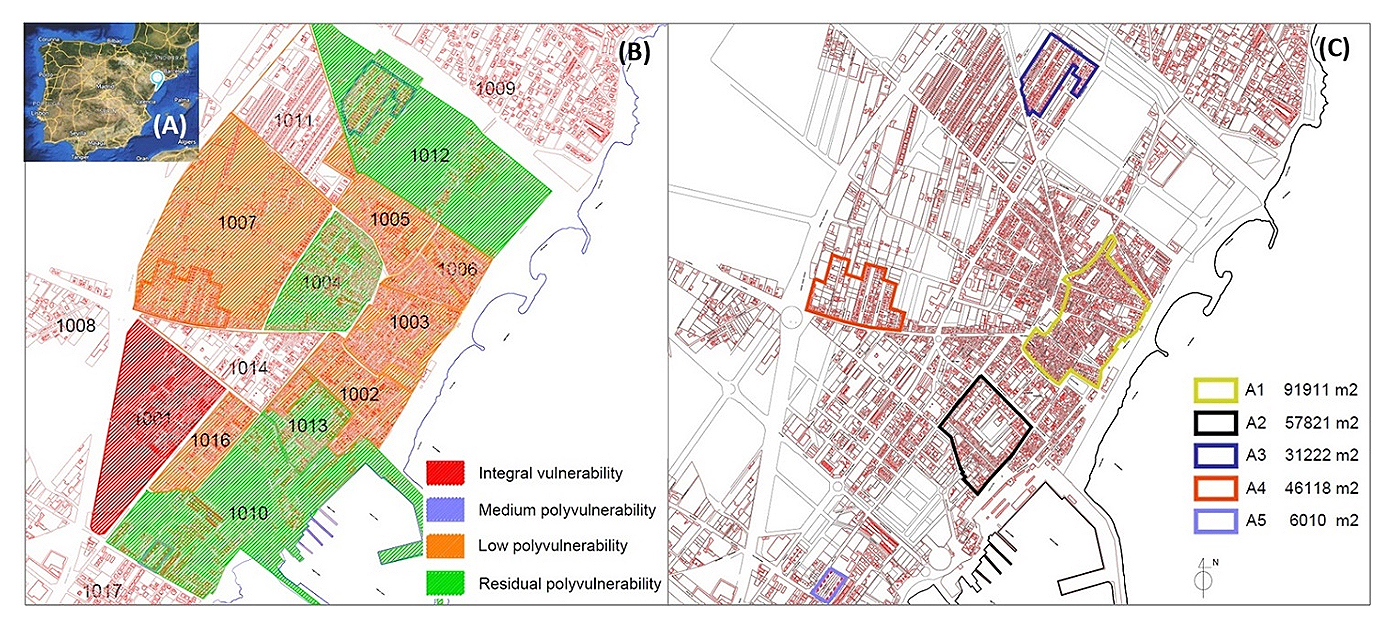 Figure 2. (A) Location of Vinaroz. (B) Census sections in Vinaroz and vulnerability according to SUS viewer tool. (C) Vulnerable urban areas from Strategic Plan of the City of Vinaroz. Source: authors from the Cadastral Office, SUS viewer tool and the Vinaroz City Council, Strategic Plan.
In accordance with Decree 34/2021, of 26 February, of the Valencian Government, which regulates the SS Map of the Valencian Community, the municipality of Vinaroz forms part of SS Department 1 in the Castellón province, corresponding the county Bajo Maestrazgo to SS Area 1.1, and constituting SS Basic Zone 1.1.1.
Stage 2. Diagnosis Level 2In this second analysis stage, the indicators for assessing social vulnerability are introduced, based on SS files and the consensus with municipal technicians. This dimension and its calculation are the main proposal and contribution of this work.
The calculation of the index (IVSS) integrates the main SS care programmes, which correspond to each proposed vulnerability type: poverty, dependency, family-children. It is based on the information provided by SS.
Contributions were made by technicians in a workshop for the territorial diagnosis, carried out on 20 December 2019. Seven people from SS participated to reach a consensus and to shape information that is significant for the assessment of vulnerability from this new perspective. Details of the participants appear in Table 1, including the programmes which they were involved in.
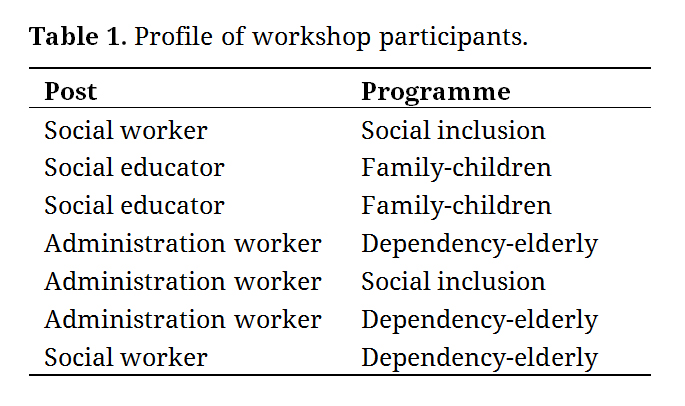 Table 1. Profile of workshop participants.
To systematically collect the information provided by technicians, a series of sheets (supplementary material) is prepared to guide the workshop. Sheets are intended to confirm the accuracy of the information collected from secondary sources, with one sheet for the residential, one for the socio-demographic and one for the socio-economic categories, as structured in the SUS tool. Participants are also asked to identify the points in the municipality that they perceive as being the most vulnerable for each category, what needs are detected and what measures they propose. The sheet is completed with the sharing and collection of the group’s conclusions about the addressed category. A city map was used (Figure 3) that features some of the work collected during the session, where vulnerable areas and spots in the city are identified geographically.
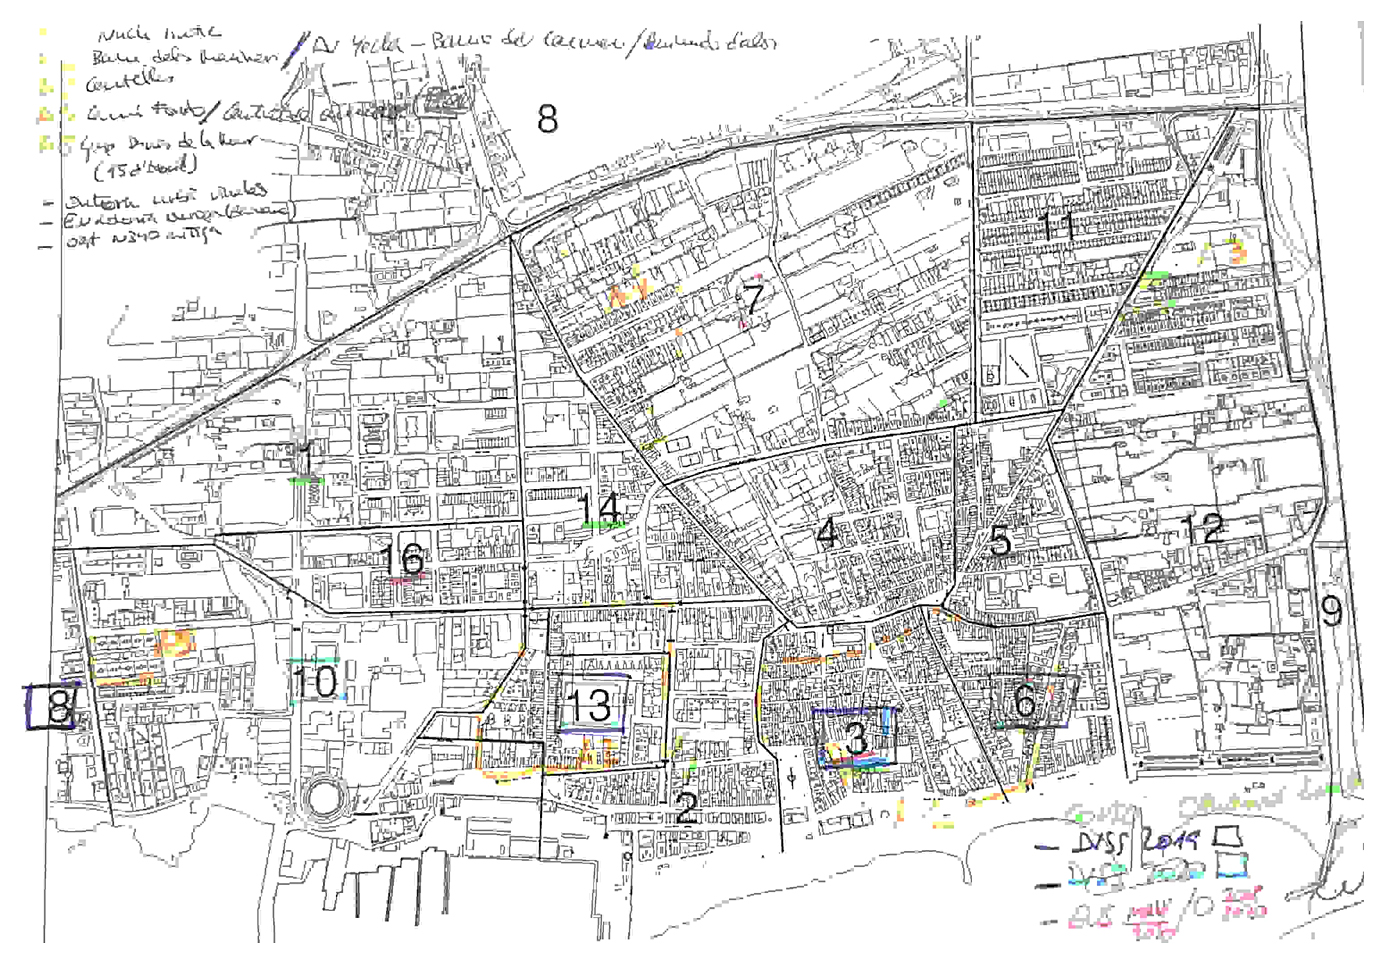 Figure 3. Sample of the map used in the workshop for the geolocation of vulnerable spots in the city.
The main workshop conclusions are summarised below.
Regarding socio-economic vulnerability, SS technicians recognise certain blocks of dwellings, located in the areas indicated by previous studies, which are characterised by a significant number of cohabitation units that subsist on minimum income.
On residential vulnerability, the large number of dwellings over 50 years old, which do not meet adequate habitability conditions, in the indicated areas is highlighted. Specific groups of dwellings are identified in these areas that should be rehabilitated, such as the Dones a la Mar group, the buildings between streets Mare de Déu del Pilar and Camí Fondo, among others. Another important aspect is lack of social housing, which should be significantly increased. In these areas, and regarding the public space, the urban fabric is characterised by poor accessibility for pedestrians, with narrow pavements and no green areas.
In line with the proposal of this study, the analysis of socio-demographic vulnerability yields interesting results that help to formulate the proposed model. Although technicians generally agree with the results obtained in previous studies on a global level about socio-demographic vulnerability, as indicators to be taken into account they would include the processing of aid, the cases open to minors and the population’s social demands, above all as regards the elderly and/or dependent persons.
R2. Social vulnerability dimensions in VinarozThe proposal made in this work considers these aspects in relation to the interventions carried out by SS, whose contribution may include a psychosocial perspective that goes beyond the demographic or socio-economic dimensions that may indicate social vulnerability, which is especially useful in areas of high vulnerability. It introduces local information on those people who are the object of SS interventions, and obtains a more accurate view of the situation and supplements the information provided by other more globally or macro-applicable indices.
In collaboration with the technical staff of these services, and with the town planning technicians of the municipality, establishing three axes around which indicators are selected to evaluate them is proposed: an axis that considers poverty, another that considers situations of dependency (elderly, disabled) and a third one that includes family-children vulnerability. The indicators implemented for these axes are presented in more detail below.
1.
2.
3.
In addition, a meeting was held on 4 March 2022 with SS technicians to communicate the results. Another was held on 1 June 2022 with the urban planning technicians to finally prepare the report of the work. On 15 March 2022, the report of the work was presented to the public [40].
Stage 3. IVSS Model R3a. General and case study equationIn this subsection, the steps followed to obtain the mathematical model for vulnerability assessment are shown. The general procedure is presented for general applicability, followed by the result in the case study application:
1.Select the variables that characterise the vulnerability of the municipality according to the SS programmes: where j is the dimension of the variable and i is the area over which it is calculated.
Case study: 3 main SS programmes, j = 3 (1: poverty, 2: dependency; 3: family-children). Urban area i.
2.Define the indicators to quantify the variables (SS programmes): the number of files processed for the predefined categories.
Case study: indicators for v1: numbers of PEI and RVI files; v2: number of dependency files; v3: number of family-children files. To assess this dimension, the files for 2019 and 2020 were used, with a total of 3771 files, which are broken down in Table 2 by vulnerability type.
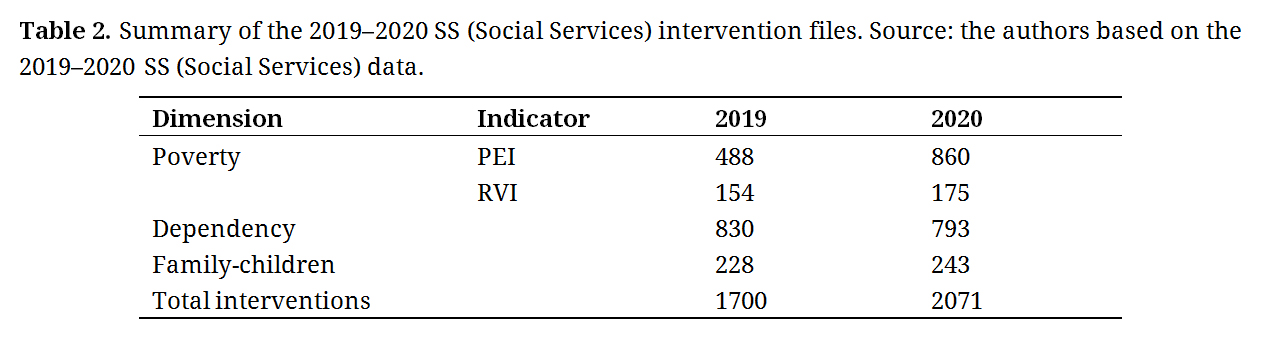 Table 2. Summary of the 2019–2020 SS (Social Services) intervention files. Source: the authors based on the 2019–2020 SS (Social Services) data.
3.Calculate the percentage of the total number of cases processed in the considered area. i: census section.
Case study: i: 17 census sections; two approaches; in the Spatial approach, number of files in dimension j, in relation to the total population in the municipality; in the Territorial approach, number of files in dimension j, in relation to the census section population.
4.Normalise the calculated indicators to obtain values between 0 and 1 and to establish quartiles to organise values into four categories, from the lowest to the highest vulnerability: residual, low, medium and high. Normalisation function: N(Xq) = (Xq − Xmin)/(Xmax − Xmin), Xq: % of the processed files; Xmax: maximum percentage value; Xmin: minimum percentage value [41].
5.Calculate the values for the IVSS and transfer them to GIS maps. It is formulated as a linear combination of the variables, where the possibility of incorporating different weights per variable is introduced. Equation 1 shows the generic calculation model.
IVSSi = (100/n) * (∑pvji * vji)/ (∑pvji) (1)
where,
IVVSi is the Social Services Vulnerability Index in the considered area i.
vji is the value of the vulnerability for dimension j, in the considered area i.
pvji is the weight assigned to variable vji.
n is the number of considered variables or dimensions.
R3b. GIS maps in VinarozCase study: the resulting maps for each approach are presented below.
(a) The spatial approach
In the so-called Spatial approach vji is the percentage calculated as the number of files on dimension j in relation to the total population in the municipality. The points of greatest vulnerability, when considering each dimension, are geolocated (see Figure 4A). The GIS results are represented with heat maps due to data protection, but they allow specific areas of the population to be identified, and are often easily identifiable with groups of specific dwellings. This level of detail is very useful for the purposes of SS technicians’ actions and allows them to make direct interventions, who can surgically intervene. Regarding the integrated index (IVSS), as Figure 4B depicts, SS are located in the Nucli Antic area of the city. Other points of care concentration are the area of Carrer del Pare Bover, the area of Carrer de Centelles and the area around Vinalab. The comparison between 2019 and 2020 shows increased aid because the PEI aid was prolonged. The in-depth data analysis shows that around 90% of the people in a situation of dependency are Spanish, 58% of whom are women. The number of people receiving care increases with age, with more needs for the people aged 55 years and over, and becomes progressively higher in older age groups. The Nucli Antic area is maintained over time. Family-children vulnerability also occurs in the Nucli Antic area and increases considerably in 2020 compared to 2019, which coincides with the COVID-19 pandemic; 10% of the interventions initiated by SS for children are not completed, which poses a serious risk factor for vulnerability. An ad hoc diagnosis is obtained due to the local origin of the provided data, which can be useful for applying more efficient policies in the social sphere. The spatial approach can supplement the former by providing an exact vision of the geolocation of problems.
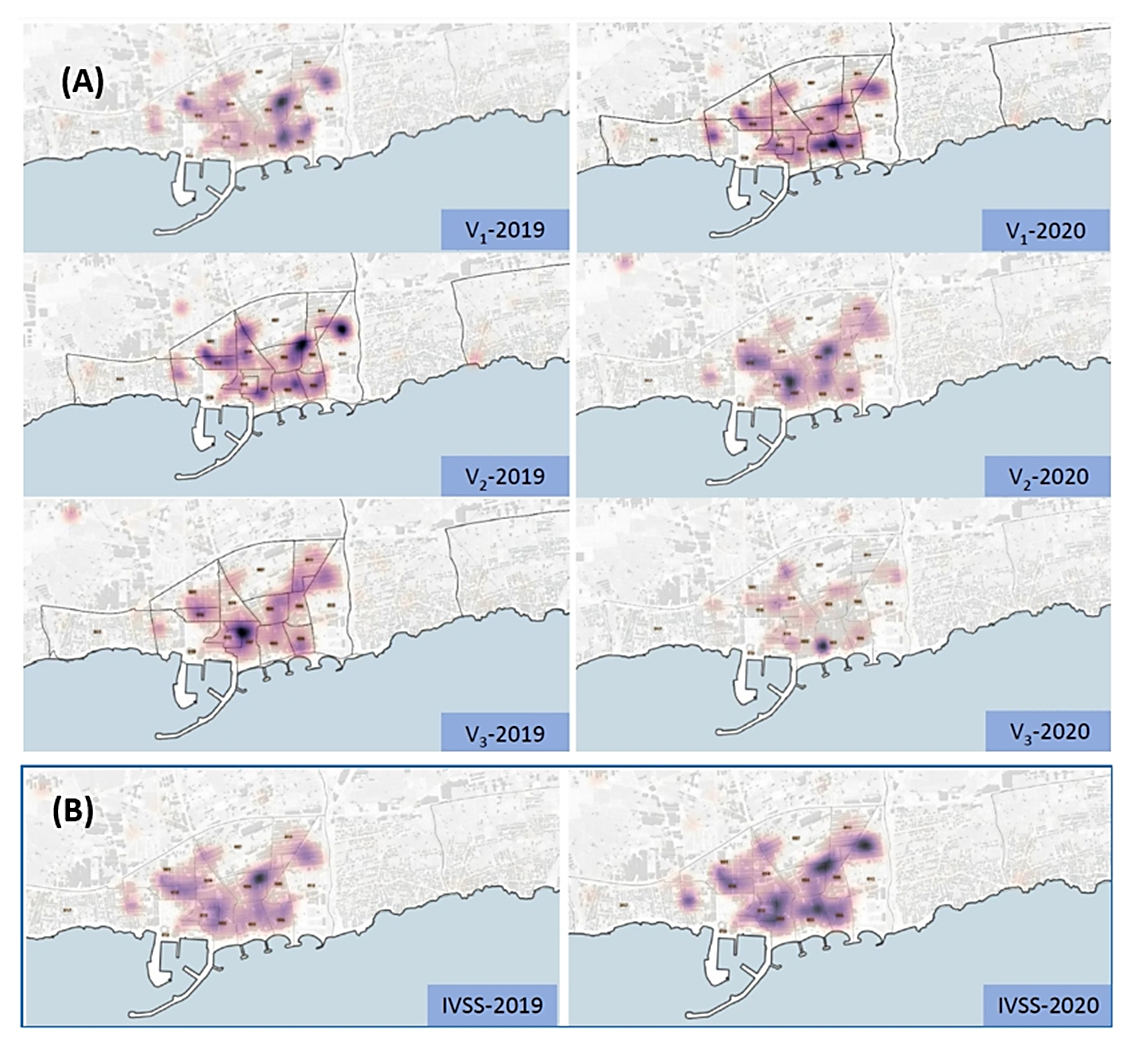 Figure 4. (A) Spatial distribution of the dimensions of vulnerability in 2019 and 2020. (B) Spatial distribution IVSS for 2019 and 2020.
(b) The territorial approach
The territorial approach is based on the calculation of the percentage of files in the census section in relation to the population of the census section, with v1i, v2i and v3i. The number of interventions in the i-th census section is divided by the population in the i-th census section (i = 1, …, 17) per vulnerability dimension.
The calculation of quartiles is required to establish the four vulnerability typologies: residual, low, medium and high. The partial results by vulnerability type are presented in Figure 5A by census tract, where high vulnerability is easily depicted in red.
Poverty vulnerability in 2019 is high in census sections 1001, 1003, 1006 and 1008; in 2020, 1003 and 1006 they remain the same, but the other two change and now include 1010 and 1013. Dependency vulnerability is high in census sections 1003, 1004, 1011 and 1013 in 2019. In 2020, sections 1003, 1011 and 1013 are maintained, and vulnerability appears in 1002. Finally, family-children vulnerability is high in census sections 1003, 1006, 1010 and 1012 in 2019. In 2020, the affected sections are 1005, 1007, 1012 and 1013. This shows variations over the years when looking at census section boundaries, but vulnerability remains the highest in the vicinity of the old quarter and the areas close to the port.
By integrating all the partial indicators by vulnerability type, Figure 5B summarises the IVSS VI obtained in each census section in 2019 and 2020. A situation of persistent high vulnerability is observed in sections 1003, 1006 and 1013, which correspond to the areas of Nucli Antic and Barri dels Mariners, areas that concentrate the most files.
This territorial approach, where the standardised unit census section is used, would be compatible with other models that employ the same measurement unit. For example, the above-defined SUS tool, which could be incorporated into the initially proposed model, constitutes a fourth dimension. This would strengthen the model, especially in terms of detecting relevant social vulnerability problems at a more local level.
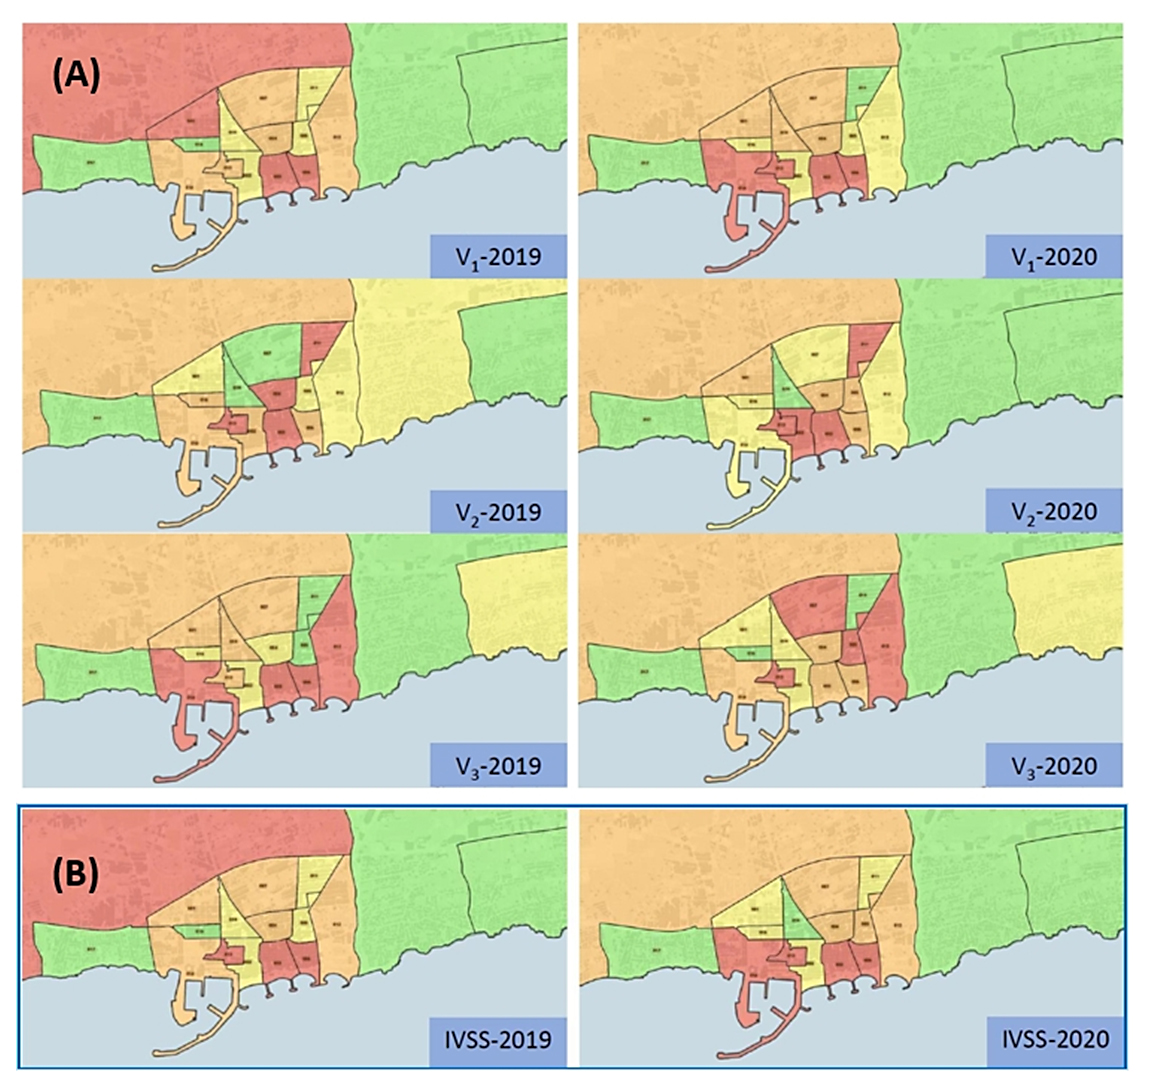 Figure 5. (A) Territorial distribution of the vulnerability dimensions in 2019 and 2020 per census section. (B). IVSS per census section in 2019 and 2020.
The adaptation of the model to different case studies requires the participation of the SS in the municipality to analyse in detail the applied programmes and to collect data on the interventions carried out. In this case, the application of the generic model by using the mathematical Equation (1) results in a sum of three dimensions of indicators, grouped by the types of programmes that technicians consider to be representative. In other case studies, indicators could be adapted to the particularities of the municipality.
For the case study, when analysing the results of applying other tools, such as VEUS (year 2020) and comparing them to those obtained for the IVSS model in its territorial approach, in the census section it is possible to observe some similarities and differences. Firstly, it should be noted that models are based on different indicators; as previously mentioned, the VEUS model includes nine indicators, while the IVVS model includes four from the data on SS interventions, and with a more specific approach. However, their comparative analysis is combined with the data from the City Council’s Strategic Plan, which identified urban areas of vulnerability in certain housing groups or neighbourhood areas, allows some remarkable aspects to be identified (despite this plan dating back to 2018, it is unlikely that these urban data have significantly changed in 2 years). The values presented in Table 3 in red depict high vulnerability, followed by orange, yellow and green for medium, low and residual vulnerability, respectively.
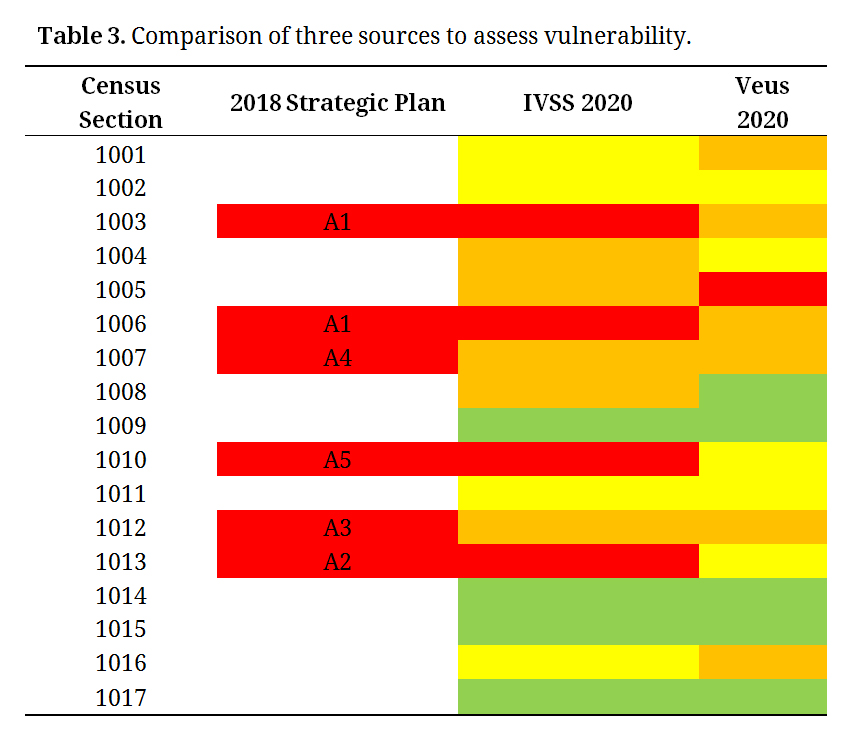 Table 3. Comparison of three sources to assess vulnerability.
Some conclusions drawn from the comparison are:
In six of the 17 census sections, the two models coincide insofar as they present residual or low vulnerability: 1002, 1009, 1011, 1014, 1015 and 1017.
All the high IVSS vulnerability values coincide with the urban areas and groups of dwellings that the strategic plan identified, and do not necessarily coincide with census sections, but are approximately located in 1003, 1006, 1010 and 1013.
The largest difference is observed in census sections 1010 and 1013, which could be explained by the accumulation of files in small areas of the census tract. These are low vulnerability in the VEUS model because it is conditioned by the value of other indicators. This demonstrates that the IVVS model could be useful for detecting traces of high social vulnerability in some cases.
In any case, the model developed in this work is not incompatible with the model developed by VEUS. It is intended to serve as another tool to assess vulnerability and, as mentioned above, the possibility of expressing values by census tract would make it possible to integrate both models. The IVVS model would, on the other hand, require a detailed analysis phase because it needs the information and participation of SS.
Generally speaking, SS programmes are associated with situations of vulnerability in families, children, elderly people, people with disabilities, or any other situation that implies social vulnerability. They can take different forms, such as financial aid, counselling, assistance from social workers, etc. The model presented in this work provides a mathematical formulation based on dimensions evaluated through indicators. This model could be adapted to any other municipality, considering the dimensions that the SS experts deem to be a priority in each place.
The definition of the indicators in the case study was based on the identification of the dimensions proposed by the SS of Vinaroz as the most representative vulnerability variables in this municipality. In other municipalities, it is possible that the SS may consider different dimensions as priorities. In this way, municipalities with distinct features could select other dimensions; for example, interventions linked to care for the elderly in municipalities with problems of depopulation and an aging population [42]; interventions linked to immigration in areas where it might be an issue [43], etc. Ultimately, it will be the primary sources of information, to this end the SS experts, who will provide the answers to outline those interventions that are indicative of social vulnerability.
This paper presents a proposal for an urban vulnerability assessment model that is based on information from actions of municipality SS: the IVSS model.
The proposed methodology is primarily based on a top-down approach, in which territorial vulnerability is analysed by using secondary sources of information. These allow statistical data to be obtained and are very effective for assessing community indicators and for developing global social policies, due to the ease with which these data can be obtained and the large volume of information that allows complex formulas to be developed. However, territorial data is often disaggregated according to population segments that fail to accurately reflect the reality of the social fabric. This methodology introduces a bottom-up approach that leverages first-hand information on vulnerable populations held by local SS in each municipality.
By working collaboratively with the SS, this approach provides a more accurate view of vulnerability, allowing for improved refinement of primary sources data and better interpretation of results. The SS information is crucial to determine which interventions are the most representative and to construct a model of evaluation indicators. It’s essential to have their input and expertise to make informed decisions and develop effective ad-hoc strategies, as has been inferred from the illustrative case of Vinaroz.
The novelty of this lies in it including accurate information on social vulnerability by taking advantage of the interventions of local SS with the most vulnerable population, which is the focus of this department. The programmes managed by SS include different types of interventions that aim to tackle the problems of the most vulnerable population due to issues of different natures, such as programmes that protect children or dependent persons. These interventions come in the form of economic aid or assistance, and are appropriate to each problem. In any case, SS have this detailed information on the people who request this aid.
In the case study, the model results from the inclusion of partial indicators related to poverty, aid for dependency and interventions for family-children by integrating all these aspects into an index called IVSS.
The model is proposed to be adapted to the chosen territorial organisation criteria. Two approaches are shown: one termed spatial, which provides an exact location of interventions for direct and local applications; another called territorial, which uses the criterion of administrative boundaries and employs the standardised territorial unit census section. This second approach makes it possible to see which areas present greater vulnerability, and its application allows its integration into broad comprehensive assessment models that take into account other possible analysis dimensions with the same unit. The model enables results to be monitored over time. This information could be a tool to measure the effectiveness of social policies when other external factors are lacking. Monitoring can even be useful for assessing the influence of certain factors, for example, as seen in the analysed case, where a significant increase in family-children vulnerability claims was detected after the COVID-19 pandemic.
At the regional level, the presented case study aligns with current regulatory framework, Law 3/2019, on the Inclusive SS of the Valencian Community, which focuses on urban intervention in vulnerable neighbourhoods and areas. It also allows the evaluation and monitoring of the impact of SS care in the territory both transversally (by establishing a diagnostic baseline) and longitudinally (continued over time). This constitutes a valuable tool for monitoring the performance of the SS of the population under study. This local vision makes it possible to refine the diagnosis in more global models that need to be adapted to their starting conditions. Although the case study herein developed presents local results, the same model can be applied in other contexts with prior adaptation to their specificities.
The SS interventions expressed by the IVSS complete the social diagnosis as set out in the SDG targets. By taking this social-oriented approach, vulnerable urban areas are identified and measures can be taken to improve them. In this way, strategies like these prove useful for ensuring that no-one is left behind.
All the data generated from the study are available in the manuscript.
All the authors designed the study. Ruá MJ and Agost-Felip MR performed the participation techniques. All the authors analysed the data. Ruá MJ wrote the paper with input from all the authors.
The authors declare that there is no conflict of interest.
We thank the INPRU-CS company and the Municipality of Vinaroz, Department of Social Services, who provided the data for research purposes, and the Department of Urbanism, whose contribution confirmed the obtained results.
1.
2.
3.
4.
5.
6.
7.
8.
9.
10.
11.
12.
13.
14.
15.
16.
17.
18.
19.
20.
21.
22.
23.
24.
25.
26.
27.
28.
29.
30.
31.
32.
33.
34.
35.
36.
37.
38.
39.
40.
41.
42.
43.
Ruá MJ, Agost-Felip MR, Huedo P. Contribution of Social Services to Inclusive Urbanism. J Sustain Res. 2024;6(1):e240003. https://doi.org/10.20900/jsr20240003

Copyright © 2023 Hapres Co., Ltd. Privacy Policy | Terms and Conditions


