Location: Home >> Detail
J Sustain Res. 2024;6(1):e240004. https://doi.org/10.20900/jsr20240004
 ,
Mario Meireles Teixeira 1,
Carlos de Salles Soares Neto 1,
Alana Oliveira 2,
Apoena Mendes Sousa 3
,
Mario Meireles Teixeira 1,
Carlos de Salles Soares Neto 1,
Alana Oliveira 2,
Apoena Mendes Sousa 3
1 DCCMAPI/UFMA/UFPI, Federal University of Maranhao, Av dos Portugueeses, Sao Luis, Maranhao 65000-000, Brazil
2 Computer Engineering, Federal University of Maranhao, Av dos Portugueeses, Sao Luis, Maranhao 65000-000, Brazil
3 Santa Terezinha University Center (CEST), Av Casemiro Junior, Sao Luis, Maranhao 65045-180, Brazil
* Correspondence: Thiago Nelson Faria dos Reis.
Background: As cloud computing continues to gain prominence in our daily lives and business environments, it is crucial for us to be conscious of and proactive in managing the environmental impact of this technology. Green cloud computing is an approach that aims to reduce the energy consumption and CO2 emissions associated with cloud computing while still providing the necessary functionality and performance.
Methods: This study sought to evaluate the feasibility of reducing energy consumption without compromising processing time through efficient algorithms and intelligent strategies using simulators.
Results: A reduction of approximately 55% in energy consumption was observed, leading to a decrease in equivalent CO2 emissions and a 28% reduction in costs associated with virtual machine allocation, ultimately resulting in a reduced environmental impact.
Conclusions: To facilitate the implementation of green cloud computing, a scoring framework was proposed for evaluating the algorithm results, along with an energy efficiency classification framework utilizing artificial intelligence.
The transition to cloud computing has a multitude of advantages, spanning various areas, including computational aspects. One notable benefit is the decrease in energy and cooling expenses for businesses.
However, it is important to recognize that this decrease should not be interpreted as a commitment to environmental sustainability, as the costs and impacts are simply transferred. Those who utilize cloud computing services also share, directly or indirectly, the responsibility for environmental impact.
According to Khan and Khan [1], approximately 10% of the global energy consumption is allocated to electronic and computational devices. Specifically, 50% of this energy goes towards computing activities, with data centers accounting for 29 GW, network equipment consuming 25 GW, and computers utilizing an additional 30 GW.
The remaining 50% was distributed between televisions (44 GW) and other devices (40 GW). Furthermore, Masdari and Zangakani [2] indicated that half of the energy consumed in a datacenter is allocated to heat dissipation, specifically for cooling.
In other words, the responsibility for an efficient and environment-friendly computing system is shared by all. Understanding these differences is crucial to achieving green computing. Green computing focuses on reducing energy consumption, utilizing renewable resources, and maximizing resource efficiency.
To achieve this objective, it is crucial to have knowledge of the techniques, frameworks, methodologies, and classifications of green computing. Such knowledge provides a foundation for analysis, development, and implementation in this specific area. Notably, various approaches in terms of software, hardware, and virtualization aim to optimize resource usage and reduce CO2 emissions and environmental impact [3].
As stated by Saha [4], the criteria for selecting a cloud infrastructure are evolving. In addition to the computational and financial aspects, it is becoming increasingly important to consider the energy efficiency of data centers and the use of renewable resources when making this decision.
The approach to green computing extends beyond energy consumption, encompassing the efficient management of water resources, utilization of renewable sources, and minimization of computational waste by utilizing only the necessary resources.
This study explores studies related to green cloud computing and energy sustainability. The next section examines the primary categories and strategies for reducing the energy consumption in green cloud computing. Subsequently, the methods employed in this research are discussed, along with the most frequently used computational metrics for evaluating data center energy efficiency and ensuring the quality of service.
Through a quantitative methodological approach, the objective was to demonstrate that it is feasible to reduce energy consumption without causing significant losses in the service quality indicators. This requires maintaining accurate response times and processing volumes by adopting more efficient algorithms for virtual machine (VM) allocations. In this specific case, round-robin (RR), Particle Swarm Optimization (PSO), Dynamic Voltage and Frequency Scaling (DVFS), and Ant Colony System (ACS) algorithms were considered, with the latter being included as a potential solution among the various options discussed in previous studies.
For the simulation experiments, various configuration scenarios were executed over 800 iterations. The processing of these simulations required approximately 51,000 h. In the following section, the results obtained are presented, along with their corresponding academic conclusions.
After analyzing and discussing the simulation steps, two proposals are presented in detail. The first involves calculating a performance index based on the simulation results of the algorithms, allowing for comparison and evaluation of their efficiency. The second proposal involves developing an energy-efficiency scale using calculated indices combined with artificial intelligence techniques to classify and predict the energy performance of algorithms in different green cloud computing scenarios.
In conclusion, it can be stated that sustainable cloud computing and the minimization of computational waste are relevant areas in the pursuit of greater energy efficiency and sustainability. This can be achieved using effective and intelligent algorithms.
Given the wide range of physical and logical approaches, and their potential for various applications, the field of green cloud computing is an area ripe for research. This has driven the development of computational methods to efficiently utilize computational resources and reduce costs, thereby benefiting both service providers and users.
Regarding the analysis and estimation of resource usage, cloud computing simulators have gained prominence owing to their inability to create a complex cloud environment for conducting experiments. The following studies presented the use of approaches and simulators for this purpose in cloud environments.
Experiments were conducted by Meyer et al. [5], Makaratzis et al. [6], and Jena et al. [7] using multiple cloud simulators and algorithms such as the first-fit approach and round robin. The objective of these studies was to analyze and compare the results obtained using different simulators with one another.
Numerous researchers have employed CloudSim as a simulation tool to conduct experiments with algorithms such as DPSO, DENS, round robin, green scheduler, and genetic algorithms [8–11]. The purpose of the analysis is to compare these algorithms in terms of their execution time and energy consumption.
The study conducted by Silva et al. [11] provides a comparison between CloudSim and iSPD simulators, demonstrating the effectiveness of the latter and thus offering a new option for researchers to explore.
By contrast, Stergiou et al. [12] examined green cloud computing in the context of Big Data. Through experiments, they compared various algorithms using the DCIE metric, and observed a significant energy reduction of at least 47%. Saboor et al. [13] utilized distribution-based classification algorithms and compared their results with those of CO2 emission metrics.
Regarding approaches to renewable energy generation, the study conducted by França et al. [14] examined the application of neural network algorithms to wind-power forecasting. This study aimed to assess the feasibility of using this type of model in large-scale data centers.
Araujo [15] provided a global overview of renewable energy utilization in the field of alternative methodologies for green cloud computing. Cloud providers have the opportunity to not only benefit from these technologies but also invest in and encourage research in this area.
This research contributes to the field by expanding the range of algorithms utilized in these models, specifically particle swarm optimization, dynamic voltage and frequency scaling, and ant colony systems. These additions are in line with similar studies that evaluated these algorithms for big-data workloads.
A wide range of approaches can be implemented to optimize energy efficiency, potentially increasing profitability and reducing environmental impact. These approaches have been recommended to ensure optimal benefits in various ways [1,2,15–19].
More effective management of virtual machines can be achieved through techniques such as VM consolidation on physical servers, processor speed reduction, task reallocation, use of specialized distributed software engineering, and allocation in energy-efficient data centers.
Hardware-based approaches are also viable, including reducing heat dissipation, energy-aware planning of boards and processors that enable independent power transmission, and utilization of more efficient storage options. Other strategies include the utilization of renewable sources and the reuse of energy resources such as wind, solar, and hydroelectric energy.
For the scope of this study, we adopted an approach focused on managing virtual machines on physical servers through VM consolidation and the shutdown of unused machines. This strategy does not require modifications to the physical equipment or investment in infrastructure, making it applicable to policies that can be implemented in any cloud environment.
As a result of this study, two significant outcomes arise: (1) the establishment of an energy efficiency scoring calculation based on the various metrics and strategies examined and (2) the proposal of a classification system for these calculated scores, leading to an energy consumption seal (similar to those found in household appliances) that determines the data center’s category and its potential for achieving high levels of energy efficiency.
This study proposes an innovative approach to investigate and classify energy efficiency in green computing data centers with a focus on calculating energy efficiency scores and introducing a system of energy levels using neural networks for classification.
Energy Efficiency Model DiagramThe conceptual map shown in Figure 1, detailed in Table 1, delineates each stage of the research process from the initial setup of the simulation environment to the final analysis of the results. This model provides a comprehensive overview of the workflow and interactions among the different components of the study, offering a detailed description of each stage, which allows a clear understanding of the methodology employed. Moreover, it highlights the systematic integration between the different phases of energy efficiency analysis in green cloud computing, allowing for a deeper understanding of the research process and the data collected, processed, and analyzed.
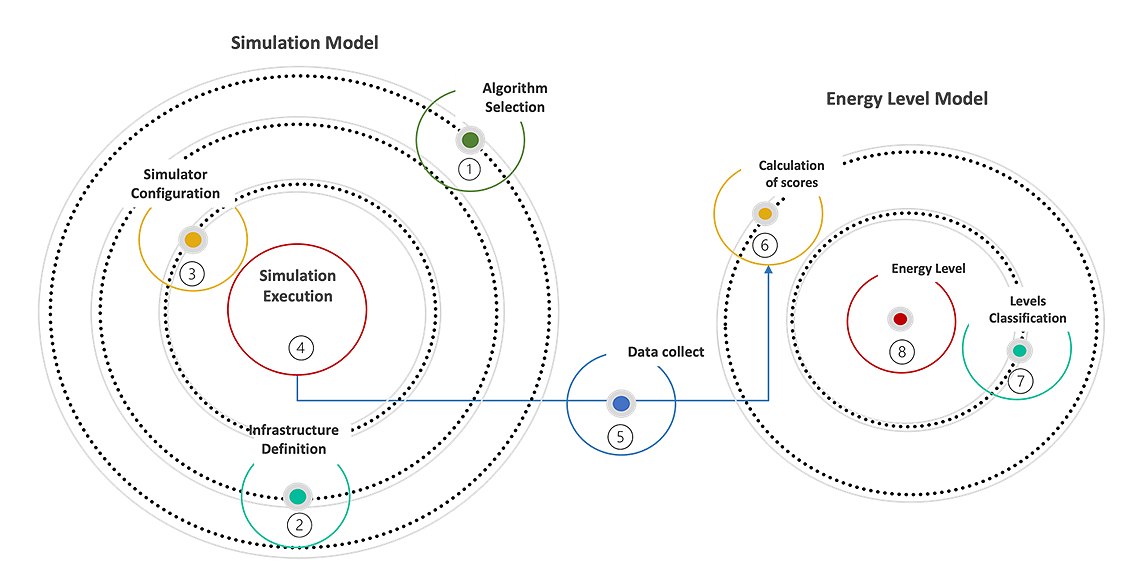 Figure 1. Energy efficiency model. Source: Created by the authors (2024).
The process begins with the (1) selection of scheduling algorithms and the (2) definition of the datacenter infrastructure. This choice may be based on its representation in specialized literature, its potential contribution to energy efficiency, or the actual architecture of the datacenter. At this stage, it is also necessary to establish the baseline configuration or initial parameter for comparison, which is essential for the subsequent efficiency calculations.
The third stage is (3) simulator configuration, which utilized CloudSim Plus in this study, incorporating the aforementioned definitions, structures, and algorithms.
In this study, the steps of (4) conducting detailed simulations and (5) closely monitoring the performance of the data centers are crucial for gathering essential data such as energy consumption, application runtime, operational costs, and CO2 equivalent emissions (CO2eq). The analysis of these data is essential for quantifying and evaluating the energy efficiency of algorithms under various operating conditions.
The (6) scoring calculation stage played a central role in the second phase of the model. This involved normalizing the collected data, followed by the application of a preselected algorithm. The result is a score that reflects the energy efficiency of each analyzed configuration, with weights assigned to criteria such as execution time, energy consumption, CO2 emissions, and costs. This approach provides a quantitative performance evaluation of the energy efficiency of the configurations.
Based on the proposed model flow, (7) involves the classification of different energy levels through artificial intelligence classifiers, specifically artificial neural. This approach is an innovative and predictive method for classifying the energy performances of algorithms under various operating conditions. This classification allows for efficient categorization of energy levels.
Finally, the model enables the (8) identification of the current energy level of the data center. This result provides crucial insights into the implementation of effective interventions that facilitate decision-making for optimized and sustainable operations.
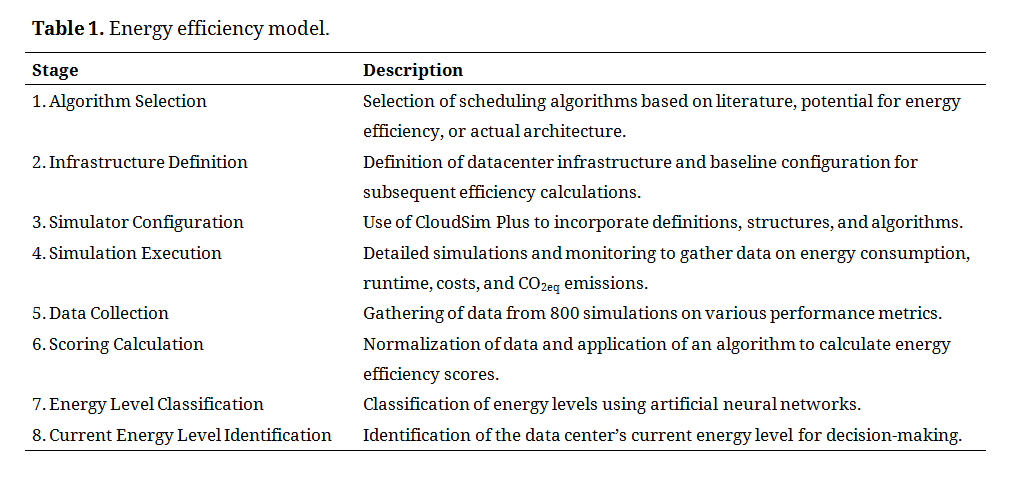 Table 1. Energy efficiency model.
CloudSim Plus, an advanced and enhanced version of CloudSim [10,11,20–22], was selected as the simulation tool for this study. This simulation framework is widely recognized for its flexibility and ability to model complex cloud-computing environments. This allowed for detailed simulations of various scenarios, including the allocation and management of virtual machines, thereby providing a realistic and robust foundation for our analyses. Furthermore, as a widely disseminated tool, it enables comparisons among similar studies.
Four primary algorithms were selected for this study, each of which embodies a distinct methodology for virtual machine scheduling methodology in cloud environments.
Round Robin (RR): This is one of the simplest and most widely used algorithms for load balancing. It allocates tasks sequentially, thereby ensuring an equitable distribution of work among servers [23].
Dynamic Voltage and Frequency Scaling (DVFS): This algorithm dynamically adjusts the tension and frequency of processors according to workload demand, thereby reducing energy consumption when the load is light [17].
Particle Swarm Optimization (PSO): Inspired by nature, the PSO algorithm mimics the social behavior of bee colonies. Optimal solutions are sought by determining efficient resource allocation configurations in terms of energy [19].
Ant Colony System (ACS): This algorithm imitates the behavior of ants in their search for optimal paths, demonstrating an efficient approach to solving optimization problems [24].
These algorithms embody a balance between proven methods and emerging innovations, enabling extensive analysis of various strategies within the context of sustainability and energy efficiency.
Infrastructure DefinitionThe purpose of this experiment was to validate the potential for reducing energy consumption without compromising the computational capacity of the cloud environment. Four virtual machine scheduling algorithms were used: Round Robin (RR), Dynamic Voltage and Frequency Scaling (DVFS), Particle Swarm Optimization (PSO), and Ant Colony System (ACS). The same parameters as those used in the study by Stergiou et al. [12] were used, with the number of hosts ranging from 50 to 250. Each host had configurations consisting of two cores at a clock speed of 2.2 GHz per core and 4 GB of memory, as illustrated in Figure 2.
Utilization of the proposed model [12] in this study is necessary because of the use of Big Data. In contrast to previous studies, we focused on a single datacenter, which is a common scenario in various situations. We designed all experimental scenarios using a complete factorial design approach based on a systematic performance evaluation of computational systems [25], with 10 runs per scenario. The obtained values were reported with a 95% confidence interval, according to the student’s t-test.
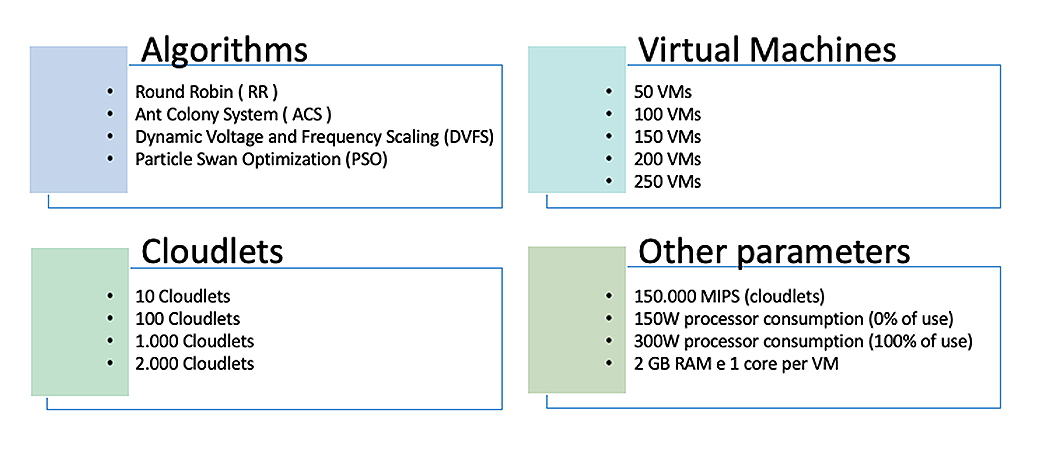 Figure 2. Experimental model. Source: Created by the authors (2023).
In addition to virtual machines, the number of cloudlets or applications executed in the environment was parameterized to evaluate the model under different workloads.
●
●
All other configurations, including storage and bandwidth, remained identical in all scenarios. In addition, it has been established that energy consumption is 150 W when idle (0% utilization) and 300 W when operating at full capacity (100% utilization) [12,26].
Finally, allocation policies were established for the simulations to evaluate response times, energy consumption, and execution costs. It is important to note that monetary values are expressed in US dollars and extracted from the bases and configurations of the American AWS [26] as well as processor energy consumption.
For each execution, data regarding the application processing time, cost, energy consumption, and other relevant information were collected. The total simulated processing time was 51,909 h (approximately 2163 d) and 800 simulations were performed.
Data Collection ProcessThis study meticulously gathered data from 800 simulations to assess various scheduling algorithms across different setups and loads, focusing on key performance indicators, such as execution time, cost, and energy usage. Although CloudSim provided direct cost data from simulations [26] and insights into energy consumption, it lacked data on CO2 emissions. Nevertheless, this gap was filled using parameters from the Environmental Protection Agency [27], which facilitated emissions calculations under American standards. The collated data, which are crucial for evaluating operational efficiency and environmental sustainability, are thoroughly detailed in the subsequent tables.
Analysis of ResultsThe analysis phase evaluated the machine virtualization algorithms for energy efficiency in datacenters across various workloads. Employing statistical analysis with a 95% confidence interval via Student’s t-distribution, suitable for small samples and unknown population standard deviation, we determined the true mean of the key performance metrics within a specified range. These metrics include the runtime, energy usage, costs, and CO2 equivalent emissions. Efficiency gains were quantified, highlighting algorithms that optimize energy and operational efficiency. Furthermore, trends and patterns are discerned from the data-informed future algorithm and scheduling strategy selection for sustainable cloud computing datacenters.
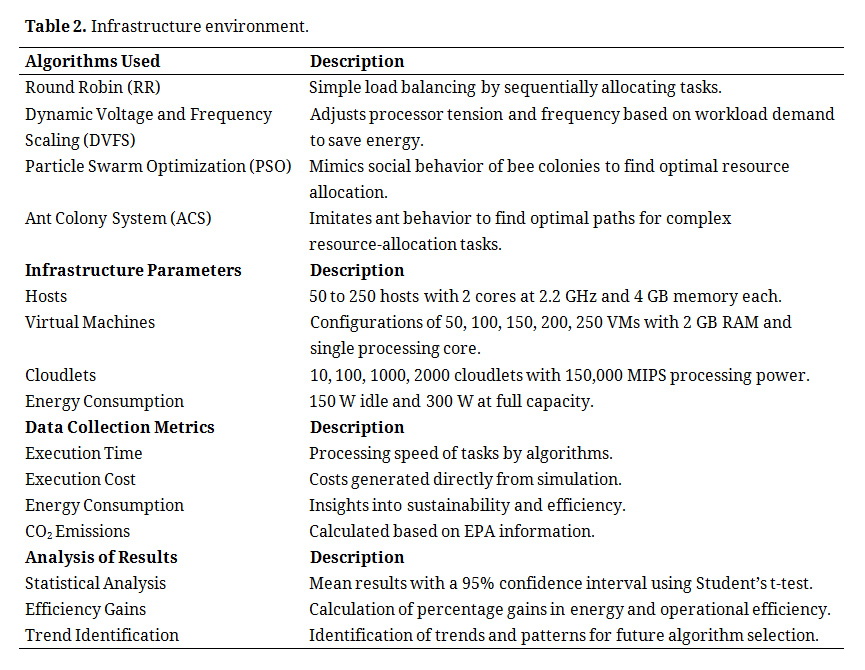 Table 2. Infrastructure environment.
Table 2 systematically encapsulates the aggregated data from this study, detailing the performance and evaluation metrics of various machine virtualization algorithms. This includes algorithm descriptions, infrastructure parameters, data collection metrics, and analytical results pertaining to the execution time, cost, energy consumption, and CO2 emissions. The table further illustrates the statistical methods applied and the results obtained, including the confidence interval and efficiency gains. Additionally, it provides a summary of the algorithmic trends and patterns discerned from the study, which are critical for formulating strategies to boost the sustainability and operational efficiency of cloud-computing datacenters.
Energy Efficiency ScoresThis study outlines a methodology for calculating energy efficiency scores, which are crucial for evaluating green cloud computing datacenters. Initially, data dictionaries were defined and initialized using metrics relevant to energy efficiency, including energy consumption, CO2 emissions, execution time, and operational costs. These metrics were weighted based on their relative importance, reflecting the complex nature of energy efficiency in datacenters. Data normalization was essential to ensure fair comparisons across different scales of metrics, enabling a uniform analysis. A standard baseline for comparison was established, allowing the assessment of the scheduling algorithm performance against a benchmark. Following normalization, the energy efficiency scores for each configuration and algorithm were calculated using a mathematical formula that incorporated weighted metrics, yielding a score reflecting the energy efficiency of each algorithm configuration compared to the baseline. The algorithms were then ranked based on their scores, providing a hierarchical view of their energy efficiency and environmental sustainability performance.
Energy Level ModelIn this study, we introduced an energy-level model integral to our methodology for assessing energy efficiency in green computing. The model comprises a five-tiered energy-efficiency scale, labeled A to E, to quantitatively classify datacenters, where A indicates top efficiency. A round-robin algorithm with 50 virtual machines exemplifies Level E, which has the lowest efficiency, whereas Level A denotes the configurations with the highest scores. The energy level scale operates on both the vertical and horizontal axes; the vertical axis delineates a descending order of energy efficiency, and the horizontal axis adds a sustainability measure focusing on renewable energy use. Furthermore, we leverage artificial intelligence, specifically neural networks, to categorize energy efficiency scores, showcasing the capability of our method to handle complex, multidimensional energy efficiency data.
The comprehensive methodology described in the preceding steps is summarized in Table 3, which presents a structured approach for the evaluation of energy efficiency in green computing datacenters. This approach encapsulates both the calculation of Energy Efficiency Scores and formulation of an energy-level model, which is pivotal to our analysis.
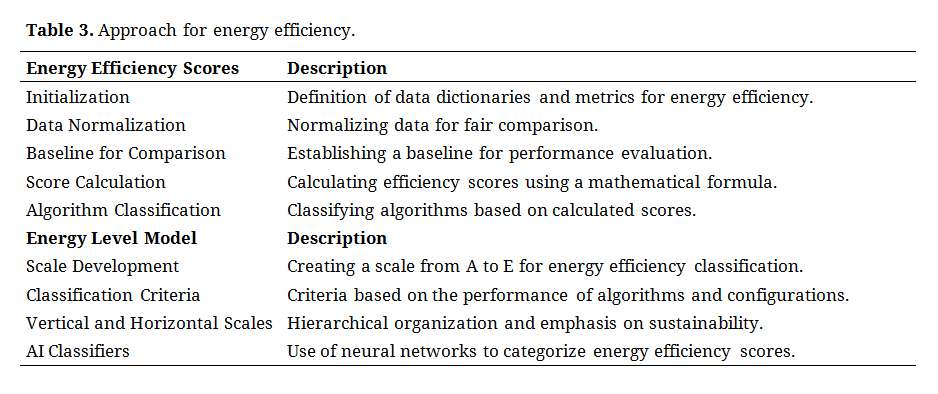 Table 3. Approach for energy efficiency.
The simulation results are presented in this section. The defined input data satisfied the requirements for both the light- and heavy-workload conditions. The simulation results obtained were compiled and analyzed to evaluate the criteria discussed in the previous sections. The outcomes consolidated for this study demonstrate the configurations used, the results achieved for each algorithm, and their relationship to illustrate the percentage of improvement achieved.
Statistical ValidationIn this study, a rigorous statistical validation method was employed to analyze the performance of the algorithms, including the Round Robin, which served as the benchmark, and all other algorithms and scenarios. This made it possible to comprehensively assess different configurations, identify significant patterns, and compare them. This deepened our understanding of the potential and limitations of the different energy-saving approaches and reinforced our confidence in the results obtained.
Utilizing statistical measures such as mean, standard deviation, and confidence intervals, our analysis of the collected data revealed the behavior of Round Robin under different virtual machine configurations, as presented in Table 4. Our results indicated that the minimum execution time remained constant at (0.30 s). As the number of virtual machines increases, we observe a decrease in the maximum execution time, from 69.12 s with 50 VMs to 4.51 s with 250 VMs. This suggests an improvement in task distribution, although this improvement diminishes in larger VM configurations, revealing the inherent limitations of the round-robin algorithm in more complex scenarios.
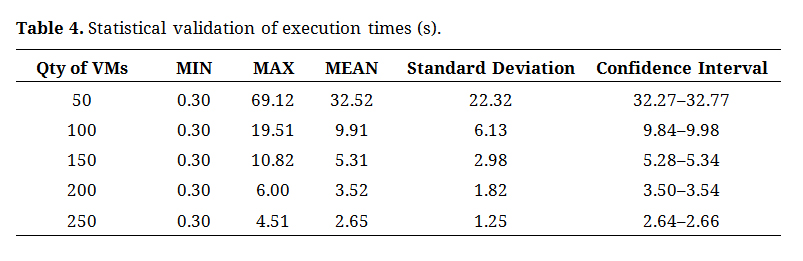 Table 4. Statistical validation of execution times (s).
The analysis of the mean and standard deviation of the execution times supports these observations. The average time followed the trend of the maximum time, decreasing as the number of VMs increased, whereas the standard deviation notably decreased, indicating a lower variability in the execution times. This latter aspect suggests a growing stability in the execution time as the distribution of virtual machines increases. The 95% confidence interval for the execution times provides additional insight into performance predictability, reinforcing the reliability of the obtained results.
The consistency in CO2 emissions displayed in Table 5, with minimal variations between VM configurations from 116 for 50 VMs to 102 for 250 VMs, indicates that the algorithm does not offer significant advantages in terms of environmental sustainability. The standard deviation, which is relatively constant in all configurations, reinforces the fact that the algorithm maintains a relatively uniform emission profile, independent of the scale of the distributed computing environment or workload. This observation suggests the need to explore more energy-efficient and sustainable alternatives in information and communication technologies.
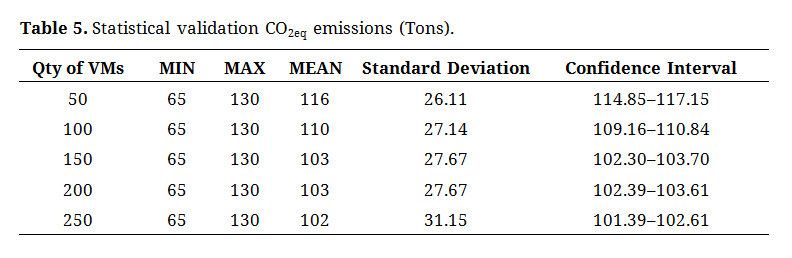 Table 5. Statistical validation CO2eq emissions (Tons).
All results for the following scenarios were validated according to the confidence interval approach described in this section.
Scenario 1: Processing time of applicationsWhen analyzing the literature on computational performance, it is important to consider application processing times as a measure of effectiveness in a given scenario. Upon reviewing the data presented in Table 6, it can be observed that there were no significant reductions in the processing time. This indicated that the adoption of the scheduling algorithm for this particular scenario did not hinder the processing capacity of the model or violate the SLA, with only a slight increase observed for the DVFS algorithm.
It is crucial to emphasize that the utilization of a more distributed computational model resulted in significant improvements, with an average processing time reduction of 70% when transitioning from 50 to 100 virtual machines and an 83% reduction when moving from 50 to 150 virtual machines while maintaining the same workload. The findings are summarized in Table 6.
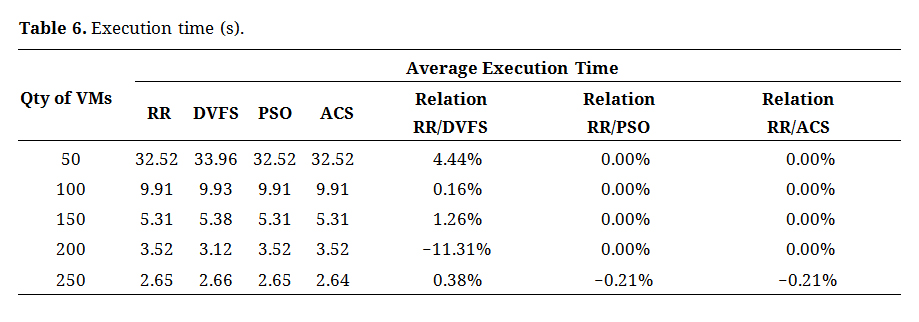 Table 6. Execution time (s).
The increase in virtual machine scaling beyond this quantity did not result in a significant performance improvement, with only a 7% increment between 150 and 200 virtual machines and an 8% increment between 200 and 250 VMs. The effectiveness of this performance enhancement is contingent on the design of the distributed models, as presented in Table 7.
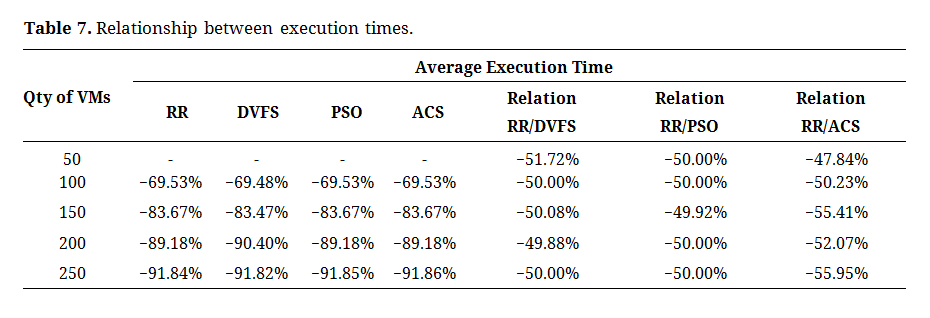 Table 7. Relationship between execution times.
Considering the energy scenario, a minimum reduction of 47% in energy consumption for the same workload was observed based on the consolidated analysis presented in Table 8 and depicted in Figure 3. This reduction is evident when compared with the RR algorithm with a model of 50 virtual machines. Additionally, there was an even greater reduction in the energy consumption of approximately 55.41% with the ACS algorithm in a model of 150 VMs.
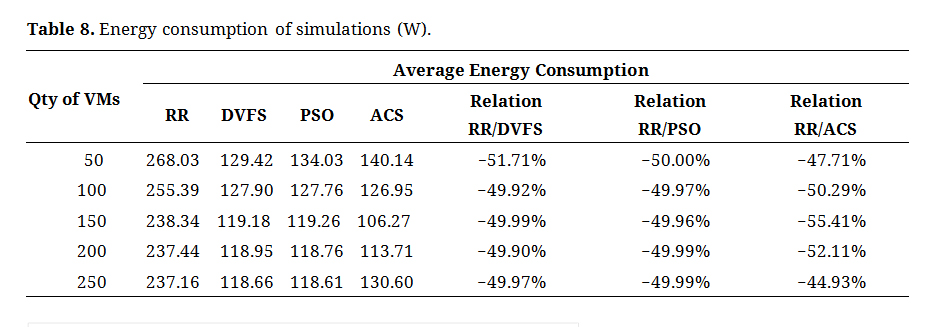 Table 8. Energy consumption of simulations (W).
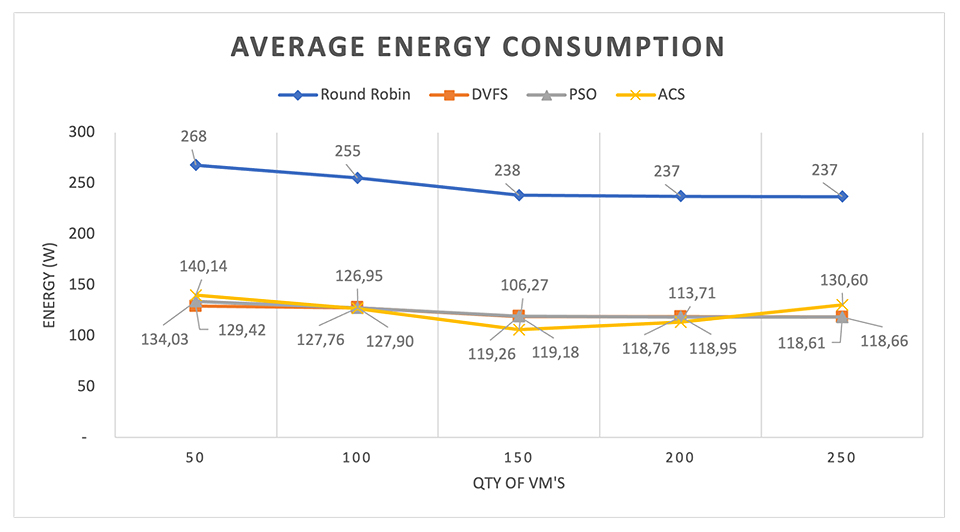 Figure 3. Energy consumption. Source: Created by the authors (2023).
The energy consumption of the DVFS and PSO algorithms demonstrated similar values, with variations of less than 3% between them, whereas the ACS algorithm achieved an 11% higher energy gain than the other algorithms.
Scenario 3: Cost of application executionThe simulator calculates the costs based on the virtual machine configurations and parameters mentioned in the Infrastructure Definition section.
As shown in Table 9, significant reductions were observed in the simulated values, with a minimum of 8% for the simplest scenarios and exceeding 34% for the most complex scenario regarding virtual machine allocation. However, it is worth noting that the DVFS algorithm has the same virtual machine allocation model as a Round Robin, but manages processor energy more efficiently. Therefore, choosing the DVFS algorithm over RR results in reduced energy consumption without cost savings for the machine allocation.
When comparing the architecture models, the ACS algorithm demonstrated greater cost reduction owing to its improved effectiveness in distributed environments. This trend highlights the importance of constructing distributed infrastructure and developing applications that can benefit from this environment.
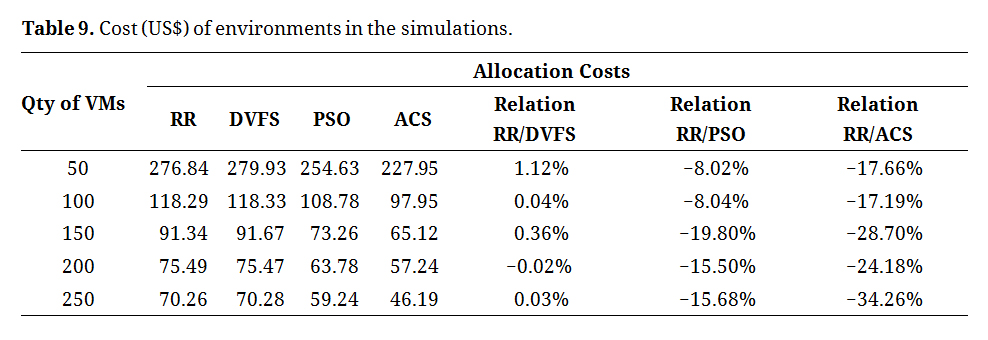 Table 9. Cost (US$) of environments in the simulations.
The energy consumption of the datacenter is directly linked to the carbon dioxide emissions equivalent to energy. This study specifically focuses on equipment energy usage, so it was necessary to calculate and compare carbon dioxide emissions using the American reference from EPA [27], as parameters from AWS located in the United States were used. The energy consumption related to cooling, networks, and other electrical equipment was not considered in this analysis.
A comparison of the allocation strategies, as shown in Table 10 and Figure 4, clearly indicates that the carbon equivalent emissions in all three algorithm models are significantly lower than those of the round-robin algorithm. This method considers the total energy consumption for each configuration.
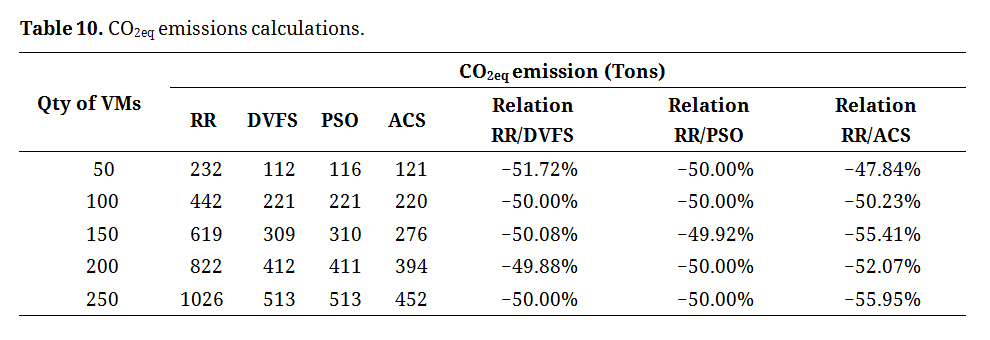 Table 10. CO2eq emissions calculations.
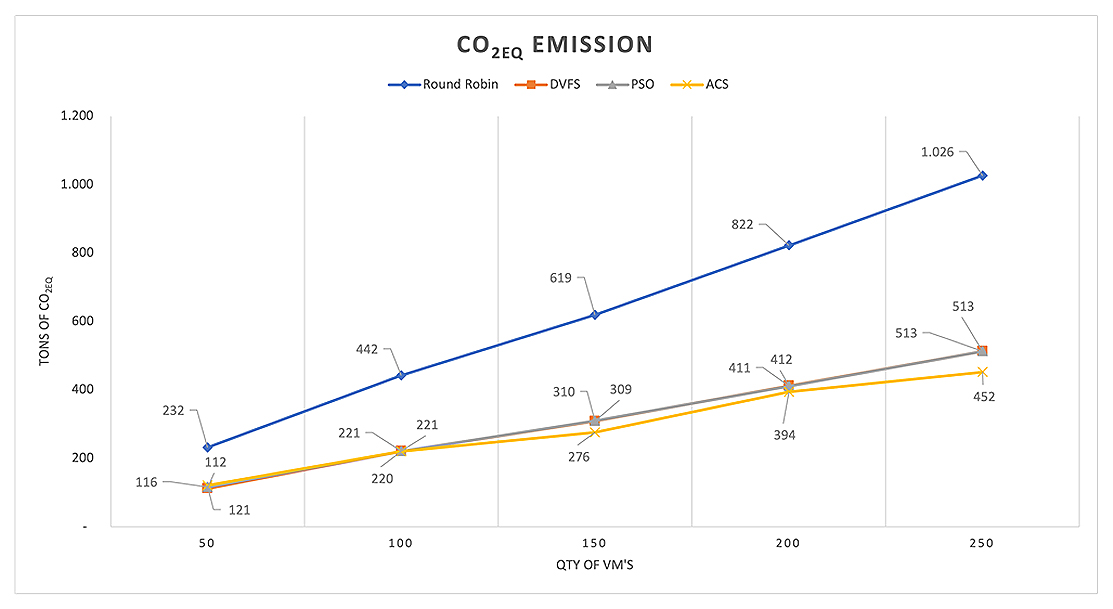 Figure 4. CO2 emissions of the models. Source: Created by the authors (2023).
The study highlights that employing the Ant Colony System (ACS) algorithm in cloud computing significantly enhances environmental outcomes by reducing CO2 emissions compared to other algorithms, with an 11% improvement over the Particle Swarm Optimization (PSO). The ACS algorithm shows CO2 reductions of 121–452 tons, a marked decrease from Round Robin’s 232–1026 tons over a 521-day simulation. The emission increases were notably lower with ACS, indicating superior energy optimization.
When comparing all algorithms for each model and workload, a decrease in CO2 emissions of at least 49.88% and a maximum of 51.72% were observed for DVFS, and between 49.92% and 50% for PSO. In relation to ACS, there was a range of 47.84%–55.95% compared to the round-robin algorithm.
In summary, this study emphasizes the potential to significantly decrease the environmental impact associated with cloud computing through efficient resource management techniques and strategies. As revealed by the simulated scenarios, a minimum reduction of 50% in environmental impact can be achieved without compromising the computational capacity.
In relation to the four simulated models, it can be concluded that the model utilizing 150 virtual machines provides the most favorable cost-effectiveness. By implementing the ACS algorithm in this model, a reduction of 55.41% in environmental impact and CO2 emissions, and a decrease of 28.70% in direct allocation costs can be achieved. Furthermore, compared with the model with 50 virtual machines, there was an approximately 84% reduction in response time.
These findings underscore the capabilities and effectiveness of green cloud computing, emphasizing the importance of the broader adoption of sustainable practices in the IT industry.
To conduct an analysis of the results in a more objective manner while avoiding subjective criteria, this study suggests implementing scores for different configurations and algorithms. The purpose of these scores is to identify the range of possible scores that can be achieved in each scenario, and to determine the level at which the data center operates.
To achieve this, we utilize a model based on commonly used algorithms in multi-objective optimization and multi-criteria decision-making. We incorporated weights and normalized the results to create a ranking system [28–31].
Definition of WeightsOne of the challenges posed by using weighting is defining the weights for each metric, as this importance can be relative, depending on the objectives of each datacenter. In this study, we adopted weights for the metrics. However, the proposed algorithm can use these parameters to make the solution more flexible.
Therefore, the goal of the proposed algorithm for calculating scores is to establish an efficiency rating for each configuration and algorithm based on their respective results while assigning weights to each factor. In other words, factors such as CO2 emissions, energy consumption, execution time, and cost were considered.
Determining the appropriate weights for metrics in a datacenter scenario is influenced by various factors such as the specific nature of the datacenter, its operational objectives, and organizational priorities.
CO2 Emission: The global focus on sustainability and concerns about climate change have led many companies to prioritize the reduction of their carbon emissions. If the datacenter has strict sustainability goals or is located in an area with stringent emission regulations and growing consumer demand for greener practices, this burden can be higher.
Energy Consumption: The energy consumption of a datacenter is closely linked to its operational cost and efficiency. In addition to financial considerations, excessive energy consumption also has significant environmental implications. Consequently, many datacenters are striving to operate them in an energy efficient manner. Consequently, this metric has gained substantial importance because of its direct impact on CO2 emissions.
Considering the proportional relationship between these two metrics, it was feasible to treat them as a combined metric. Alternatively, they can be kept separate while assigning similar weights to acknowledge the interdependence.
However, they must collectively account for a substantial proportion of the total weight.
Execution Time: Performance is critical for most datacenters, as a longer execution time can negatively impact user experience and operational efficiency; if clients or applications of the datacenter are sensitive to response time, this factor will carry greater weight.
Therefore, it is recommended that the weight of this metric be similar to the combined weight of the previous two metrics to balance SLA and environmental impact. However, if the computational performance is not a critical objective, the weight can be reduced to focus on the energy consumption and carbon emissions.
Cost: Most organizations are concerned about costs, but their priorities may vary. Cost can be indirectly reflected in metrics, such as CO2 emissions and energy consumption, as both have associated cost implications. However, direct operational expenses remain distinct and significant, which is why they have been emphasized.
To ensure that the weighted combination of all metrics results in a score that reflects the total proportion or percentage of the evaluation criteria, the sum of the weights should be equal to one. When the weights add up to 1 (or 100%), this offers several advantages.
Normalization: By ensuring that the total is one, the criteria are normalized. This allows for intuitive interpretation of the results and easy comparison across different scenarios or alternatives.
Clear Interpretation: When weights add up to 1, the relative contribution of each metric to the total score is clearly understood. For instance, if a metric has a weight of 0.3, it clearly indicates that this metric represents 30% of the total importance in calculating the score.
Simplified Comparison: When comparing different alternatives or scenarios using the same set of criteria, having weights that sum to one in all scenarios ensures fair and consistent comparisons.
Consistency in Multi-criteria Methods: Many multicriteria decision methods, such as the Analytic Hierarchy Process (AHP), employ the convention that weights sum to one. This ensures consistency and comparability across approaches and applications.
To achieve this, the round-robin algorithm was utilized, with a configuration of 50 reference VMs as baseline values. The efficiency score was calculated based on the difference between the results from RR and other algorithms and configurations, weighted by the importance of each metric.
Calculation Algorithm ProposalThe following section outlines the procedural steps of our methodology for evaluating energy efficiency. The computed efficiency scores are derived from a mathematical formula that captures the multidimensional nature of the energy efficiency assessment, as presented below:

In this case:
●
●
●
●
The result of this formula, the score, represents the efficiency rating of the j-th VM configuration in a specific algorithm. The higher the score, the better is the configuration in terms of minimizing CO2eq emissions, energy consumption, processing time, and cost.
Score ResultsWhen executing the proposed algorithm, it is possible to assign an efficiency score for each virtual machine configuration and a specific algorithm, as previously discussed. We chose to perform parameterizations to identify their behavior and evaluate different aspects related to weight configurations.
The parameterization of the Score Calculation algorithm considered the direct relationship between energy consumption and CO2 emissions to maintain the SLA of the initial model. The following weights were assigned: 0.2, 0.2, 0.4, and 0.5, for energy consumption, CO2 emissions, processing time, and costs, respectively.
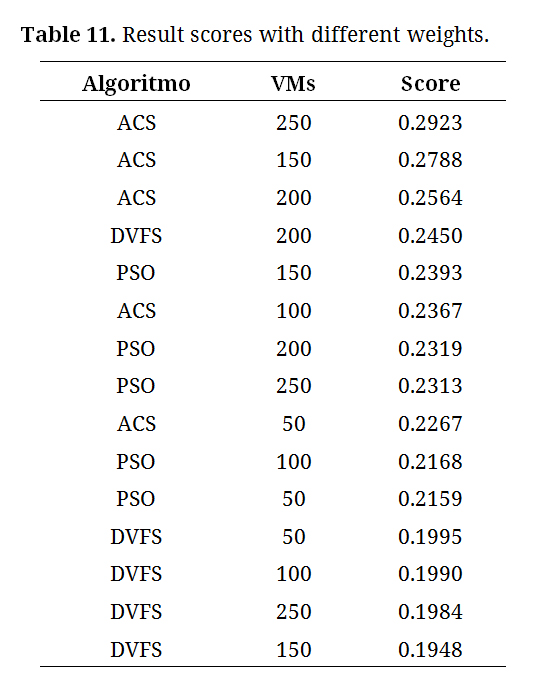 Table 11. Result scores with different weights.
According to Table 11, assigning different weights to the metrics indicates that the ACS algorithm model with 250 VMs was more efficient. This analysis highlights the potential of determining metric priorities based on organizational objectives.
This approach facilitates the transition from a subjective perception to an objective and balanced perspective in information analysis, highlighting the importance of conducting thorough and meticulous evaluations. It has been demonstrated that by clearly defining weights and priorities for the metrics used, significant insights can be gained regarding the identification of the most efficient virtual machine configuration in terms of CO2 emission reduction, energy consumption minimization, processing time optimization, and cost efficiency.
Based on the findings obtained in the previous section, it is feasible to propose an accurate energy-level scale that can be easily implemented in a specific datacenter and aligns with the need to monitor and manage the energy consumption in the datacenters.
This scale was divided into five levels (A–E) and assigned scores obtained from the various configurations and algorithms presented. The round-robin algorithm with 50 virtual machines was used as a reference and was classified as level E.
Level A is characterized by the best configuration score and algorithms, whereas the subsequent levels organize the other scores. This scale provides a strategic diagnosis, allowing the identification of areas with optimization potential and implementation of energy-efficient solutions.
The implementation of this Energy Level Scale in specific data centers not only allows for accurate monitoring of energy consumption but also promotes more sustainable management of energy resources, thus meeting the growing demands for sustainability and environmental responsibility. In addition, the practical application of this model can significantly contribute to the creation of an energy management framework in IT environments, which may lead to advancements in research and development in the field of energy efficiency.
One of the main challenges in this stage is the proper distribution of the scores obtained in the previous section into different proposed categories of clustering and classification. This task can be accomplished using distinct approaches depending on the characteristics of the data and the objective of categorization. A frequent strategy for grouping numerical values into five levels is to employ statistical techniques and machine-learning algorithms [32–34].
The main objective of these techniques is to group the numerical values into clusters that share similar characteristics. Various strategies can be employed based on the available information and purpose of categorization.
When selecting a technique, it is crucial to consider its suitability to the available dataset and segmentation goals. Although percentile-based division may be appropriate for some applications, more advanced techniques can be chosen in complex contexts to uncover underlying patterns.
To perform this task, one can utilize the k-means algorithm, which has been widely adopted in literature. This unsupervised clustering method groups the numerical values into k clusters, where k represents the desired number of groups. The algorithm procedure involves dividing the numerical values into groups with minimal within-cluster variance and maximal between-group variance. This approach reduces the total intracluster distance by minimizing this measure by considering all formed clusters.
Despite the current simplicity and small size of the data being processed, the utilization of clustering and classification techniques remains essential for segmentation into five levels. It is crucial to consider both the size and nature of the data as well as the available computational resources. It should be noted that other simulations may generate more extensive and intricate data in their results.
In this study, we adopted a non-traditional clustering approach to explore various solutions and assess their performance through cross-validation or a separate test set.
Therefore, we used neural networks to classify the scores into different levels. With advancements in deep learning, neural networks have emerged as viable options for categorizing numerical values at specific levels. Despite being a more complex approach than traditional machine learning algorithms and classification methods, it can yield good results, particularly when there is a large amount of data or when the relationship between scores and classes is intricate.
In a simplified manner, the following steps were performed to cluster and classify the numerical values into five levels using neural networks.
1.
2.
3.
4.
After the prediction, numerical values were assigned to levels based on the pre-established categories. By submitting the collected data, as shown in Table 11, to the artificial intelligence model using RNN, we obtained the distribution of classes and intervals for the scores, as detailed in Table 12.
Notably, the scores were negative, indicating that the results were lower than those of the baseline configuration, which is represented by a value of zero in this study.
●
●
●
●
●
Building on this foundational analysis, we propose the introduction of up to four sublevels within each class, denoted by ‘+’. Each sublevel represents an additional 25% of the renewable energy usage at the respective level or score. This proposed enhancement of the classification system provides data center managers with a more nuanced spectrum of choices, facilitating more informed decisions regarding operational expenses and the integration of renewable energy sources.
The sublevels are established based on pre-established multicriteria heuristic solutions that guide decisions in energy-conscious consumption situations without compromising datacenter operations. The methods are detailed in Table 12 [28–31].
The incorporation of artificial intelligence methods for labeling coupled with the inclusion of energy sublevels results in a robust and adaptable system. This not only streamlines operational and strategic decision-making processes but also promotes energy efficiency and the adoption of renewable energy. Consequently, this model optimizes a datacenter’s energy resources while guiding organizations towards more sustainable and environmentally responsible practices.
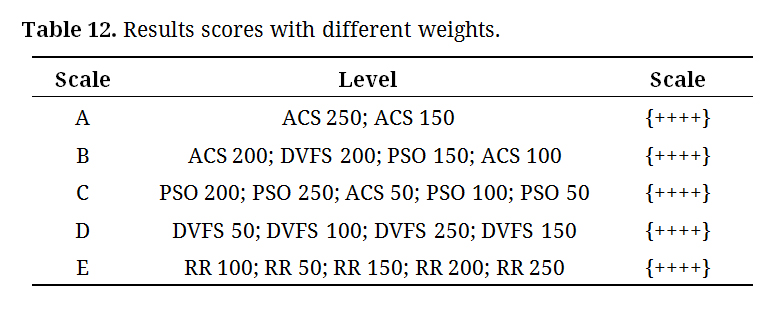 Table 12. Results scores with different weights.
The utilization of sublevels based on renewable energy consumption is crucial. Even a data center that acquires all of its energy from renewable sources may not be energetically efficient by definition. With the methodologies outlined in this study, it is possible to further reduce the energy consumption and redirect the saved energy to other critical sectors.
These strategies are crucial for improving the use of renewable energy and effectively reducing the environmental damage. They play a vital role not only from an economic perspective but also in meeting sustainability goals and fulfilling environmental responsibility requirements.
To ensure an accurate analysis of energy efficiency, it is crucial to develop a customized energy-level table for each unique datacenter, considering the individual workload and energy demand. This scale enables the assessment of the datacenter’s energy optimization level, providing a clear understanding of efficiency levels ranging from highest to lowest based on specific operational workloads.
One of the main goals of this model is to indicate the current energy efficiency of the datacenter and its potential evolution in terms of energy management to demonstrate the real benefits of these implementations. This involves assessing its status and selecting algorithms that can increase it to a higher level of energy efficiency. It is crucial to note that these score values are not absolute because they vary according to each datacenter’s configuration and equipment as they represent the relationship between various energy levels.
This means that, in practical terms, this model allows the setting of realistic goals for implementing energy efficiency, planning evolution, and reducing the environmental impact. It also allows direct and indirect cost reduction through the adoption of more efficient resource allocation algorithms, as well as the use of renewable energy.
A hypothetical datacenter is used to illustrate the scaling strategy, which consumes 155 W for a specific workload and is classified as Level C. The scale used in this example, represented in Table 12, is the result of this study and the energy consumption values are based on each level. It should be noted that 40 W of this consumption comes from renewable energy sources.
In this context, the Hypothetical Datacenter is classified as C+ because 40 W represents approximately 25.8% of the total consumption from renewable sources. The study highlights not only the importance of overall energy efficiency but also the proportion of renewable energy used, as shown in Table 13, derived from Tables 11 and 12.
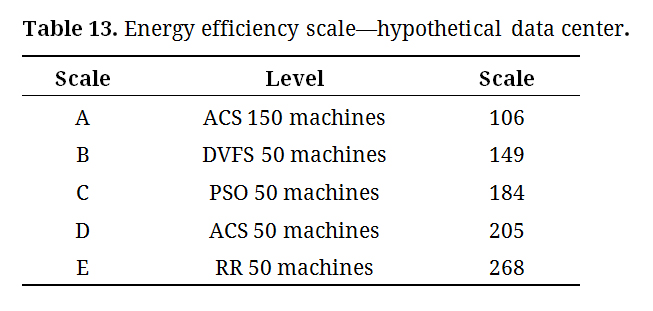 Table 13. Energy efficiency scale—hypothetical data center.
Although relying solely on renewable energy in a datacenter is not sufficient to ensure energy efficiency and reduce the environmental impact, it is essential to adopt intelligent strategies to optimize resources and promote rational energy usage. This necessitates the exploration of clean sources of energy as well as technological and organizational solutions that facilitate responsible and efficient resource management within the computational environment.
Based on this categorization, valuable insights can be derived regarding energy consumption and adoption of renewable sources, thereby contributing to the development of more sustainable and responsible practices in the IT sector. Companies can use this information to establish specific improvement goals, such as increasing the proportion of renewable energy used or reducing the total energy consumption.
Possible proposals can involve improving energy efficiency optimization, either by enhancing algorithms at a vertical or horizontal scale, or by replacing conventional energy sources with renewable ones.
In summary, the integration of renewable energy sources into datacenter infrastructure is depicted by the horizontal levels presented in this proposal. Each addition represents an extension at the same hierarchical level, allowing the flexibility to adapt to energy growth opportunities. However, implementation on a horizontal level requires financial and logistical investments, as well as careful management to maintain operational and energy efficiency, as power consumption fluctuates due to increased computational demand.
Horizontal variation can be the outcome of a significant increase or decrease in the processing and storage capacity. This is because the operational model relies on the ratio of energy consumption to the production from renewable sources. This approach enables data centers to achieve operational excellence while maintaining optimized and environmentally conscious energy management for sustainability assurance.
The utilization of vertical scaling results in the optimization of the performance of existing elements, thus promoting higher efficiency in the allocation of energy and other resources. As a logical model that aims to maximize the utilization of available resources, its implementation can occur quickly and with lower financial investment, which also contributes to reducing operational expenses.
The strategic integration of the horizontal and vertical dimensions provides an innovative approach for maximizing the efficiency and sustainability of data centers. By harmonizing these dimensions, it is possible to adapt solutions that effectively respond to variable demands, while balancing the need for expansion with resource optimization. This fosters more efficient and sustainable operation of data centers.
One advantage of this integration is the optimization of the advantages offered by each approach, resulting in a flexible and adaptable system that proactively adjusts to changes in the operational environment and market demands. The impact of these elements on energy efficiency and sustainability can be significant, providing new incentives for innovation and improvements in data center management.
Green cloud computing has become an increasingly discussed topic in both business and academic sectors. Companies are gradually shifting towards this model as a response to the growing storage of data and computational needs, leading to the expansion of cloud provider infrastructure. This expansion has had significant economic, social, and environmental consequences, such as energy consumption, water usage, and CO2 emissions. In light of this increasing demand, there is a need to develop data centers that are more energy efficient and that utilize renewable resources.
The objective of this study was to identify the main metrics used as well as the potential areas and categories for transformation towards Sustainable Cloud Computing. Furthermore, we aimed to assess the hypothesis that it is possible to achieve a reduction in energy consumption without compromising processing time.
The results obtained in this study are significant, and demonstrate the potential of effective methods for resource management in cloud computing. Using the CloudSim Plus simulator, various strategies and algorithms were developed and evaluated to reduce the energy consumption and optimize the quality of service indicators. These findings highlight the importance of implementing energy-efficient approaches for improving sustainability and enhancing performance in cloud environments.
By employing more efficient resource allocation algorithms or alternative approaches, substantial reductions in energy consumption of approximately 55% were achieved without compromising processing times. This decrease in energy usage not only helps mitigate the environmental impact, but can also lead to significant savings in operational and infrastructural costs.
Additionally, the study also found a considerable decrease in expenses related to virtual machine distribution, potentially reaching approximately 28%. This highlights that implementing more energy-efficient practices in cloud computing is not only beneficial for the environment, but also offers economic advantages.
By implementing this model using ACS algorithms, it was possible to observe a noticeable decrease in environmental impact, reaching a reduction of 55.95% in carbon dioxide emissions. This led to a total decrease of 513 tons of CO2 being released into the environment.
To simplify the selection of the best solution, a scoring calculation was proposed to evaluate the results of the algorithms. This allows for an objective comparison and facilitates decision making regarding the implementation of the most suitable strategy for green cloud computing.
In addition, a framework for classifying energy efficiency was included to assess datacenters in terms of their consumption and use of renewable sources. This allows for the monitoring of progress in energy efficiency over time, and enables the implementation of appropriate measures to improve it.
It is essential to emphasize that multiple approaches are crucial to achieve optimal results. For instance, combining the suggested architecture with the development of distributed software can yield favorable outcomes.
This virtual machine allocation method has a beneficial impact on the operational expenses of the infrastructure and reduces execution time, allowing researchers and data center managers to make better use of their technological resources in both public and private settings.
In future research, it will be possible to conduct more advanced studies using simulators and algorithms to determine the most suitable parameters for evaluating the computational and energy efficiencies of datacentres. Additionally, analyzing the benefits of different approaches implemented within this field can further contribute to a more efficient adoption of Green Cloud Computing.
Additionally, as part of future research, this model should be implemented in a real data center to provide a practical study and demonstrate its benefits more clearly and objectively.
The datasets produced and/or examined during the current investigation can be found in the Zenodo repository, which can be accessed at https://zenodo.org/records/10030598 (DOI: 10.5281/zenodo.10030598). Please contact the corresponding author for any additional material or further information related to this study.
Thiago Nelson Faria dos Reis, Mario Meireles Teixeira: Study design; Modeling; Experimental design; Data analysis; Discussion of results.
Carlos de Salles Soares Neto: Study design; Data analysis; discussion of results.
Alana Oliveira and Apoena Mendes: Statistical validation and analysis; discussion of results.
The authors declares that there is no conflict of interest.
The authors would like to thank the Coordination for the Improvement of Higher Education Personnel (CAPES) and the National Council for Scientific and Technological Development (CNPq) for supporting research at the Doctorate Program in Computer Science (DCCMAPI) at the Federal University of Maranhao (UFMA).
1.
2.
3.
4.
5.
6.
7.
8.
9.
10.
11.
12.
13.
14.
15.
16.
17.
18.
19.
20.
21.
22.
23.
24.
25.
26.
27.
28.
29.
30.
31.
32.
33.
34.
dos Reis TNF, Teixeira MM, Neto CSS, Oliveira A, Sousa AM. A Tier Labeling Proposal for Energy Efficiency in Green Cloud. J Sustain Res. 2024;6(1):e240004. https://doi.org/10.20900/jsr20240004

Copyright © 2023 Hapres Co., Ltd. Privacy Policy | Terms and Conditions


