Location: Home >> Detail
J Sustain Res. 2024;6(2):e2400014. https://doi.org/10.20900/jsr20240014

LX Spatial Information Research Institute, Korea Land and Geospatial Informatix, Wanju_gun 55365, Korea
This study explores the temporal impact of Light Rail Transit (LRT) expansion on property value premiums. Using two MAX alignments in Portland, Oregon, a spatial lag model and propensity score matching were employed to analyze the medium and long-term effects. Key findings show that the introduction of the first LRT line increased property values near LRT stations. However, unlike prior studies, additional LRT lines generally did not add premiums, except in the east-side case with a 15-year gap between the first and second lines. That is, improved transit accessibility from additional LRT lines did not consistently translate into property value increases unless there was a significant time gap between their operations. Implications for urban planning include confirming the bid rent theory, recognizing the nuanced impact of additional LRT lines, and emphasizing the need for ongoing monitoring and adaptation of policies to ensure enduring benefits for communities. This study contributes to enhancing the understanding of the market response to the introduction of the LRT infrastructure and the expansion of existing lines, and offering pertinent planning policies.
The confluence of transportation development and real estate markets holds a pivotal role in shaping the contemporary urban planning and practices. Perspectives from urban economics offers a relevant framework for interpreting the market-driven changes influenced by transportation development. Housing prices, as immediate indicators of market response, reflect the perceived value of proximity to enhanced transit accessibility. The immediate market reactions to changes in transportation infrastructure, notably the introduction of Light Rail Transit (LRT), are critical considerations for urban planners and policymakers. In this regard, existing literature consistently underscores the positive influence of LRT on housing prices [1] with variations observed across different planning phases of LRT projects [2]. However, the prevailing focus in previous studies has primarily been on the immediate market reaction to the introduction of LRT, with a limited exploration of the broader property value dynamics and market responses to transit accessibility improvements.
Therefore, this study seeks to bridge this gap, specifically delving into how additional LRT openings along existing alignments, called “LRT expansion”, trigger immediate changes in property values. To provide a comprehensive understanding of the dynamics of capitalization effects associated with transit accessibility improvements, this research concentrates on two specific segments of the MAX alignments in Portland, Oregon, utilizing a spatial lag model in conjunction with treated and control groups identified through propensity score matching.
This study has direct implications for market-oriented urban planning. By elucidating how the immediate market reactions evolve over time, the study serves as a practical guide for planners and policymakers seeking to navigate the intricate landscape of transit-oriented urban development. Furthermore, the concept of location affordability adds a vital layer to the discussion. As urban areas evolve, it becomes imperative to consider not only the market-driven changes in property values but also their impact on the affordability of residing in specific locations. This study, by delving into the immediate and long-term effects of LRT expansion on property values, contributes to our understanding of how these dynamics intersect with the broader notion of location affordability. Thus, this study provides valuable insights for shaping sustainable, market-responsive, and location-affordable urban environments.
The interconnection between land use and transportation has been widely acknowledged in both academic and public domains [3]. The growth of public transit, as well as investments in it, has played a pivotal role in shaping densely populated and mixed patterns of development [4,5]. One crucial aspect of this relationship is the capitalized effect of transportation improvements on property values, stemming from enhanced accessibility to urban amenities, social infrastructures, and employment opportunities [6]. Research in this domain has evolved through three distinct waves: (1) exploring the association between property value and transit proximity; (2) establishing causal relationships between the two factors; and (3) investigating nuanced topics such as temporal effects, meta-analysis, and transit-induced gentrification [7,8].
First, a significant amount of the research has demonstrated that there is a correlation between accessibility to transit stations and price premiums for surrounding properties [9]. For example, Grass [10] created hedonic models in order to investigate whether or not the construction of the METRO in Washington, DC had a positive impact on property values. The findings suggested that there was a premium of $17,352 placed on properties that were less than a quarter mile away from the station as compared to the other properties that were in the control group.
Moving beyond correlation, there is a question regarding the causality of the interaction between land use and transportation. For instance, Kim and Lahr [11] employed a hedonic regression model with repeat-sales data between 1991 and 2009 in order to investigate the effect of the Hudson-Bergen Light Rail on residential property values. Their research was published in 2014. According to the findings of the study, residential property values are higher in the areas surrounding urban commuting stations on the Hudson-Bergen Light Rail line. This is likely because of improved accessibility to transportation and reduced costs associated with transportation in these areas. The appreciation premium appears to be centered within a quarter-mile of the stations, which is a somewhat shorter distance than what was described in earlier literature.
Furthermore, a relatively recent body of research has dealt with detailed topics, such as the net property value premium [12,13], transit-induced gentrification [14], meta-analysis [15], and, more importantly, temporal dynamics [16]. Relevant to this stud, beyond the static effect with a single equilibrium, some scholars have examined the temporal dynamics of a price premium at different transit development phases, and found property value premium can vary at each stage of a new transit project [16–21].
For instance, a study conducted in Chicago found that the land market began to adjust over three years before the operation of the transit facilities [17]. Golub et al. [2] scrutinized the capitalization effects of the LRT system in Phoenix, Arizona, across five stages and found positive and significant responses in housing and commercial property prices in each phase, with effects intensifying over time. However, limited studies have extended their focus beyond transit service initiation.
However, few studies have gone beyond exploring the premium of transit after the transit service operation. For instance, Yan et al. [16] found that before the operation of LRT in Charlotte, North Carolina, the proximity to the station had a significant and positive impact on home prices, while the effects became insignificant during the operation phase. Pilgram and West [22] concluded that the capitalized effect of rail proximity on property values was transmitted through adjacent neighborhoods immediately after the service operation but faded to a statistically zero as time passed. Ke and Gkritza [23] found that while the property value increased after the announcement of the LRT project, the premium reduced or disappeared in size after the LRT began operation.
Despite the extensive body of research, there remain notable gaps. Existing studies predominantly concentrate on the immediate market response to transit development and lack a nuanced exploration of the temporal evolution of property value premiums. This study aims to address this gap by focusing specifically on the temporal dynamics of property value premiums associated with LRT expansion in Portland, Oregon. By examining the mid- and long-term effects, this research aims to contribute to a deeper understanding of how property values respond to transit accessibility improvements over time, providing insights valuable for both academic discourse and urban planning practices.
This study is situated within the framework of capitalization theory, a central concept in housing economics that underlines the intrinsic connection between property values and the perceived future benefits associated with property ownership. According to this theory, property values serve as indicators of the present value of expected future advantages, encapsulating the array of amenities and services available in the property’s vicinity. Within the realm of this particular study, we explore how the establishment and subsequent expansion of LRT act as key influencers on property values.
The temporal dynamics outlined in Figure 1 propose that the introduction of a new LRT project triggers an expected increase in property values in close proximity to the transit project’s path, aligning with the findings of Agostini and Palmucci [24]. Specifically, it is hypothesized that the property value premium will experience a gradual escalation, reaching its peak at the commencement of the first LRT line, a phenomenon supported by Golub et al. [2]. This conceptual framework is iterative and anticipates similar cycles for subsequent lines as the LRT system expands.
Fogarty et al. [25] posit that the model assumes a consistent premium on property value as long as the transit system remains stable. This assertion underscores the expectation that the perceived benefits and amenities associated with transit accessibility continue to contribute positively to property values, maintaining a stable premium over time.
Beyond the immediate market reactions documented in previous research, this study extends the exploration to the temporal dimension, examining how the property value premium associated with LRT expansion evolves over the mid- and long-term. In this regard, Figure 1 serves as a guiding framework for this study, aligning theoretical underpinnings with practical insights into the dynamic interplay between LRT expansion and property values.
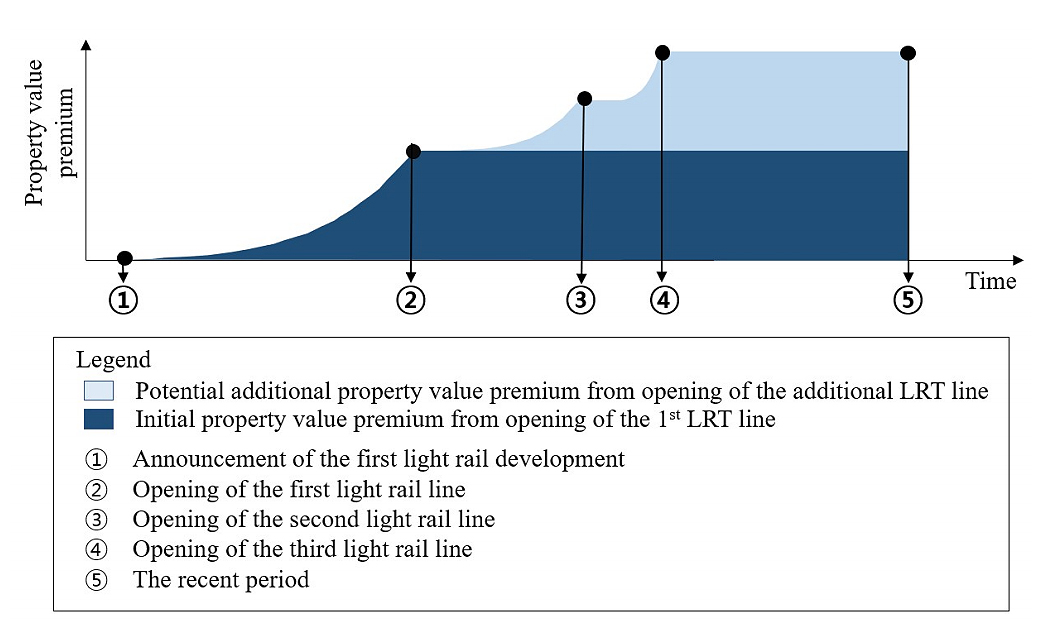 Figure 1. Theoretical framework of the dynamics of value uplift (developed based on [25]).
To answer the research questions, this study chose two case in the Portland Metropolitan Area in Oregon, a widely used study area in previous studies [26–28]. The Metropolitan Area Express (MAX) provides LRT service for the region [29]. MAX began the first LRT service in 1986 with the east-side Blue MAX line, which was extended to the west-side of the metropolitan area in 1998. Since then, the MAX system has been expanded with four other LRT lines.
This study focused mainly on single-family homes in suburban station areas served by more than one MAX line. This study excluded the downtown area for two reasons. First, since LRT stations are dense in the downtown area, there is much overlap between their service areas (e.g., a half-mile from a station), making it difficult to single out the effect of one single LRT station. Second, in addition to LRT, the downtown area is served by several other transit services, such as buses, streetcars, and intercity rail (Amtrak), which further complicates the estimation of the impact induced only from a single LRT station. To exclude the LRT stations within the downtown area, this study used an administrative boundary of the Central City of Portland obtained from the Portland Metro’s Regional Land Information System (RLIS) [29].
Figure 2 shows the two segments of interest this study selected for this research: (1) the east-side case with four MAX stations (Hollywood TC, NE 60th, NE 82nd, and Gateway TC); and (2) the west-side case with three MAX stations (Beaverton TC, Sunset TC, and Washington Park). The east-side case is served by three MAX lines: Blue (opened in 1986), Red (opened in 2001), and Green (opened in 2009) lines, while the west-side case is served by two MAX lines: Blue (opened in 1998) and Red (opened in 2003) lines.
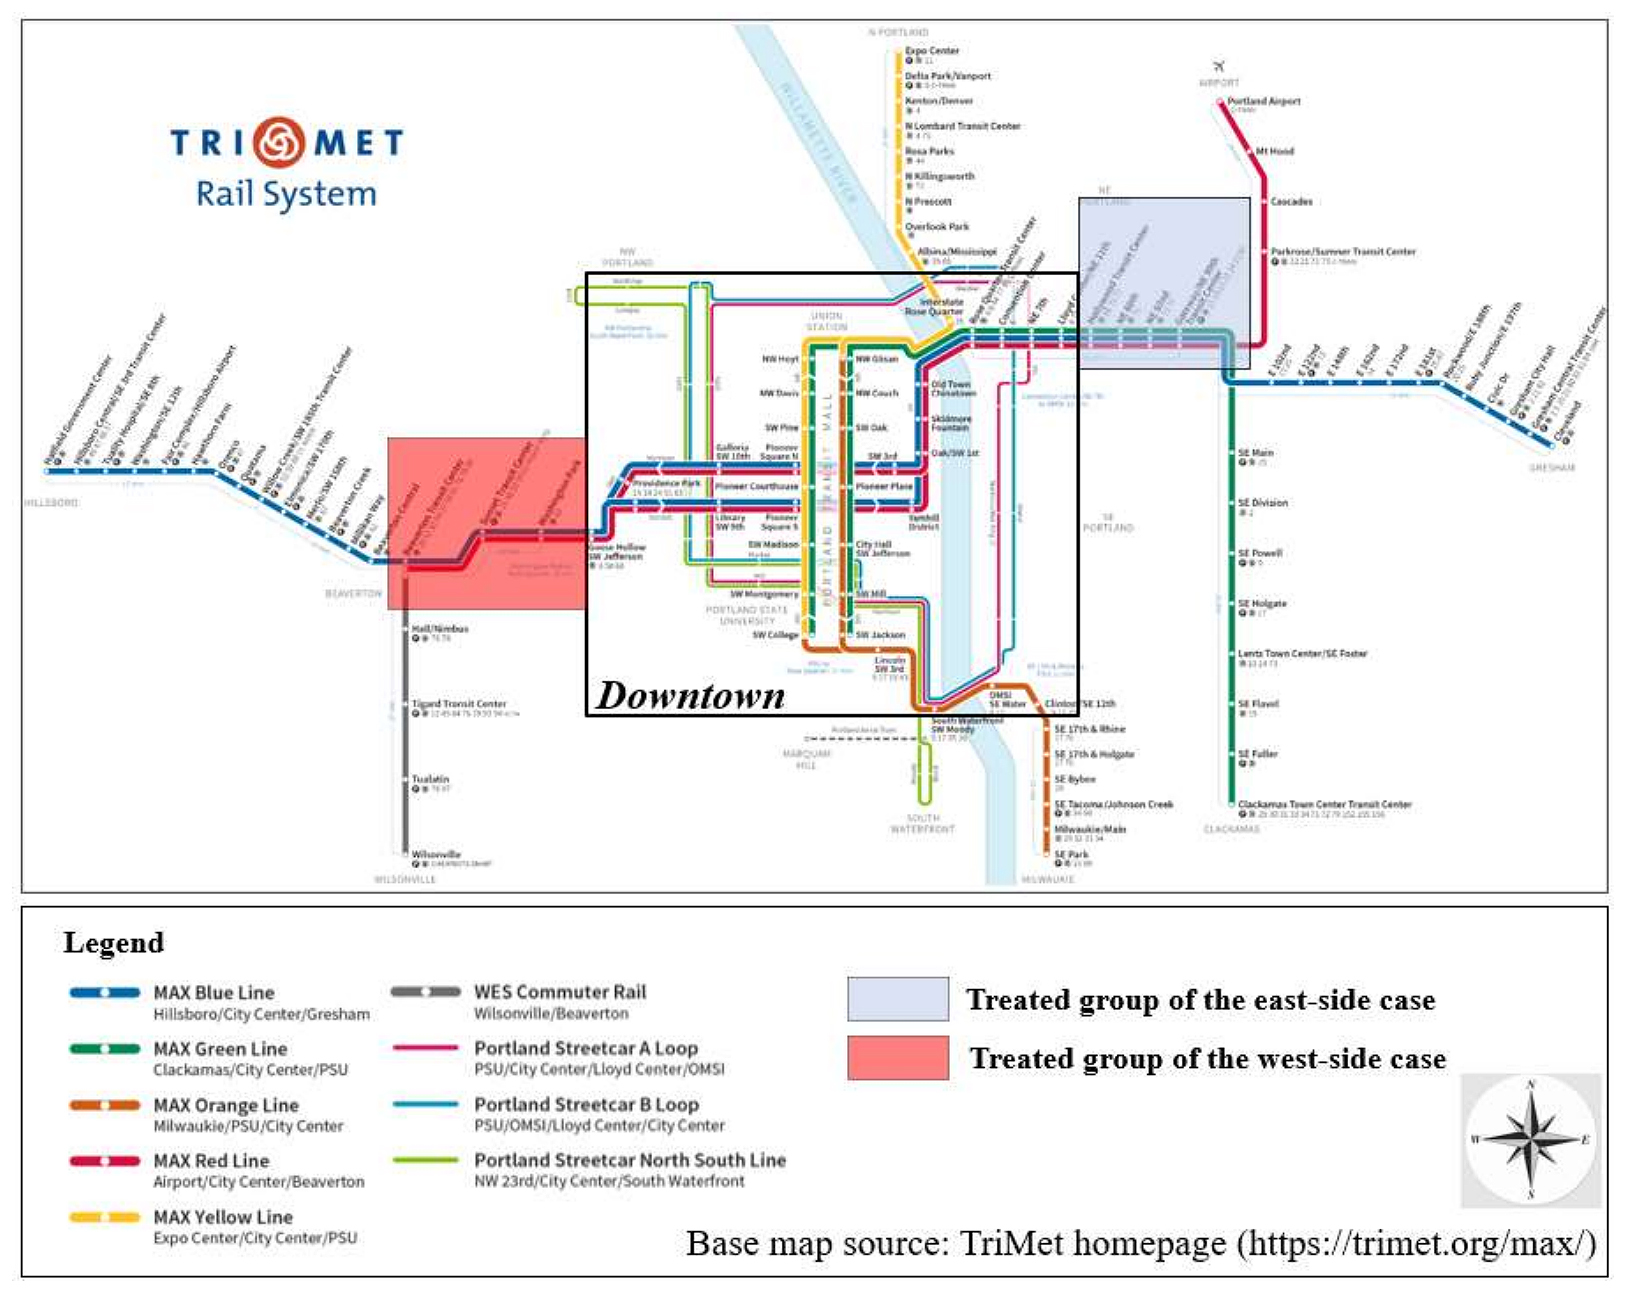 Figure 2. Conceptual map of the study area.
The three-step approach involved (1) identifying distinct time periods of LRT system development, (2) utilizing propensity score matching to identify comparable treatment and control units, and (3) employing spatial lag Hedonic regression models to estimate the capitalized effects of LRT on single-family home values during different time periods. The subsequent subsections provide a detailed explanation of the methodology used in this analysis.
Discrete time periodsAs shown in Table 1, this study first identified several discrete time periods using cross-sectional data [30,31]. This study chose six time periods for each case. The periods for each case were different because the MAX lines serving the east-side and west-side cases were developed and expanded in different years. This study considered the two years before and after an opening or expansion to expand the number of observations. In the east-side case, this study created six periods: 1999 and 2000 (before the 2nd MAX line opening), 2002 and 2003 (after the 2nd MAX line opening), 2007 and 2008 (before the 3rd MAX line opening), 2010 and 2011 (after the 3rd MAX line opening), 2014 and 2015 (the mid-term), and 2018 and 2019 (the long-term). This study could not estimate models for periods before and after the first MAX line for the east-side case because the home sales transaction data before the late 1990s were not available. The west-side case included six periods: 1996 and 1997 (before the 1st MAX line opening), 1999 and 2000 (after the 1st MAX line opening), 2001 and 2002 (before the 2nd MAX line opening), 2004 and 2005 (after the 2nd MAX line opening), 2010 and 2011 (the mid-term), and 2018 and 2019 (the long-term).
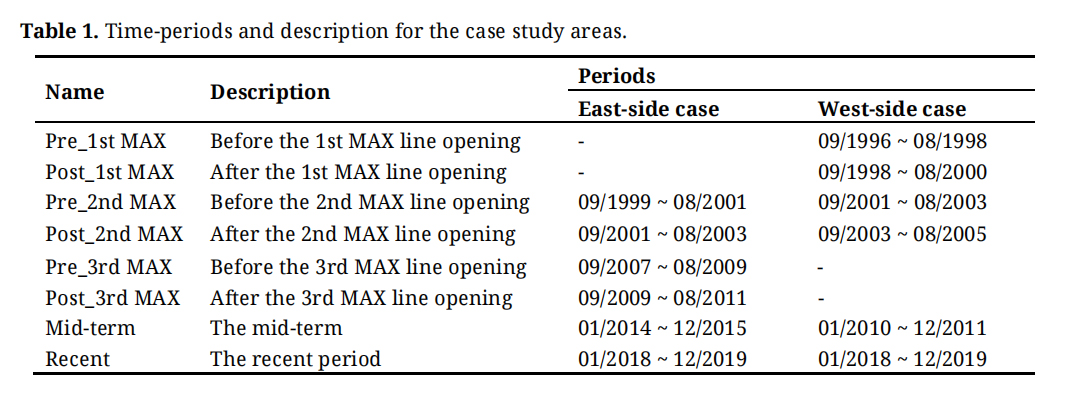 Table 1. Time-periods and description for the case study areas.
This study used Propensity Score Matching (PSM) to construct control groups matched to corresponding treated groups with similar observed characteristics [32]. Ideally, a randomized experiment works best in drawing causal inference, as estimating the effect from observational data is often biased [33]. In this context, Rosenbaum and Rubin [34] developed the unconfounded assignment, PSM, to account for and adjust differences in pre-treatment covariates and outcomes between the treated and control groups. PSM approximates a randomized experiment by resembling a true experiment with random assignment [28].
Houses within a one-mile network buffer from the seven east-side and west-side stations made up pools of treatment groups. In contrast, the control groups were identified through PSM that selected houses similar to each sample in the treatment group. In further detail, this study identified matched sets of treated and control groups by using the nearest neighborhood method. Additionally, this study used a caliper distance to exclude treated subjects from resultant matched samples that were not below a pre-specified threshold [32]. When using calipers with a width equal to 0.2, approximately 99% of the bias due to the measured confounders could be eliminated [32]. When this study used a caliper of 0.2, the standardized differences (SD) of some covariates were above 0.25, which means that it did not meet the recommendation made by Rubin [35]. Thus, this study further restricted the difference in the propensity scores of matched samples by using a conservative caliper distance of 0.1 to find perfectly matched sets. For the balance diagnostics of the matching results, this study relied on the standardized difference (SD), which is not sensitive to sample size [36], to evaluate the balance between the two groups on observed covariates. This study also used paired t-tests for continuous variables [37] and McNemar’s Chi-square tests for categorical variables [38].
The covariates this study used to estimate the propensity scores included structural characteristics, location factors, neighborhood characteristics, and a time dummy variable (see Table 2). This study included only three basic housing characteristics (e.g., lot size) for structural characteristics covariates due to the data limitation. This study used location factors for the spatial heterogeneity of housing values, such as the distance to downtown [39]. This study also utilized neighborhood characteristics, namely, population density, median household income, street density, and land mix index. To control the time fixed effects, this study incorporated a variable to represent the transaction year in each model. Sources for these data include the Portland Metro’s Regional Land Information System (RLIS) and the American Community Survey (ACS) 5-year estimates.
The results of PSM show that the standardized difference (SD) results indicate the almost perfect matching because none of them was above 0.25. However, the balance diagnostics, including paired t-test, and McNemar’s Chi-square tests, for each period suggest the need to control for different sets of covariates in models to rule out confounding effects of these covariates. Table 3 shows descriptive statistics of variables used in this study.
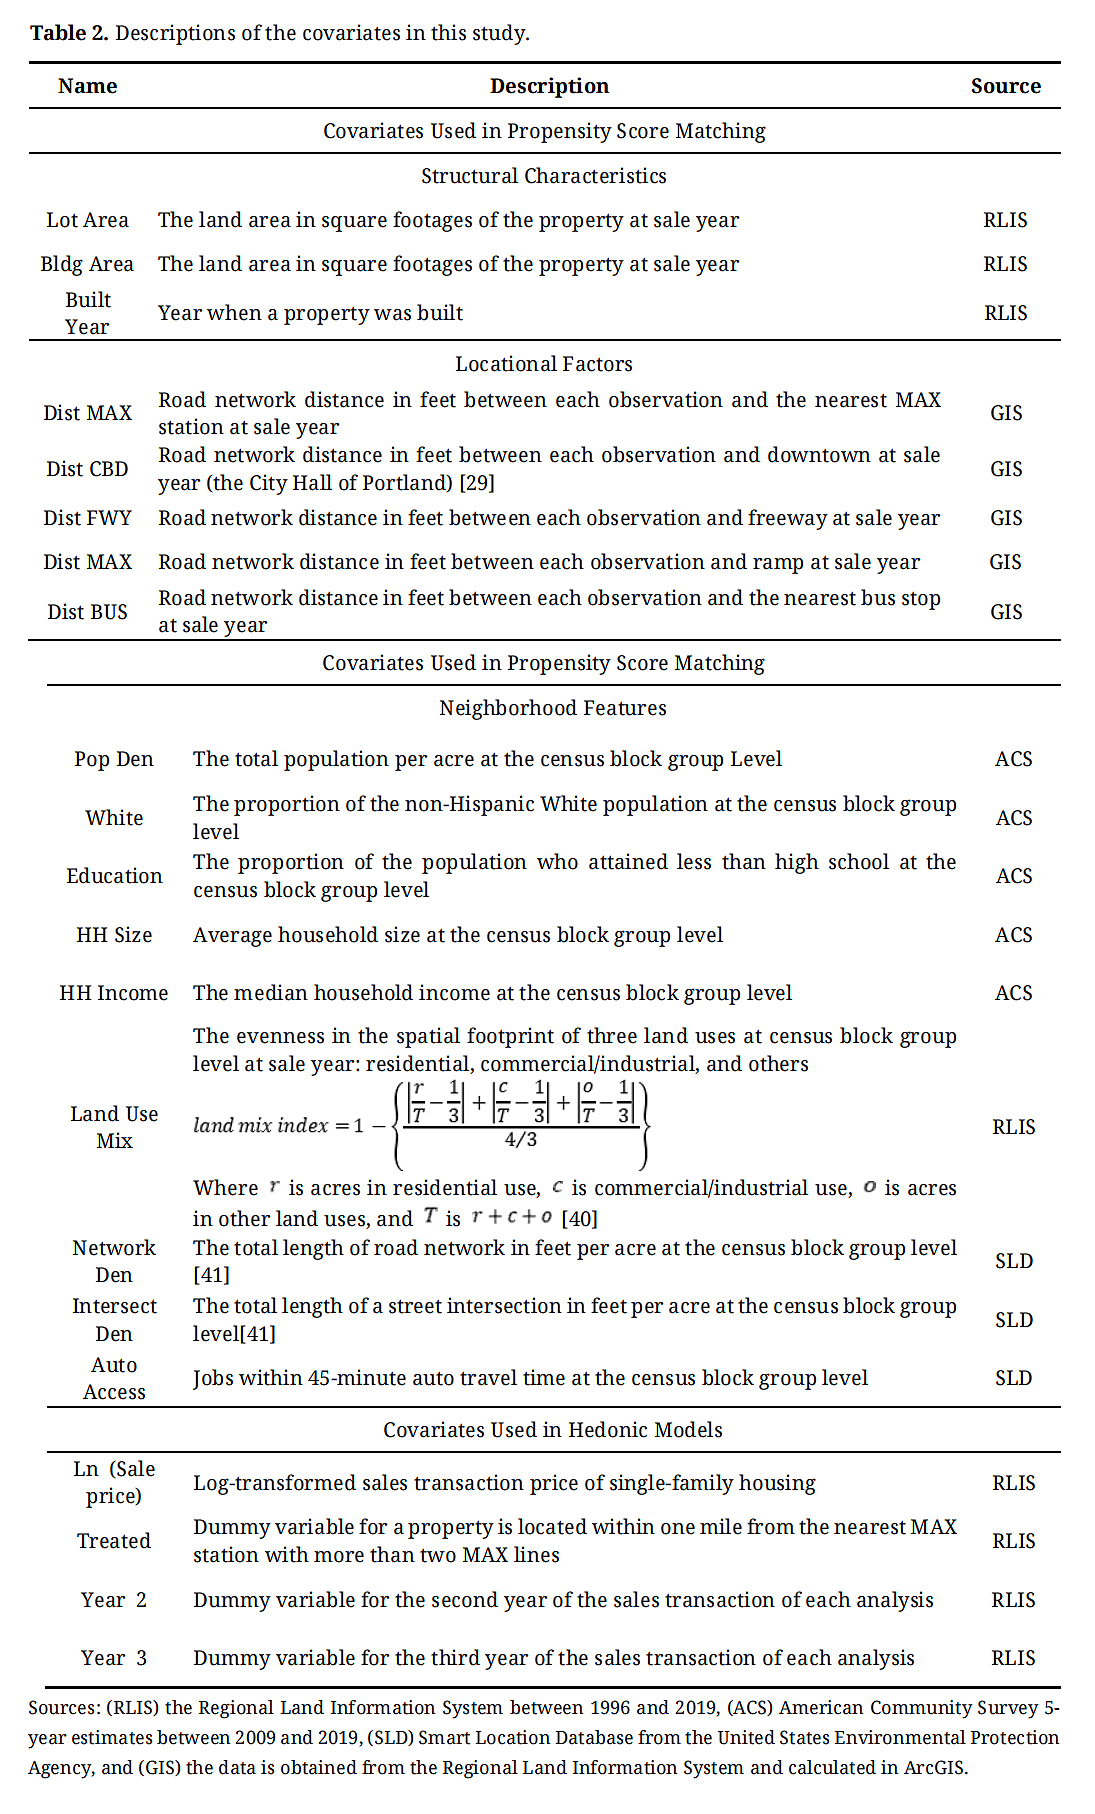 Table 2. Descriptions of the covariates in this study.
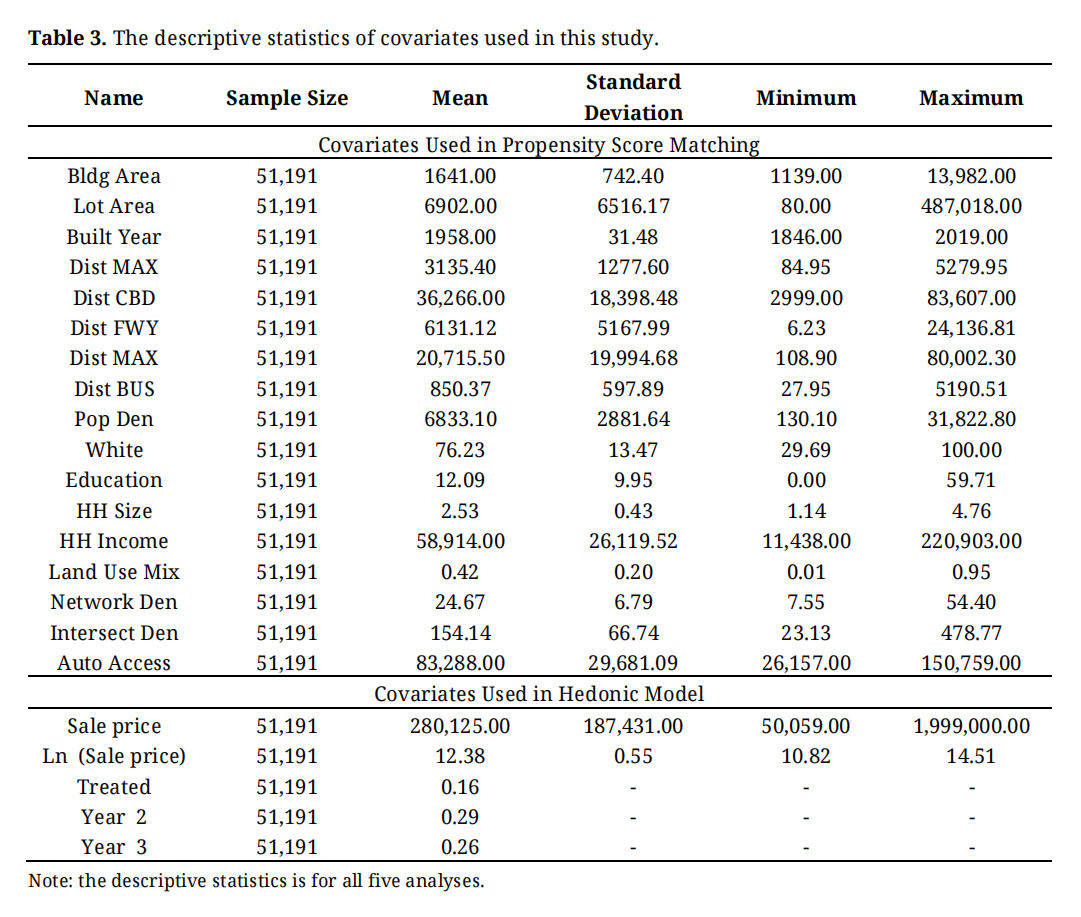 Table 3. The descriptive statistics of covariates used in this study.
To estimate the treatment effect, which refers to the temporal capitalized effect of LRT on single-family homes in this research, this study used paired t-test, a-spatial Hedonic regression, and spatial lag model. This study first used paired t-tests to examine a statistically significant mean difference in single-family home values between matched treated and control groups. This study then used the a-spatial Hedonic regression model, coined by Court [42]. More importantly, this study used the spatial lag model with a general contiguity matrix based on Euclidean distance after finding spatial dependency on residuals from all twelve a-spatial Hedonic models. This study used Moran’s I [43] and Lagrange multiplier tests on spatial dependency in residuals from the a-spatial models. Although the inability to control for the spatial effects in the a-spatial Hedonic model can lead to biased and inconsistent results [23,44,45], the spatial lag model allows us to control for spatial autocorrelation and generates unbiased estimates of the treatment effects. This study developed 12 models for each discrete time period: six each for the east-side and west-side cases.
The dependent variable of the models was the log-transformed sales price of single-family housing, which is a typical specification in the Hedonic model [46]. This study controlled only for covariates that were not perfectly matched between the treated and control group, as King and Nielsen [47] contended that propensity score matching is often concerned with a large portion of covariates with a remaining imbalance. Thjs study used standardized difference (SD), paired t-tests, and McNemar’s chi-square tests to find the covariates that need to be controlled for in each model. This study here used a SD of 0.10 as a criterion for choosing the covariates for inclusion in the regression specification to remove residual confounding [48,49]. This study also controlled covariates that showed a significant difference between the matched two groups at the marginally significant level (10%) according to paired t-tests and McNemar’s chi-square tests.
DataThe focus in this paper was single-family housing because there were too few other properties, such as commercial properties and multi-family housing, to analyze the suburbs of the Portland Metropolitan area. The primary data source of the study is the Regional Land Information System (RLIS) derived from County Assessor’s data. This study excluded records with missing sale price information or with sale prices equal to zero. Similar to the process used by Dong [50], this study removed sales transactions with prices lower than $50,000 or higher than $2 million that were highly unlikely to occur in the Portland Metropolitan area. After data-cleaning and the PSM process, the final matched sample size in the east-side case is between 199 and 442 pairs, and that in the west-side case is between 74 and 340 pairs.
This study estimated the capitalization effects of LRT on single-family housing prices in the Portland Metropolitan area, Oregon, which is called the treatment effect in this study. The final models in Table 4 employed paired t-test, a-spatial model, and, more importantly, the spatial lag model due to the inability to control covariates in paired t-test and spatial dependency in residuals in a-spatial models. The final twelve spatial lag models show that the Rho (the spatial lag parameter) was positive and significant, which meant a strong and positive spatial autocorrelation exists among adjacent observations. The AIC (Akaike Information Criteria) suggests that all twelve models were superior to a-spatial Hedonic models. Moreover, the likelihood ratio test results indicate that the model fit for spatial lag models significantly improved by adding the spatial lag to the a-spatial models. Since the model coefficients were not intuitive in spatial lag models, this study mainly presented the total impacts, which incorporated direct and indirect impacts, and interpreted them in this section. Lastly, this study presented the summary of the results on the treatment effects of paired t-tests, a-spatial Hedonic models, and spatial lag Hedonic model in the east-side case (see Table 5).
Treatment Effects in East-Side CaseTable 4 shows that the second MAX line positively impacted single-family housing values before and after the service opening in the east-side case. The total impact of the second line (treatment) opening in model 1 (before the second MAX line development) was 0.104, which suggested that the sales price increased by 10.4 percent for single-family houses in the station areas. Interestingly, the magnitude of the treated coefficient in model 1 was bigger than that in model 2. In other words, the capitalization effects were more noticeable immediately before the service opening. Even more interestingly, the third MAX line did not exert statistically significant capitalization effects on single-family housing. Furthermore, this study found that the additional property value premium caused by the second MAX line opening dissipated over time, as none of the treated coefficients was significant. Table 4 reveals consistent magnitudes and directions of the treatment effects across the time-periods in the three methods.
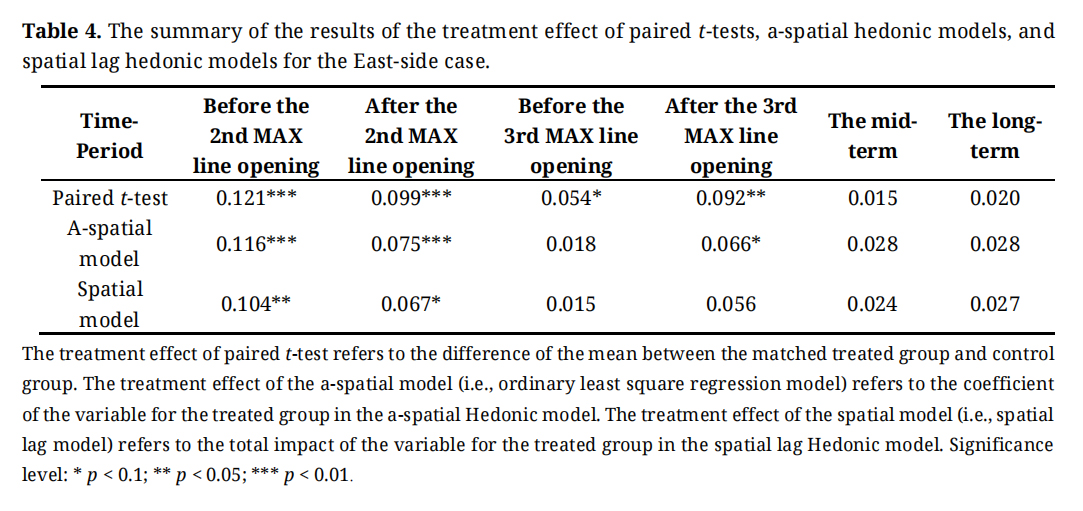 Table 4. The summary of the results of the treatment effect of paired t-tests, a-spatial hedonic models, and spatial lag hedonic models for the East-side case.
Table 5 indicates that, as expected, the treatment effects were statistically significant and positive in models 7 and 8. The results suggest that single-family homes sold at a premium before the first MAX line development. The treatment effect after the first MAX line development was significant at a 10% significance level. Specifically, all else equal, the sales price for single-family homes in the treatment group increased by 11.6 percent before the first MAX line opening and 7.7 percent after the first MAX line opening. More importantly, the results in Table 5 show that the point estimates of treatment effects on sales price appeared to be positive but insignificant before and after the second MAX line opening, which was different from the east-side case. Different development periods for the lines may explain these results. The first MAX line in the east-side case was developed in 1986, and the second MAX line was added 15 years after the first one. In contrast, the gap between the first and second MAX lines in the west-side case was only five years. Like the east-side case, the results of models 11 and 12 revealed that the single-family housing in the service areas of MAX stations with two lines did not enjoy an extra premium compared to those with one MAX line. It suggested that the initial property value premium of the first MAX line opening did not hold in the medium- and long-term. Table 5 shows that the magnitudes and directions of the treatment effects in the three methods were consistent like the east-side case did.
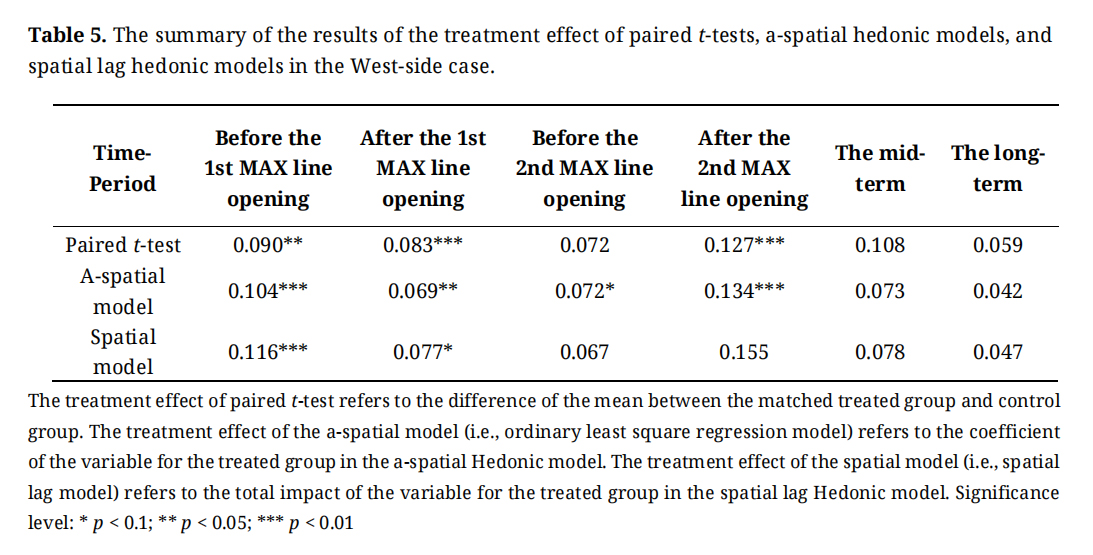 Table 5. The summary of the results of the treatment effect of paired t-tests, a-spatial hedonic models, and spatial lag hedonic models in the West-side case.
This study aligns with the bid rent theory, affirming that the introduction of the first LRT line consistently boosts property values near LRT stations. However, a notable departure from prior studies emerges: the introduction of additional LRT lines generally did not add a premium, except in the east-side case where the second line, initiated 15 years after the first, yielded an exception. Improved transit accessibility from additional LRT lines did not consistently translate into property value increases unless there was a significant time gap between their operations. Notably, estimated elasticities of property values before and after the second line in the east-side case mirrored those of the first line.
Moreover, our study reinforces earlier findings, indicating that property value premiums are more pronounced before the initiation of LRT service compared to afterward. The observed dissipation of property value premiums over time, as indicated by insignificant treatment effects in models 3–6 and 9–12, underscores a temporal aspect often overlooked in previous research. These nuanced findings prompt a reevaluation of assumptions about the immediate and lasting impacts of transit accessibility improvements, with temporal considerations emerging as crucial in understanding the complexities of the relationship between additional transit lines and property value dynamics.
Policy ImplicationsThe findings of this study carry several implications with significant relevance to urban planning and development practices. First, the consistency of our findings with the bid rent theory reinforces the well-established principle that proximity to transit stations imparts property value premiums in the immediate vicinity. This underscores the pivotal role of transit accessibility in shaping property values, emphasizing its crucial implications for urban development, land use planning, and property valuation practices.
Second, the observation that additional LRT line openings do not uniformly add property value premiums challenges assumptions about the automatic correlation between transit access and increased property values. Urban planners and policymakers must recognize that the impact on property values may be more nuanced and time-dependent. Transit expansion projects should consider the diverse factors influencing property value dynamics, going beyond the mere presence of transit access.
Third, the result that property value premiums dissipate over time signals that the initial boost in property values due to LRT expansion may not be sustained indefinitely. This emphasizes the need for ongoing monitoring and adaptation of policies and development strategies. Urban planners should proactively engage in continuous assessments to ensure the enduring benefits of transit expansion for the community.
In sum, these implications highlight the need for a holistic, adaptive, and equity-focused approach in urban planning and transit-oriented development, recognizing the multifaceted factors that shape property values over time.
This research explores the impact of LRT expansion on single-family home values and its temporal dynamics. Through a three-step methodology, discrete periods based on LRT openings were identified, and treatment effects were estimated using the spatial lag model. This study reveals a nuanced and varied relationship between transportation system development and property values. Crucially, the effects of transit expansion on property prices depend on factors such as timing, location, and the temporal dimension. Urban planners and policymakers must recognize these complexities when planning transit and urban development initiatives to optimize benefits and ensure long-term sustainability. These findings contribute to housing economics and transportation policy, enhancing our understanding for the development of more effective urban strategies. In essence, this research emphasizes the importance of informed and context-specific planning to maximize positive impacts on property values and overall urban development.
The research provided a more comprehensive picture of how the market responds to new and additional LRT developments and offered relevant policy implications. However, this research has several limitations and identifies future research opportunities. First, this study merely compared coefficients throughout the twelve models to identify the capitalized effect of LRT over time. Since it may not draw a causal relationship [51], future studies need to employ sophisticated methodological approaches. Second, due to the expected differences between the capitalization effects on properties with different land-use types [52], The results might not apply to the valuation of commercial or multi-family housing. Third, the estimation of the long-term price impact of public transit accessibility presents challenges due to its endogeneity, which is influenced not only by the proximity of facilities but also by the overall built environment of the city. To clarify, it is important to acknowledge that the urban structure may have undergone substantial transformations subsequent to the implementation of the initial and subsequent LRT lines. Consequently, it would be inappropriate to directly compare the initial price effect with those observed in much later periods. Fourth, it is important to note that the outcomes could vary if the examination encompassed diverse transportation options, such as buses, subways, and high-speed rail. Fifth, further studies need to explore the temporal dynamics of the premium of the transit system in other regions because results may differ in other regions. Due to the generalizability issue, the results of this study may not be applicable to others, such as South Korea.
The dataset of the study is available from the authors upon reasonable request.
The author declares that there is no conflicts of interest.
1.
2.
3.
4.
5.
6.
7.
8.
9.
10.
11.
12.
13.
14.
15.
16.
17.
18.
19.
20.
21.
22.
23.
24.
25.
26.
27.
28.
29.
30.
31.
32.
33.
34.
35.
36.
37.
38.
39.
40.
41.
42.
43.
44.
45.
46.
47.
48.
49.
50.
51.
52.
Lee S. Property Value Premium of Transit Accessibility and Light Rail Transit Expansion in Portland, Oregon. J Sustain Res. 2024;6(2):e2400014. https://doi.org/10.20900/jsr20240014

Copyright © 2023 Hapres Co., Ltd. Privacy Policy | Terms and Conditions


