Location: Home >> Detail
J Sustain Res. 2025;7(4):e250072. https://doi.org/10.20900/jsr20250072
 ,
Johnatan Castro-Gómez 2 ,
Santiago Gutiérrez-Broncano 3 ,
Víctor Alfonso Sánchez Montoya 4
,
Johnatan Castro-Gómez 2 ,
Santiago Gutiérrez-Broncano 3 ,
Víctor Alfonso Sánchez Montoya 4
1 Faculty of Legal and Social Science, University of Castilla-La Mancha, Toledo 45071, Spain
2 Faculty of Business Sciences and Economics, Tecnológico de Antioquia Institución Universitaria, Medellin 050041, Colombia
3 Faculty of Social Sciences and Information Technologie, University of Castilla-La Mancha, Talavera de la Reina 45600, Spain
4 Faculty of Communication Science, University of Antioquia, Medellín 500001, Colombia
* Correspondence: Camilo Giraldo-Giraldo
This study analyses the impact of Sustainable Human Resource Management (SHRM) and Sustainable Leadership (SL) on competitive performance (CP) in Colombian coffee family firms (FF), considering Sustainable Practices (SP) as mediators and Knowledge Management (KM) as a moderator. Using a quantitative design and Partial Least Squares Structural Equation Modelling (PLS-SEM) on 232 valid responses, results confirm that SHRM and SL indirectly enhance CP through SP, while KM strengthens this mediation. The findings highlight that economic and environmental practices exert stronger effects than social ones. These results provide empirical evidence from Latin American rural contexts and propose a systemic framework linking SHRM, SL, SP, and KM as drivers of CP in family firm.
Sustainable Human Resource Management-(SHRM); Sustainable Leadership-(SL); Competitive Performance-(CP); Sustainable Practices-(SP); Family Firms (FF); Knowledge Management-(KM)
Organisational sustainability has consolidated as a strategic priority for FF, particularly in agricultural sectors where the interplay between economic, social, and environmental dimensions is decisive [1]. These organisations face increasing pressures arising from climate change, market volatility, and societal demands for corporate responsibility. In this context, SHRM has emerged as a field that connects talent management policies with the Sustainable Development Goals, positioning people at the centre of building organisational resilience and sustainable competitive advantage [2,3].
The literature has underscored that SHRM differs from traditional management by recognising that employees are not merely operational resources but strategic actors capable of enabling the transition towards sustainable business models [4]. Within this framework, practices related to equity, continuous training, and workplace wellbeing become mechanisms that not only foster commitment but also contribute to long-term Competitive Performance CP [5].
At the time, SL has gained prominence as a key element for driving cultural transformations towards sustainability [6,7]. Unlike transformational or ethical leadership, SL is characterised by incorporating an intergenerational vision, balancing economic outcomes with social wellbeing, and demonstrating an explicit commitment to the natural environment [8]. Recent studies show that SL contributes to creating organisational cultures that align individual and collective objectives under a triple-impact approach [9,10].
CP has been conceptualised as the capacity of organisations to mobilise internal and external resources in order to generate sustainable advantages in dynamic markets [11]. However, the literature acknowledges that the mechanisms through which SHRM and SL influence CP remain underexplored and require more integrative models [12]. Specifically, the inclusion of SP as mediating variables and KM as a moderator remains insufficiently developed, despite both constructs being essential to linking sustainability with innovation and competitiveness [13,14].
From a contextual perspective, FF in rural environments face particular challenges: limited technological adoption, reliance on traditional practices, and exposure to highly volatile markets [15]. The Colombian coffee sector represents a paradigmatic case, given its strong cultural roots, territorial economic significance, and increasing pressure to adopt sustainability models in response to climatic and commercial challenges [16]. Nevertheless, despite their importance, these organisations have received limited attention in international sustainability studies, which predominantly analyse large corporations in urban or industrial contexts.
This epistemological gap motivates the present study. While prior research has linked SHRM with CP [17,18] and SL with the development of sustainable cultures [6,8], few studies have simultaneously explored how both constructs interact in rural and family contexts to influence CP. Moreover, most research on SHRM and SL has focused on industrialised Western settings, without considering how territorial and community factors reshape these dynamics [19].
Accordingly, a gap persists in understanding how SP mediate these relationships and how KM strengthens or weakens their impact in organisations highly dependent on local human and social capital. In response to these limitations, Table 1 summarises the main theoretical gaps identified in the literature, the specific contributions of this study, and their correspondence with the research hypotheses (H1-H5), ensuring coherence between the theoretical framework, the identified gaps, and the proposed model.
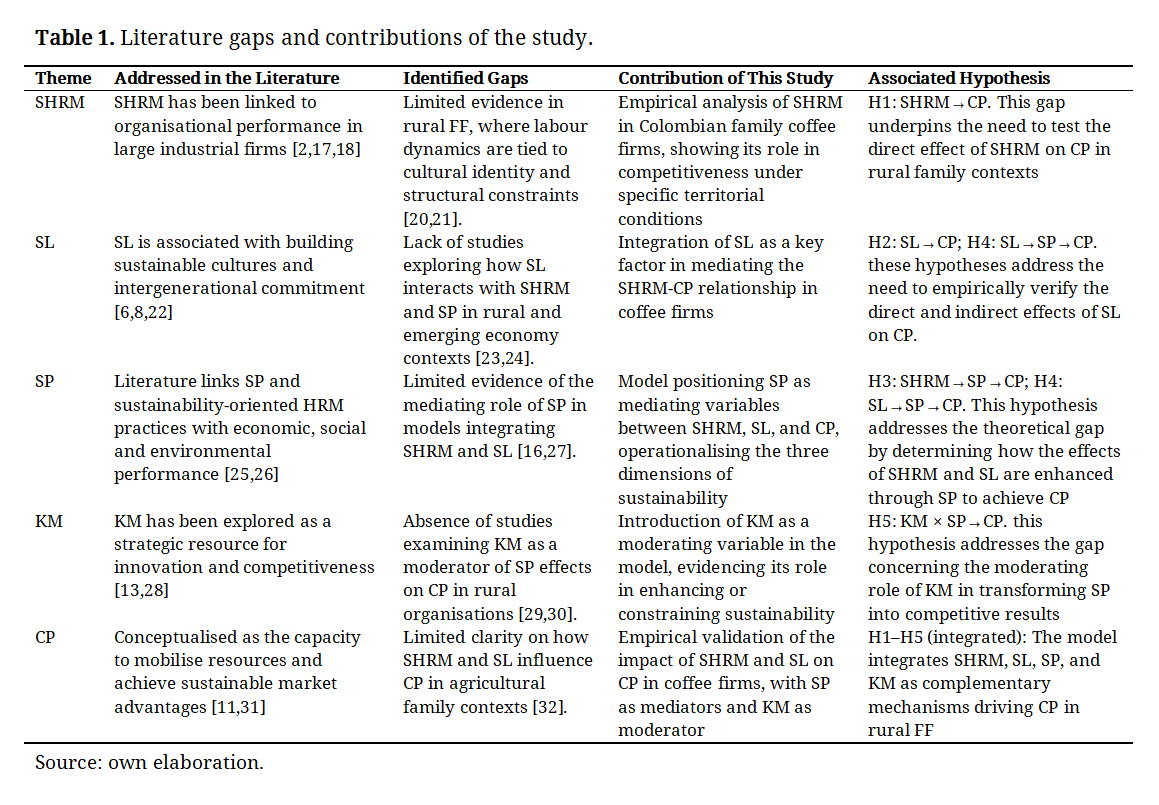 Table 1. Literature gaps and contributions of the study.
This study seeks to address this gap by integrating five key constructs: SHRM, SL, SP, KM, and CP. In particular, it posits that SP act as mediators between SHRM, SL, and CP, while KM moderates the effects of such practices on C. Accordingly, it proposes an empirical model that not only validates causal relationships, but also offers a contextualised understanding of organisational sustainability in Colombian family coffee firms.
From a theoretical standpoint, this study extends sustainability and family business literature by analysing the joint interaction between SHRM and SL as complementary mechanisms for achieving organisational sustainability. SHRM provides the strategic infrastructure that embeds social, environmental, and economic goals into human resource systems [18,33,34] while SL acts as the behavioural driver that translates these principles into values-based and long-term decision-making [35,36]. By connecting these two perspectives, the study addresses the gap noted by [9,11] regarding the need for integrative models linking leadership and sustainability-oriented management system.
Beyond this core interaction, the model also incorporates SP and KM as mechanisms explaining how sustainability is operationalised and transformed into CP. In this way, the study offers a systemic view of how leadership, human capital, and organisational learning converge to strengthen the competitiveness of Colombian family coffee SMEs under a sustainability framework.
This theoretical integration contributes to building an empirical bridge between people management, SL and knowledge-based resources, offering new insights into how FF in rural territories can align sustainability with long-term competitiveness.
This theoretical and practical integration provides a systemic understanding of how leadership, human capital, and organisational learning converge to strengthen the competitiveness of Colombian family coffee SMEs under a sustainability framework. In doing so, the study not only bridges theory and practice but also offers guidance for rural organisations seeking to reconcile cultural identity with global sustainability imperatives, and for policymakers and associations aiming to enhance the competitiveness of the coffee sector through comprehensive and inclusive sustainability strategies.
Moroever, in the Colombian rural context, family coffee firms represent a distinctive organisational setting where sustainability, culture, and competitiveness intersect. Their strategic behaviour is shaped by intergenerational values, stewardship orientation, and strong territorial identity, which connect business continuity with community wellbeing. However, these same characteristics coexist with structural limitations such as informality, limited access to technology, and dependence on climatic and market conditions that influence how sustainability and leadership practices are implemented. This dual configuration makes Colombian rural FF an exceptional context for examining how SHRM and SL interact with SP and KM to enhance CP.
In terms of structure, the article is organised into different sections. Following this introduction, the theoretical framework and research hypotheses are presented. The methodology is then outlined, based on PLS-SEM. Next, the empirical results are reported and discussed in light of the relevant literature. The article concludes with theoretical and practical contributions, as well as its limitations and avenues for future research (see Table 1).
In this section, the current state of the art is addressed, critically examining the nature and function of the predictor variables of CP, which in this study are SHRM and SL, mediated by PS and moderated by KM. The theoretical foundation of this study is presented in Figure 1.
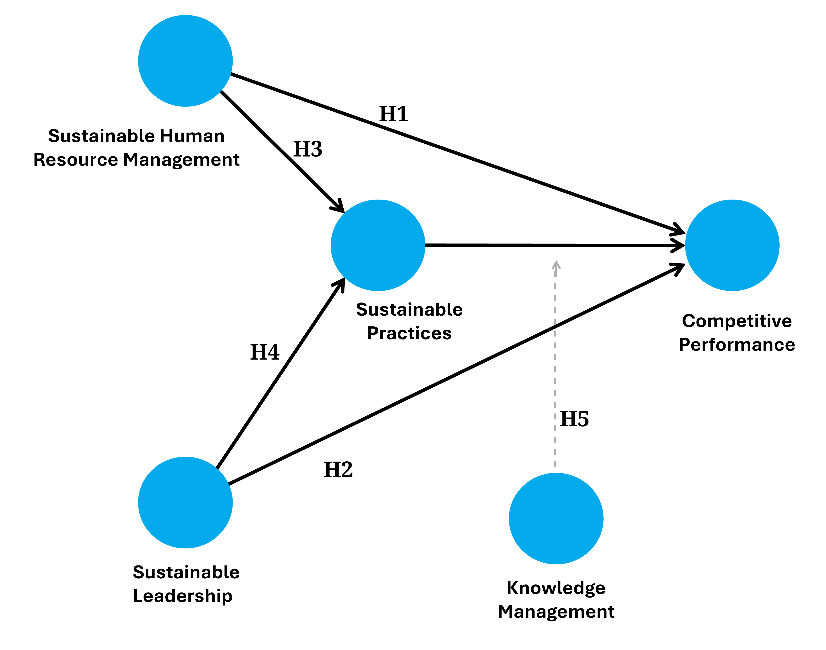 Figure 1. Hypothetical approach.
The SHRM is understood as a strategic approach that incorporates sustainability principles into human capital management, linking labour, organisational, and leadership practices with long-term objectives [18,33]. This approach seeks to align economic, social, and environmental goals with employee wellbeing, equity, and professional development [17]. It differs from traditional HRM by emphasising organisational justice, active participation, continuous training, psychosocial health, and diversity. Such practices act as levers to promote resilient, innovative, and socially responsible organisational cultures [7,27]. In particular, the selection and retention of employees whose values are aligned with sustainability, along with reward systems that incentivise responsible behaviours, have shown positive effects on CP [37].
From the resource-based view (RBV) [38], SHRM can be conceived as a hard-to-imitate strategic resource that develops organisational capabilities supporting person–organisation alignment and reinforcing the implementation of sustainable practices (SP). Such capabilities contribute to enhancing firms’ reputation and competitive performance and may also nurture a stronger sense of collective organisational efficacy [11,39].
Beyond mitigating impacts, some studies show that SHRM can optimise internal processes and reconfigure organisational structures in FF, reinforcing their capacity to contribute to social and ecological wellbeing [34,26]. Recent research has also shown that the sustainability of HR practices in FF is conditioned by family values, governance mechanisms, and succession processes, all of which affect their continuity and effectiveness, particularly in rural environments [20,33,40].
Consequently, ref. [17] has shown that SHRM functions as an intangible infrastructure that underpins sustainability in complex organisational environments, by facilitating processes of continuous learning, adaptability to change, and cultural cohesion when integrated with SL [41]. This type of talent management does not operate in isolation; rather, it interacts with other dimensions of the organisational system, strengthening communication channels, ethical decision-making, and employee commitment. When SHRM practices are aligned with the organisation’s overall strategy, they not only enhance productivity and innovation but also strengthen its reputation in the marketplace [4,17,33]. Such alignment transforms talent management into a competitive lever that combines internal efficiency with social, economic, and environmental commitment for FF coffee businesses.
Likewise, ref. [42] demonstrates that SHRM practices foster sustainable performance when variables such as employee participation in ecological initiatives and long-term orientation are activated. Thus, the more closely human resource policies are aligned with sustainability principles, the greater the leadership capacity to translate them into concrete practices of CP [43].
In line with the above, the following hypothesis is proposed:
Hypothesis (H1). SHRM has a direct positive effect on the CP of FF.
Sustainable Leadership (SL)Over recent decades, organisational leadership has evolved from models centred on profitability to ethical and integrative approaches oriented towards sustainability [6,9,33]. SL is defined as a style that articulates economic, social, and environmental dimensions, creating enduring value for the organisation and its stakeholders [34,35]. Unlike transformational or ethical approaches, it integrates both perspectives into a systemic framework that strengthens resilience and institutional legitimacy [44,45].
From the RBV [38], SL constitutes an intangible resource capable of activating dynamic capabilities to anticipate trends, adapt to complex contexts, and innovate in organisational processes and relationships [46]. Its influence is particularly decisive in SMEs, where leadership directly impacts culture and strategy [24,47]. In FF, where management is often concentrated in the founder or manager, SL can orient strategy towards responsible practices, trust-based community relations, and purpose-driven innovation processes [22,48]. For this reason, in the present study SL is conceptualised as an exogenous variable of the causal model, consistent with previous findings that highlight its significant direct and mediated influence on sustainable performance, as noted by [41].
In a complementary manner, stewardship theory provides an explanatory framework for SL in family businesses. Under this logic, family leaders act as custodians of the intergenerational legacy, prioritising collective well-being over individual interest [49]. When family executives assume a stewardship role, a long-term orientation and ethical coherence in decision-making are reinforced, fostering the integration of SHRM and SL [50]. Thus, the effectiveness of SL in FF also depends on specific boundary conditions. Family governance through protocols, boards or succession rules contributes to institutionalising decisions and reducing emotional conflicts in the adoption of SP [51].
For this reason, in this study, SL is proposed as an exogenous variable within the causal model, in line with previous findings that demonstrate its significant influence both direct and mediated on sustainable performance, as shown in the study by [41]. Considering the above, when SHRM practices are aligned with the organisation’s overall strategy, they not only enhance productivity and innovation but also strengthen the organisation’s reputation in the marketplace [4,17,33]. This alignment transforms talent management into a competitive lever that combines internal efficiency with social, economic and environmental commitment for FF.
Likewise, SL, understood as the capacity to lead with a long-term vision, a strong sense of responsibility and coherence with organisational values, facilitates adaptation to changing environments and the creation of shared value [6,25,39]. In the coffee sector, leaders who foster trust, innovation and cohesion are more likely to consolidate strong relationships with their environment, which translates into sustained and sustainable competitive advantages.
Based on the above, the following hypothesis is proposed:
Hypothesis (H2). SL has a direct positive effect on the CP of FF.
SP as a Mediator of the Relationship between SHRM and SLIn an environment characterised by uncertainty and increasing social, environmental, and regulatory pressures, organisations are called upon to adopt responsible and inclusive governance models. In this context, SL acts as a catalyst for organisational change; however, its effect on CP often materialises indirectly through SP [35,41].
From this perspective, SP constitute the main operational channel through which SL translates its vision into organisational outcomes. These practices enable leaders’ values to be transformed into concrete and sustainable actions across three interdependent dimensions: economic, environmental, and social [22].
SP thus serve as the operative mechanism through which leadership values are embodied in tangible actions within the economic, social and environmental dimensions [22]. In FF, these practices acquire a dual function: enhancing competitiveness while sustaining community cohesion and cultural rootedness [15,27].
The economic dimension relates to operational efficiency, innovation, and long-term value creation [52,53]; the social dimension to employee well-being, equity, and relational capital; and the environmental dimension to energy efficiency, waste reduction, and responsible use of resources [54,55].
According to the report by the Organisation for Economic Co-operation and Development [56], the integration of SP in small and medium-sized enterprises not only responds to ESG standards but also enhances their capacity for innovation, differentiation, and strategic adaptation, enabling access to green financing, integration into global value chains, and the retention of sustainability-conscious consumers [52]. From the perspective of the RBV [38] and Stakeholder Theory [57], SP represent valuable, difficult-to-imitate, and externally oriented organisational capabilities, which explains their mediating role between leadership and CP.
From these perspectives, recent evolutionary analyses indicate that linking SP with SHRM is increasingly connected to competitiveness [58], and additionally, in this line, the authors [59] reinforce the idea that human resource systems grounded in ethical alignment and sustainability create the conditions for stronger organisational performance and long-term strategic advantage. This implies going beyond internal policies to generate positive impacts in community-oriented contexts, under the premises of sustainability. This orientation, which combines employee well-being and organisational transformation towards sustainability, strengthens the firm’s competitiveness [60].
Accordingly, the following mediation hypotheses are proposed:
Hypothesis (H3). SP mediate the relationship between SHRM and CP.
Hypothesis (H4). SP mediate the relationship between SL and CP.
Integrated KM Applied to Sustainable Practice ModelKM is recognised as a first-order strategic resource for enhancing CP and facilitating the transition towards sustainable models [61]. From the RBV, intangible resources particularly organisational knowledge constitute a key source of sustainable competitive advantage, provided they are valuable, rare, inimitable, and non-substitutable [38]. The Knowledge-Based View complements this perspective by positing that the primary function of the firm is to integrate and apply knowledge to create value [62,63].
Authors such as [64] developed the SECI model socialisation, externalisation, combination, and internalization to explain the dynamic conversion between tacit and explicit knowledge as the foundation of organisational innovation. This perspective converges with the proposal of [65] on learning organisations, where continuous learning and systems thinking strengthen adaptive and resilient capacities. Recent research highlights that KM strategies act as enablers when articulated with Corporate Social Responsibility (CSR) practices, thereby enhancing innovation and competitiveness [28,29].
The literature also emphasises that integrating knowledge oriented towards SP requires leadership with a long-term vision and an organisational culture conducive to innovation [66]. From the standpoint of Dynamic Capabilities Theory, KM is understood as a capability that enables the integration, building, and reconfiguration of competences to respond swiftly to environmental challenges [67]. Consequently, KM not only drives innovation and CSR but may also play a moderating role in the relationship between SP and CP [68].
In the case of FF, KM serves as a bridge between tacit knowledge (derived from intergenerational experience and territorial rootedness) and explicit knowledge (the formalisation of SP and innovations). This articulation fosters the creation of economic, social and environmental value, thereby enhancing both competitiveness and long-term sustainability [69].
In this way, KM enables the capitalisation of experiences derived from SP, transforming them into continuous improvements that strengthen CP [64,70]. Both SHRM and SL benefit from this flow of knowledge, which enhances the positive effects of SP on competitiveness. Therefore, the theoretical framework illustrated in Figure 1 acknowledges that competitiveness in FF does not depend solely on internal efficiency, but rather on the interaction between SHRM, leadership, sustainability and organisational knowledge within a framework of governance and family values.
Accordingly, the fifth hypothesis is proposed:
Hypothesis (H5). KM moderates the mediation between SP and CP.
Competitive Performance within the Framework of SustainabilityCP has traditionally been measured through economic indicators such as profitability, productivity or market share. However, recent approaches to corporate sustainability broaden this view by integrating environmental and social dimensions into performance assessment [71,72]. In this regard, sustainability rating systems and balanced KPIs grounded in the triple bottom line framework link integrated sustainability performance to long-term strategic alignment and competitive advantage [73].
In the case of FF, CP depends not only on internal efficiency but also on social legitimacy, territorial embeddedness and resilience to climatic and market volatility [15,74].
The literature shows that SP, both social and environmental, enhance financial performance and corporate reputation [52]. By integrating the principles of the triple bottom line, firms strengthen their capacity for innovation and differentiation [75]. From the perspective of RBV, proactive sustainability strategies generate dynamic capabilities that are difficult to imitate, thereby reinforcing competitive advantage [76]. Recent studies confirm that eco-innovation improves relationships with stakeholders and enhances the competitive positioning of organisations [43].
In family businesses, this relationship becomes even more significant, as CP is closely linked to intergenerational legacy and the ability to transfer both economic and social value across generations [32]. Recent research confirms that legacy operates as an articulating mechanism of values and practices that are transmitted and transformed over time, shaping both strategic orientation and the way business families conceive their continuity [77].
Accordingly, the theoretical model presented in Figure 2 recognises that competitiveness in coffee FF does not depend solely on internal efficiency but rather on the interaction between SHRM, leadership, sustainability, and organisational knowledge within a framework of governance and family values.
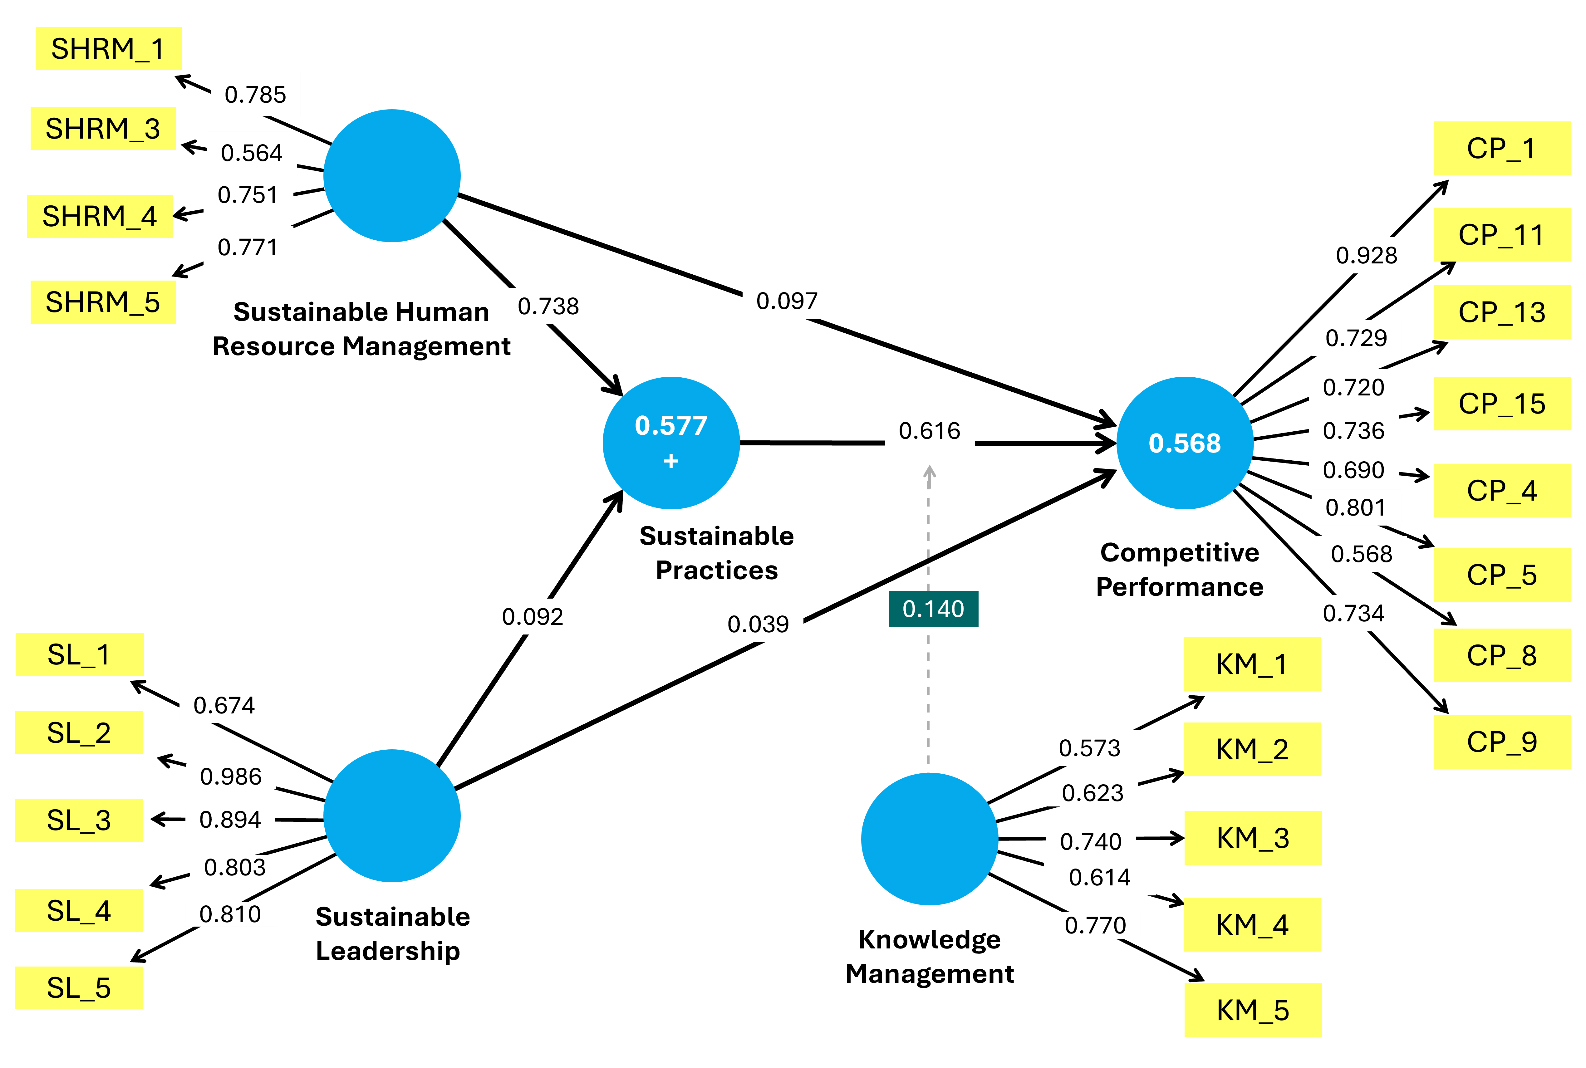 Figure 2. Structural model. Source: authors’ own elaboration based on the Smart PLS 4.1.1.4.
The present study employed a quantitative methodology in which measurement instruments for the constructs were validated, and the hypothesised relationships were tested through structural equation modelling under the PLS-SEM. For data collection, a structured survey instrument was designed and distributed across six thematic blocks. Each dimension was assessed using five items on a seven-point Likert scale, ranging from 1 (strongly disagree) to 7 (strongly agree), following the recommendations of [78] for PLS-SEM analysis.
After the theoretical review, content validity was conducted through expert judgement, given that the instrument was adapted for the purposes of this study. The five experts evaluated the conceptual clarity of the items, the coherence between latent and observable variables, the sufficiency to determine whether the items adequately addressed the constructs, the relevance to ensure the themes were of interest to respondents, and the absence of response induction to confirm the lack of bias from the researchers [79]. A pilot test with 12 volunteers contacted by the researchers was also carried out to make further adjustments and improve item clarity.
Subsequently, the measurement instruments were validated through exploratory factor analysis (EFA) to carry out an initial assessment of the quality and relevance of the items. Confirmatory factor analysis (CFA) was then applied to evaluate the reliability and validity of the constructs, including both convergent and discriminant validity. Thereafter, Structural Equation Modelling (SEM) was performed using the adjusted PLS technique to ensure the robustness and quality of the analysis. The software SmartPLS version 4.1.1.4 [80] was used for this purpose.
SampleThis study was conducted within the framework of the Comité de Cafeteros de Antioquia (CCA), a regional entity affiliated with the Federación Nacional de Cafeteros de Colombia (FNC), a non-profit guild organisation representing coffee-producing families. The FNC is responsible for aligning coffee production with sustainability policies, rural well-being, and productive development in the country, being one of the most representative institutions in Colombian agriculture [81,82].
The sample was non-probabilistic and based on convenience, given the difficulties in accessing the totality of FF.
Supported by the exploratory nature of the proposed model, a non-probabilistic convenience sampling method was used due to the accessibility of firms that authorised the use and management of their data. Moreover, representativeness was sought by including companies of various production scales from small to large and with different governance structures. This followed the recommendations of [83] for PLS-SEM studies in very specific and hard-to-access social contexts. Similarly, following [84], non-probabilistic sampling allows researchers to address the practical constraint of obtaining an exhaustive sampling frame a situation frequently encountered in the social and behavioural sciences. Consequently, the non-probabilistic sample is appropriate for the aim of this research, as it seeks to maximise explained variance and assess causal relationships, which is inherent to the PLS-SEM approach [85].
Accordingly, the sample consisted of 232 valid surveys administered to executives, department heads, supervisors, and administrative professionals linked to coffee companies affiliated with the CCA, as well as to owners of family coffee businesses. Regarding the obtained sample, it is important to note its statistical relevance, as it far exceeded the recommendations for PLS-SEM studies, following the guidelines of [86] and their 10-times rule. In the present model, the construct SP comprised 12 indicators, thus requiring a minimum of 120 cases. Therefore, the obtained sample (n = 232) significantly surpassed this threshold [87].
In our study, the selection of this group responded to the need to capture the perceptions and experiences of actors with direct or indirect responsibility in strategic decision-making, the implementation of SP, and human talent management. This approach aligns with previous research highlighting that senior and middle managers possess privileged knowledge of internal processes and organisational sustainability dynamics [17,35].
The target population focused on organisations with a consolidated business structure within the coffee value chain but with variability in size, technological level, and degree of formalisation, allowing for a more heterogeneous representation of the constructs. Regarding the inclusion process, both in-person and virtual questionnaires were administered during the fieldwork period, which took place between August 2024 and June 2025, in coordination with the CCA.
Participation was voluntary and aimed at managers, supervisors, and owners of family businesses with decision-making responsibilities related to sustainability practices, leadership, and human talent management. Prior to data collection, informed consent and confidentiality were ensured in accordance with institutional ethical guidelines.
Measurement InstrumentsTo ensure that the data collected were reliable and representative of the coffee sector’s reality, a structured questionnaire was designed, organised into six thematic blocks. Each block corresponded to one construct in the model: SHRM, SL, SP, CP, KM, and a sociodemographic section. Item selection was not arbitrary: it was based on recognised and validated scales from previous studies, but adapted to resonate with the everyday reality of coffee producers in Antioquia.
Content validity was ensured through expert judgement, guaranteeing item relevance. The evaluation criteria included: sufficiency (analysing importance and comparability), clarity (assessing conceptual relevance), coherence (ensuring item alignment with the construct), relevance (confirming contextual adequacy), and absence of response induction (ensuring objectivity and impartiality). Each item was rated on a five-point scale, and agreement levels were determined by calculating the mode for each criterion. Items with a mode of 4 or 5 were selected.
Measurement Instrument for SHRMFor SHRM, the scale employed was based on empirically validated instruments developed by [17,37] complemented by the conceptual foundations of sustainability in people management proposed by [18].
The original items from [37], corresponded to the Green Human Resource Management (GHRM) scale; however, in the present study, they were adapted towards a more integrative SHRM approach, replacing the exclusively environmental emphasis with a broader and more holistic understanding of organisational sustainability, consistent with the theoretical orientations of [17,33]. The adaptations made and the final items included in the instrument are presented in Table 2.
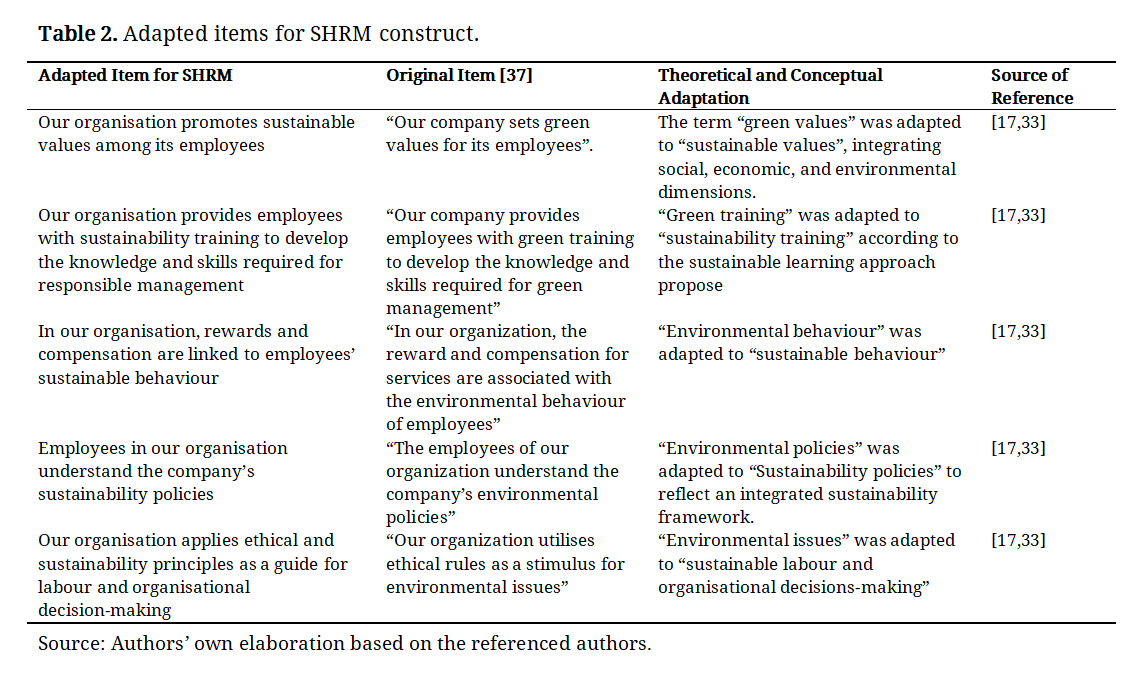 Table 2. Adapted items for SHRM construct.
The present study, the items proposed by [39] for the Green Transformational Leadership (GTL) scale were adapted to operationalise the construct of SL. The original GTL items focused primarily on the environmental dimension of leadership; however, for the purposes of this research, they were reoriented towards a comprehensive sustainability approach that encompasses the triple bottom line environmental, social, and economic performance.
This adaptation was conducted in accordance with the conceptualisation of SL advanced by [35] and grounded in the theoretical foundations established by [23,88]. Moreover, ethics is addressed as a transversal principle of SL. The adaptations and final items are presented in Table 3.
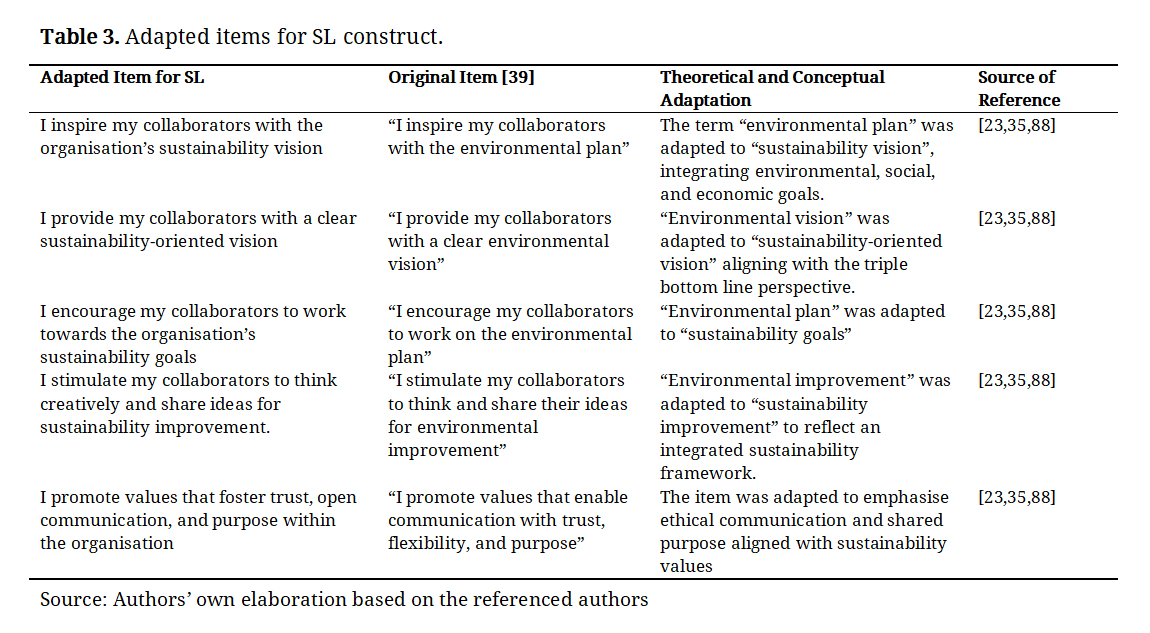 Table 3. Adapted items for SL construct.
The construct of SP was operationalised following the indicators proposed by [19], which were adapted to the context of FF in Colombia. SP was modelled as a second-order reflective construct composed of three first-order dimensions: economic, environmental and social.
The economic dimension included items related to local employment, the purchase of inputs from regional suppliers, and the allocation of funds for sustainability-oriented projects, reflecting the firm’s ability to generate shared value and resource efficiency.
The environmental dimension comprised indicators on the reduction of resource consumption, protection of biodiversity, and implementation of environmentally responsible production processes, representing the operationalisation of ecological responsibility.
Finally, the social dimension captured aspects of employee well-being, equity, and community engagement through items referring to donations, participation in local initiatives, and promotion of sustainable behaviours among workers.
Measurement Instrument for CPAdapted from Yu [89] and grounded in the conceptual foundations of [52], this block incorporated indicators that go beyond traditional financial performance to include dimensions of social legitimacy associated with sustainability. In line with the proposal of [58], who link competitive performance with frameworks of human and organisational sustainability, the items were designed to capture how FF maintain their competitiveness in demanding global markets without relinquishing a sustainability-oriented and responsible approach towards their key stakeholders.
Measurement Instrument for KMAdapted from the SECI model of organisational knowledge creation proposed by [64] and the measurement scale developed by [70], specific items were designed to analyse how sustainability-related knowledge is created, shared, stored and applied in FF. The purpose was to assess the extent to which these processes of socialisation, externalisation, combination and internalisation of knowledge translate into practices that strengthen CP.
A total of 42 items were initially proposed as a result of the literature review. After expert assessment, three were discarded due to a lack of clarity and relevance. The pilot test only suggested minor wording adjustments, so 39 items were retained for quantitative validation.
Instrument ValidationThe EFA was conducted using SPSS software, ref. [90] applying the Promax principal axis rotation method, which is suitable for reflective models. The inferential analysis was carried out using the Kaiser-Meyer-Olkin (KMO) measure to test data consistency and the relevance of the variables to the measurement objective. With a KMO value of 0.79, the sample size was deemed excellent according to the parameters established by [83], as well as Bartlett’s test of sphericity, which yielded a chi-square value of 4448.536 and a significance level of p < 0.000. Thus, the adequacy and relevance of the instrument were confirmed, demonstrating that the EFA was appropriate.
The internal reliability of each construct was assessed using Cronbach’s alpha coefficient. A threshold value of ≥0.70 was adopted as acceptable, in line with standards for confirmatory studies [83]. During the EFA, items with loadings below 0.50 were removed to retain only indicators that made a significant contribution to the construct [78].
For SHRM, five items were quantitatively assessed, all with loadings above 0.50, except for two that were 0.46, evidencing their relevance; only one item (SHRM2) was removed. For SL, all five items were validated, each with loadings above 0.50. For KM, loadings ranged from 0.50 to 0.79, with only one item (KM6) removed. In CP, 8 of 12 items were validated, all with loadings above 0.69, with the highest being 0.80. For the mediating variable SP, 12 of 16 items were validated, with loadings between 0.57 and 0.91 [91].
The total variance explained was also calculated, yielding a cumulative percentage of 73.11%, exceeding the minimum threshold of 60% [91], thereby confirming the practical significance of the factors. The analysis was conducted using principal factor extraction and Promax rotation, consistent with the reflective nature of the model [91]. Accordingly, the final instrument comprised 39 items with factor loadings ranging from 0.57 to 0.91 and Cronbach’s alpha values between 0.739 and 0.921, demonstrating the instrument’s validity. The results of the reliability and convergent validity analysis are shown in Table 4.
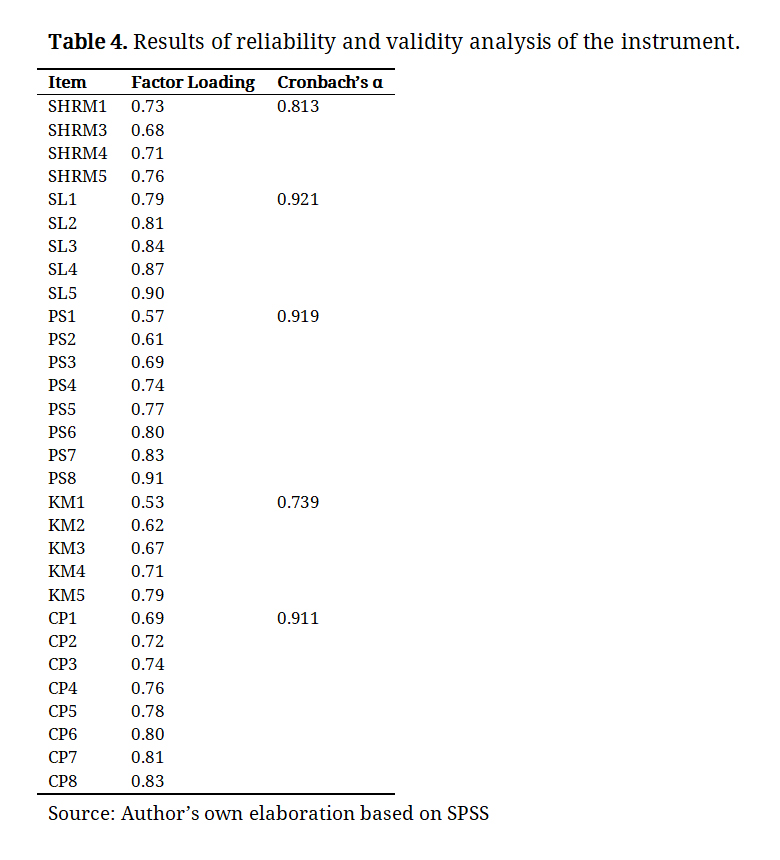 Table 4. Results of reliability and validity analysis of the instrument.
All constructs exceeded the recommended thresholds (α > 0.70; AVE > 0.50), confirming internal consistency and convergent validity [83]. These findings demonstrated the reflective nature of the model, as the items represent observable manifestations of the latent construct [83,84]. The reflective character of the model was evidenced by the high internal consistency and correlation among the indicators of each construct. Consequently, the factor loadings and Cronbach’s alpha values (≥0.70) confirmed the suitability of this orientation.
Likewise, these findings are consistent with the contributions of [92], who argue that reflective models are appropriate for perception-based studies, whereas formative models are more suitable for formal and concise analyses.
Confirmatory Factor AnalysisThe factor loadings of the items were all above 0.70, which is an excellent value supporting item retention. Cronbach’s alpha values exceeded 0.74, while composite reliability values were above 0.81, surpassing the 0.70 threshold recommended by [92] for demonstrating reliability and internal consistency. Convergent validity, assessed through average variance extracted (AVE), was above 0.50 for SHRM, 0.70 for SL, 0.55 for CP, between 0.59 and 0.88 for SP, and between 0.51 and 0.541 for KM, thereby confirming convergent validity (≥0.50) [83]. Table 5 shows the results for reliability and convergent validity.
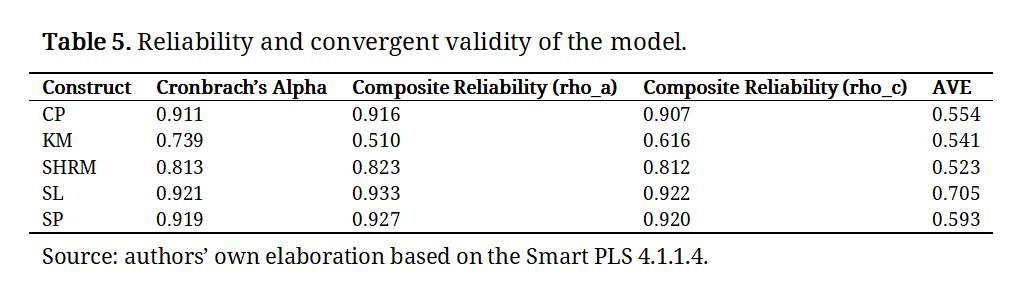 Table 5. Reliability and convergent validity of the model.
Discriminant validity was assessed using the Heterotrait-Monotrait ratio (HTMT). The correlations between indicators were all below 0.85, with confidence intervals below 1 [93]. Consequently, HTMT confidence intervals were below the 0.85 threshold in all cases (see Table 4), confirming discriminant validity of the model. The highest correlation was 0.75 between SHRM and SP, which still remained within the acceptable range. These results demonstrate that the constructs were properly differentiated both conceptually and operationally, as shown in Table 6.
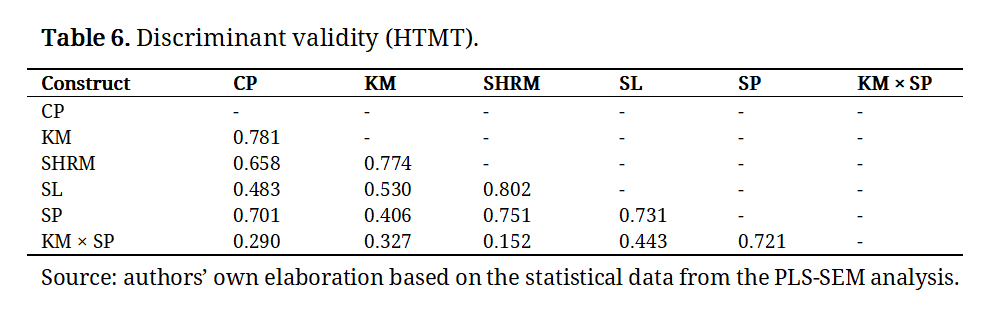 Table 6. Discriminant validity (HTMT).
Similarly, discriminant validity was verified using the [94] criterion, which involves comparing the square root of the AVE of each construct with its correlations with the other constructs. As shown in Table 7, in all cases the square roots of the AVE values were greater than the correlations off the diagonal, thereby confirming the discriminant validity of the measurement models.
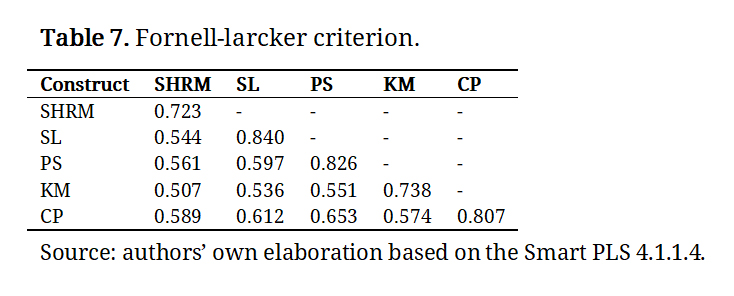 Table 7. Fornell-larcker criterion.
The model confirmed the mediating role of SP in the relationships between SHRM and CP, with adequate path coefficients (>0.30) and significance levels (p < 0.005), as shown in Table 8. Likewise, the moderating variable presented a path coefficient that confirmed the moderating effect of KM (β = 0.140). Direct effects of SHRM on CP and SL on CP were not confirmed. Figure 2 shows the validation of the structural model.
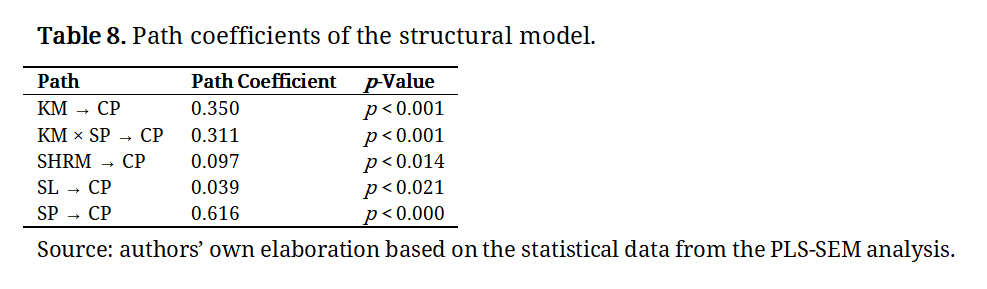 Table 8. Path coefficients of the structural model.
With respect to mediation results, indirect effects are presented in Table 9. The path coefficients for the indirect effects were higher than the direct structural paths between latent and observed variables.
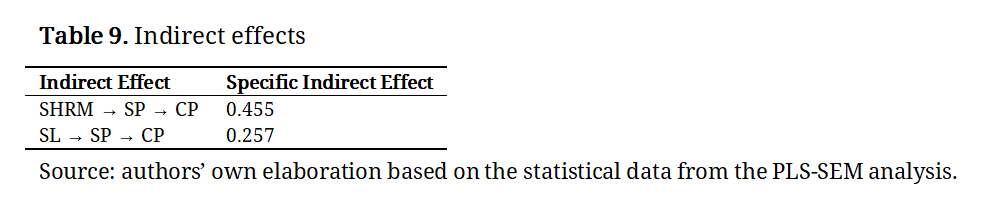 Table 9. Indirect effects
The explained variance was assessed through R2 and adjusted R2 indicators, with values ≥ 0.10 (acceptable) and ≥ 0.25 (good) considered indicative of appropriate explanatory capacity of the constructs. The model demonstrated excellent predictive ability, with values ≥ 0.50. For the dependent variable CP, R2 was 0.568 and adjusted R2 was 0.559, indicating a strong explanatory power, with more than 55% of the variance explained [78]. more than 55% of the variance of the dependent variables is explained [85], which indicates a solid contribution to SHRM, SP, and CP studies. Regarding the predictive validity of the model, the results showed Q2 = 0.31 for CP, indicating a high predictive capacity, and Q2 = 0.23 for SP, reflecting a medium predictive capacity.
With respect to the effect size, the following estimates were found (Table 10). The model validated that SP, as a mediating variable, exerts a large effect on the dependent variable CP (f2 = 0.294 and 0.245, respectively), highlighting its importance in the strategic and operational approach of organizations. Regarding SHRM, SP, and the moderation of KM, the results reveal a moderate effect on the dependent variable, ranging between 0.157 and 0.246. Finally, for SL and CP, the model shows a very small effect size, with a limited statistical contribution (f2 = 0.016) (see Table 10).
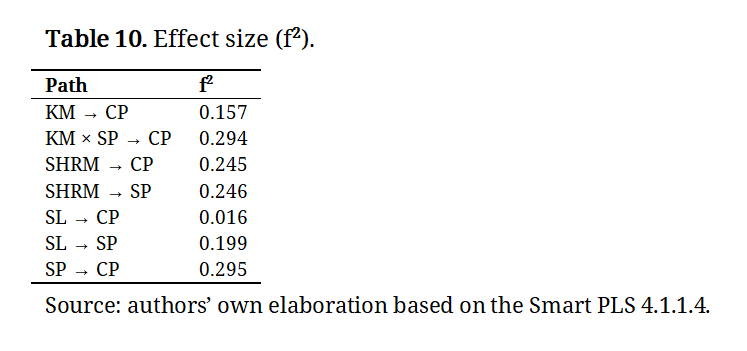 Table 10. Effect size (f2).
For mediation analysis, collinearity statistics were checked. As shown in Table 11, all variance inflation factor (VIF) estimates were well below the threshold of 3.3 recommended by [78]. In particular, the dependent variable CP showed values between 1.008 and 1.744, ruling out multicollinearity issues. This indicates that the independent, mediating, and moderating variables did not introduce redundancy into the structural model.
Since the proposed causal relationships belong to a reflective model, the verification of collinearity was carried out among the predictor constructs of the structural model, rather than among the indicators (which are expected to be highly correlated by the very nature of reflective models). Nevertheless, potential redundancies between latent constructs were ruled out by analysing the VIF values, which in the structural model ranged from 1.008 to 1.744, well below the recommended threshold of 3.3 suggested by [85]. This confirms the absence of multicollinearity problems among the exogenous variables (see Table 11).
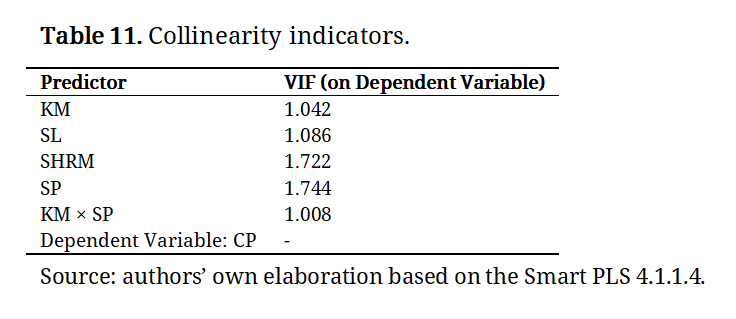 Table 11. Collinearity indicators.
Regarding the model fit, the NFI values (0.801–0.810) are slightly below the conventional threshold of 0.90; however, recent studies suggest that in PLS-SEM models with complex mediations, an NFI > 0.80 is acceptable as an indicator of good model fit [85]. Similarly, the SRMR value (0.043), which is well below the 0.08 threshold suggested by [83], indicates a good overall fit of the model.
The empirical validation of the PLS-SEM model supports the integrative theoretical framework that links SL, SHRM, and SP with CP. These relationships reinforce the propositions of the RBV [38] and the Stewardship Theory [49], showing that leadership and human resource systems act as complementary intangible resources that foster dynamic capabilities for sustainability [33,35].
However, the asymmetry among the three sustainability dimensions (economic, environmental and social) indicates that contextual factors such as institutional weakness, informal governance and limited normative pressure moderate the extent to which SL translates into measurable outcomes, particularly within FF in emerging economies.
In family firm settings, the orientation towards continuity and survival explains how idiosyncratic resources such as social capital, trust, and territorial embeddedness are mobilised to reinforce internal processes and organisational efficiency [15,28]. Thus, economic and environmental practices not only generate immediate outcomes but also become channels through which SHRM and SL are translated into distinctive, hard-to-imitate capabilities, consistent with the logic of the RBV [38]. This aligns with the literature on proactive environmental strategies, which highlights innovation and eco-efficiency as sources of sustainable competitive advantages [54,76].
Limitations of the Social Dimension and the Role of SLThe limited representation of the social dimension within FF can be attributed, first, to governance structures that privilege control and continuity, thereby relegating social investments perceived as risky or less profitable in the short term [95,96], a trend also reflected in recent empirical studies on sustainability maturity in FF, where the social dimension consistently lags behind environmental and economic domains [97]. Resource constraints also play a role, pushing firms towards informal community networks rather than formalised programmes [98]. Finally, social performance measurement remains ambiguous and insufficiently standardised, as highlighted by [60] in their proposal for net-positive impact scales, and by [83] in their discussion of the challenges of capturing such dimensions within PLS-SEM models.
This result should be interpreted considering that the social dimension, operationalised through indicators of well-being and participation, tends to be expressed informally in family SMEs, which may limit its empirical capture within the PLS-SEM model.
SL, on the other hand, emerges as an exogenous driver that aligns long-term vision with territorial embeddedness, channelling intergenerational values into SP with economic and environmental impact [50]. In FF, this stewardship role reinforces ethical coherence and legitimacy [49], though it does not always translate into immediate and measurable social outcomes [46,41].
Continuity and family legacy influence the ways in which SHRM and SL contribute to CP. Territorial reputation and transmitted values underpin decisions that privilege stability and resilience, with stronger emphasis on economic and environmental outcomes; the social dimension, being more intangible, tends to manifest in informal ties and remains under-measured [99].
This finding reveals a theoretical boundary condition for the social dimension of sustainability. While family-based governance fosters trust and continuity, it can paradoxically constrain the institutionalisation of social practices [100,101]. The absence of formal metrics and the predominance of informal community ties limit the visibility and measurement of social performance, turning it into a latent dimension that, although culturally embedded, remains underrepresented in statistical models. This gap invites future research to develop integrative frameworks and measurement tools that capture social value creation beyond economic and environmental proxies.
The interpretative synthesis of these mediating effects is presented in Table 12, which summarises how the economic, environmental, and social dimensions interact within FF and the varying degrees of their institutionalization.
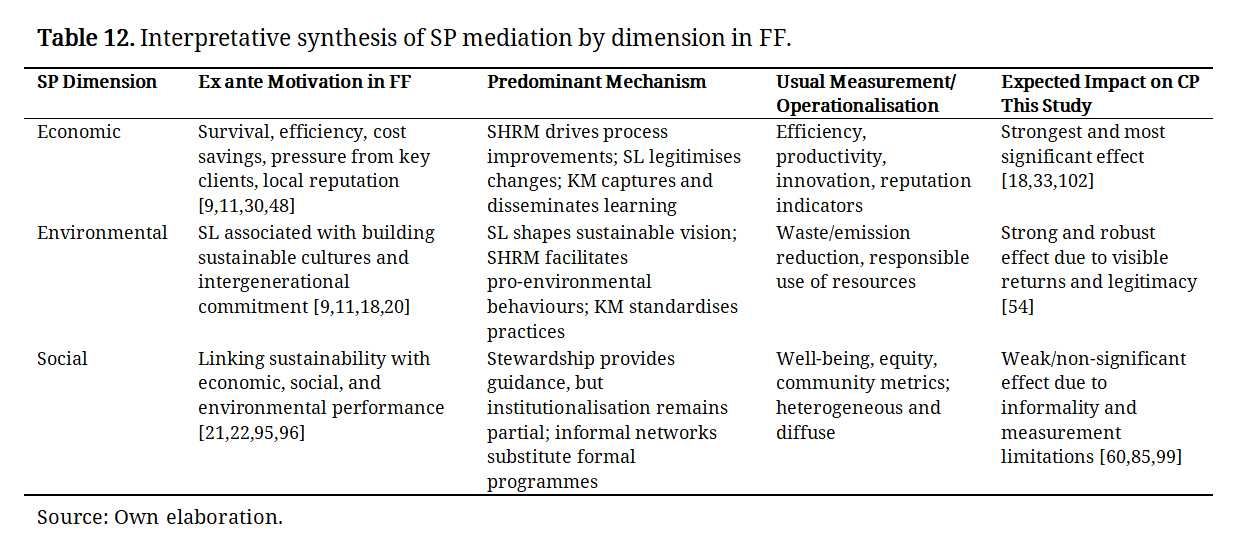 Table 12. Interpretative synthesis of SP mediation by dimension in FF.
The validation of mediations H3 and H4 confirms that SP function as a bridge between SHRM, SL, and CP. Nevertheless, economic and environmental dimensions mediate more strongly than the social one, which nuances the RBV by illustrating how familiness channels resources towards tangible efficiencies [38], while stewardship perspectives explain the preference for initiatives that secure reputational and technical continuity [18,33].
KM emerges as an articulating axis that enables the transformation of informal learning into sustainable organisational capabilities. From the SECI model [64] to recent evidence showing how the interaction between knowledge and social responsibility fosters innovation [28], it becomes evident that the social dimension requires explicit learning and transfer mechanisms that transcend family logics to consolidate into systematic governance structures capable of integrating social practices coherently with economic and environmental domains.
Overall, the discussion reaffirms that the proposed model not only offers an integrative perspective but also fills a gap in the literature by empirically demonstrating through robust evidence how SP and KM interact to strengthen the competitiveness of coffee FF. This framework, supported by key contributions such as [18,33,35,60], showcases the originality of the model by positioning KM as the thread that transforms SP into tangible strategic value. In doing so, it provides a transferable reference framework adaptable to other productive sectors with similar characteristics.
Theoretical and Managerial ImplicationsFrom a theoretical standpoint, this study deepens the understanding of how SHRM and SL operate synergistically through SP to influence CP, in line with the research of [103,104], who highlight the need to move towards systemic and integrative sustainability models. The model confirms that leadership embodies the behavioural pathway that activates sustainable capabilities embedded in HR systems, while SP translate these into operational realities. The non-significant role of the social dimension further refines sustainability theory by evidencing that social outcomes depend on contextual governance, institutional strength, and measurement maturity.
This asymmetry may also be related to the nature of the indicators used to measure each dimension. While economic and environmental practices are often institutionalised through management systems and measurable processes, social practices such as employee well-being, equity, and community engagement are typically embedded in informal routines and relational norms. This aligns with [100,104], who highlight that in FF, social sustainability is frequently expressed through relational trust and moral obligations rather than formalised mechanisms. Consequently, the weaker empirical weight of the social dimension does not necessarily imply a lack of commitment, but rather a lower degree of structural articulation within organisational governance.
This study refines the understanding of how SL and SHRM operate jointly through SP to enhance CP in FF within the Colombian coffee sector. The findings substantiate an integrative. The findings substantiate an integrative perspective consistent with resource and knowledge-based arguments, showing that leadership and HR systems act as complementary intangible assets that enable dynamic capabilities. Crucially, the mediating role of SP is uneven across dimensions: economic and environmental practices exhibit robust links to CP, whilst the social dimension shows limited and context-dependent effects. This asymmetry adds nuance to sustainability theory by suggesting that the translation of values into outcomes depends on institutional maturity, governance formality, and measurement readiness in rural family business settings.
Practical Contributions to ManagementFor owners and managers of family SMEs, the results highlight the value of aligning SL and SHRM with verifiable sustainability routines. Priorities include (i) embedding sustainability-related objectives in HR systems, (ii) routinising economic and environmental practices that improve efficiency, innovation, and legitimacy, and (iii) formalising knowledge flows so that lessons learned from SP become standard operating procedures. Strengthening these mechanisms can convert dispersed initiatives into repeatable capabilities, improving positioning in domestic and international markets.
Policy ImplicationsThe evidence suggests that public policy can play a catalytic role in consolidating the social dimension of sustainability in rural SMEs. Policymakers should: (i) incentivise the formalisation and reporting of social practices; (ii) support training in SL, SHRM, and KM tailored to territorial realities; and (iii) promote collaborative platforms among producer associations, local governments, and universities to codify and diffuse effective practices. Such measures can bridge the current gap between informal community engagement and measurable social performance, complementing the stronger economic and environmental pathways.
Managerial Implications and Actionable PropositionThis section consolidates the previous operational, functional, and strategic proposals into six cohesive, evidence-based managerial propositions. Each derives directly from the validated mediations SP and the moderation effect KM in the PLS-SEM model and is theoretically anchored in the RBV, Stewardship Theory, and Knowledge-Based perspectives already discussed.
Institutionalise Sustainability within Human Resource Systems (SHRM)Building upon the arguments of [33,35] this proposition highlights that sustainability must be embedded in HR subsystems to become a strategic capability. Selection, appraisal, and reward mechanisms should include sustainability performance indicators, ensuring that leadership behaviour and employee goals align with long-term sustainability outcomes. This formalisation transforms SHRM from an administrative function into a driver of competitive advantage, reinforcing the relational capital of family SMEs.
Lead for Operationalisation (SL-SP)Consistent with [46], SL translates sustainability visions into daily routines by empowering middle managers and establishing participatory mechanisms. In a similar vein, ref. [105] shows that organisational capacities and innovation emerge when strategic intentions are operationalised through internal mechanisms and distributed implementation, strengthening resilience in FF.
Systematise Knowledge Flows (KM as Amplifier)In line with the findings of [104], leadership and SHRM processes can be magnified through effective KM. Organisations should establish simple but consistent mechanisms repositories, feedback loops, and communities of practice to capture and disseminate lessons from SP across economic, environmental, and social dimensions. This systematisation enhances learning and accelerates sustainability-driven innovation cycles.
Strengthen the Social Dimension through Formal MechanismsEchoing [100,101], this proposition recognises that social outcomes in FF depend on governance formality. Informal social ties, though culturally valuable, are insufficient to produce measurable results. Establishing social performance metrics, well-being, equity, community engagement and periodic assessments can convert social capital into a strategic asset that complements economic and environmental gains.
Align with Market and Territorial OpportunitiesAs highlighted by [75], integrating sustainability principles into business models enhances product differentiation and international positioning. SMEs should align their SP with territorial resources and market demands, leveraging sustainability certifications, origin designations, and producer associations. This alignment allows family businesses to create shared territorial value while strengthening CP.
Governance for Continuity and StewardshipFollowing the stewardship logic [49,100,101], effective governance mechanisms are crucial to sustain intergenerational commitment and strategic coherence. Family councils, protocols, and role clarity can institutionalise sustainability-oriented decision-making, reducing ad hoc management and ensuring the transmission of sustainable values across generations. Governance thus becomes the structural backbone linking leadership intent, SHRM processes, and sustained performance.
These six propositions synthesise theoretical and empirical insights into a coherent managerial roadmap for FF. They operationalise sustainability not as an isolated initiative but as an integrated management logic embedded in human systems, leadership routines and territorial interactions.
The proposed model can be adapted and further developed by incorporating additional relevant variables across different types of organisations and sectors. For instance, it would be valuable to explore the role of organisational culture, open innovation, wages and incentives, or inter-organisational collaboration as potential additional moderators or mediators, since these factors may enrich the understanding of the relationships among the dimensions analysed.
Moreover, future studies are proposed to conduct a comparative analysis with innovative Spanish firms, with the aim of verifying whether the relationships identified between SHRM, SL, SP, and KM are replicated in more advanced organisational contexts. This comparison would strengthen the external validity of the model and provide useful evidence for decision-making and public policy design.
The dataset generated and analyzed during the current study is available from the corresponding author upon reasonable request.
Conceptualization, CG-G, JC-G, SG-B and VASM; methodology, CG-G, JC-G, SG-B and VASM; software, CG-G, JC-G and SG-B; validation, CG-G, JC-G and SG-B; formal analysis, CG-G, JC-G and SG-B; investigation, CG-G, JC-G and VASM; resources, CG-G, JC-G and SG-B; data curation, JC-G and VASM; writing—original draft preparation, CG-G, JC-G and SG-B; writing—review and editing, CG-G, JC-G and SG-B; visualization, CG-G and VASM; supervision, SG-B; project administration, SG-B; funding acquisition, SG-B. Authors have read and agreed to the published version of the manuscript.
The authors declare no conflicts of interest.
This research has been funded by Grant number PID2023-149102OB-I00 from MICIU/AEI/10.13039/501100011033 and the European Regional Development Fund (ERDF), EU.
The authors would like to express their sincere gratitude to the members of the Coffee Growers Committee of Antioquia, National Federation of Coffee Growers of Colombia, for their time, dedication, and support of this research.
1.
2.
3.
4.
5.
6.
7.
8.
9.
10.
11.
12.
13.
14.
15.
16.
17.
18.
19.
20.
21.
22.
23.
24.
25.
26.
27.
28.
29.
30.
31.
32.
33.
34.
35.
36.
37.
38.
39.
40.
41.
42.
43.
44.
45.
46.
47.
48.
49.
50.
51.
52.
53.
54.
55.
56.
57.
58.
59.
60.
61.
62.
63.
64.
65.
66.
67.
68.
69.
70.
71.
72.
73.
74.
75.
76.
77.
78.
79.
80.
81.
82.
83.
84.
85.
86.
87.
88.
89.
90.
91.
92.
93.
94.
95.
96.
97.
98.
99.
100.
101.
102.
103.
104.
105.
Giraldo-Giraldo C, Castro-Gómez J, Gutiérrez-Broncano S, Sánchez Montoya VA. Sustainable human resource management and leadership as drivers of competitive performance: A study on sustainable practices and knowledge management in family firms. J Sustain Res. 2025;7(4):e250072. https://doi.org/10.20900/jsr20250072.

Copyright © Hapres Co., Ltd. Privacy Policy | Terms and Conditions


