Location: Home >> Detail
J Sustain Res. 2026;8(1):e260010. https://doi.org/10.20900/jsr20260010
 ,
Eugenia Naranjo 1,2 ,
Pedro Peñafiel Arcos 3 ,
Mery Mendoza Castillo 3
,
Eugenia Naranjo 1,2 ,
Pedro Peñafiel Arcos 3 ,
Mery Mendoza Castillo 3
1 Facultad de Mecánica, Escuela Superior Politécnica de Chimborazo (ESPOCH), Panamericana Sur km. 1 ½, Riobamba, 060155, Ecuador
2 Grupo de Investigación y Desarrollo de Nanotecnología, Materiales y Manufactura (GIDENM), Escuela Superior Politécnica de Chimborazo, ESPOCH, Panamericana Sur Km 1½, Riobamba, 060155, Ecuador
3 Escuela Superior Politécnica de Chimborazo (ESPOCH), Sede Orellana, El Coca, 220150, Ecuador
* Correspondence: Nestor Ulloa
Modeling the axial load-bearing capacity of short concrete columns confined with fiber-reinforced polymer (FRP) sheets necessitates consideration of several key factors, such as material properties, geometric dimensions, and the confinement effects provided by the FRP wrapping. These considerations are vital for the design of more durable and sustainable FRP-confined concrete structures. This research presents a comparative evaluation of eight machine learning (ML) classification algorithms and one symbolic regression method aimed at predicting the enhancement in axial compressive strength (Fco/Fcc) of FRP-wrapped short concrete columns with different cross-sectional shapes. The study accounts for variables including size effect (b/bo), aspect ratio (d/b), corner rounding (r/b), wrapping stress (2·t·Ffrp / b·Fco), and wrapping stiffness (2·t·Efrp / ν·b·Ec). A thorough literature review yielded a dataset of 500 experimental results on FRP-confined concrete columns with a variety of concrete strengths, cross-sectional shapes (square and circular), FRP types, and wrap thicknesses. This dataset was divided into a training set of 400 samples (around 80%) and a validation set of 100 samples (approximately 20%). Results showed that the response surface methodology (RSM), gradient boosting (GB), CN2, support vector machine (SVM), k-nearest neighbor (KNN), and Tree models achieved excellent prediction accuracies exceeding 90%, while the RF model delivered very good performance with about 88% accuracy. In contrast, the naive bayes (NB) and stochastic gradient descent (SGD) models underperformed, reaching accuracies below 70%. Analysis using correlation matrices and sensitivity evaluations revealed that confining stress and stiffness were the most significant predictors, followed by corner radius, aspect ratio, and size effect. Notably, the RSM approach was unique in providing a closed-form equation, making it suitable for direct application in design practice.
SSE, sum of squared error; MAE, mean absolute error; MSE, mean squared error; RMSE, root mean squared error; R2, coefficient of determination; GB, Gradient Boosting; CN2, CN2 Rule Induction; NB, Naive Bayes; SVM, Support vector machine; SGD, Stochastic Gradient Descent; KNN, K-Nearest Neighbors; Tree, Tree Decision; RF, Random Forest; 3D, three dimension; CFRP, carbon fiber reinforced polymerc
Because of its outstanding mechanical properties, the use of fiber reinforced polymer (FRP) composites instead of traditional materials has greatly aided in the retrofitting or strengthening of various concrete elements [1]. FRP materials are extremely robust and corrosion-resistant, making them ideal for use in hostile situations where traditional reinforcing materials may decay over time [2]. Furthermore, FRP materials are frequently derived from recycled resources and are easily recyclable, making FRP reinforcement a long-term alternative for increasing the performance of reinforced concrete (RC) components [3–6]. FRP confinement is a particularly cost-effective approach for increasing the performance of existing RC elements since it eliminates the need for additional reinforcing materials and can lower the thickness of the concrete required.FRP confinement has been found to improve the performance of reinforced concrete (RC) columns, increasing their strength and ductility. This can improve safety and lessen collapse hazards during earthquakes and natural calamities [6]. The circular design of FRP sheets improves the concrete core's confinement efficiency, whereas rectangular parts have lesser homogeneity. The use of FRP sheets is determined by their properties, concrete, applied load, and cross-section geometry, which includes the rectangularity aspect ratio (t/b), corner radius (rc), and specimen size [7]. The motivation for researching FRP-confined rectangular RC columns stems from its ability to accommodate a wide range of column sizes and shapes [8]. However, predicting the maximum axial load of FRP-confined rectangular RC columns is difficult due to their complex and nonlinear behavior, the varying properties of FRP materials, the complex interaction between FRP confinement and the concrete matrix, and a lack of experimental data. Despite these challenges, ongoing research strives to increase our understanding of FRP-confined rectangular RC columns and create more precise models for forecasting their maximum axial load [1]. This will lead to developments in the field, as well as improvements in structural design and construction. Intensive efforts have been undertaken to develop a model capable of predicting the compressive strength of restricted rectangular columns [9]. These attempts employed either mathematics (design-oriented) or machine learning models. Given the given experimental data, design-oriented models anticipate the behavior of FRP-confined rectangular RC columns using empirical equations and simplified assumptions. Berradia et al. [10] improved empirical models for the axial loading capacity (ALC) of circular normal strength concrete (NSC) columns wrapped in carbon fiber reinforced polymer (CFRP) sheets with interior transverse steel reinforcement (TSR) (CSC columns) by incorporating the interaction mechanism between TSR and FRP confining behavior. The study used a standard regression analysis technique and artificial neural networks (NNs) to examine the experimental results of 76 CSC columns from prior studies. The proposed NN model was optimized for different hidden layers and neurons. The results were in close agreement with the testing database, with a higher accuracy than the theoretical model. The comparative study confirmed the superiority and accuracy of the predicted strength models for CSC columns. Ma et al. [11] used Carbon fiber reinforced polymer (CFRP) to support concrete-filled steel tubular columns, but it's complicated interactions make strength predictions problematic. To forecast the axial compressive capacity of CFRP-confined CFST short columns, a new method called XGBoost is developed, which uses an advanced machine learning algorithm. The data collection contains 379 records that examine failure modes, stress processes, and the impacts of CFRP layers, core concrete strength, and section shapes on axial compressive capacity. Calculations are performed using eight methods, including linear regression, K-nearest neighbor, support vector machine, and ensemble learning models. XGBoost has the best prediction performance, with an R2 of 0.9719. Also, Onyelowe et al. [5] investigated the effects of fiber-reinforced polymers on the restricted compressive strength of wrapped concrete columns. According to the data, the Fcc value is determined by elements such as FRP thickness, tensile strength, elastic modulus, column diameter, and concrete's confined compressive strength. Five AI approaches were used: genetic programming, artificial neural networks, and evolutionary polynomial regression. The results showed that confinement stress and Ftf have a substantial influence on the Fcc value. The ANN model proved to be more accurate than the EPR and GP predictive models. Other studies, Prakash and Nguyen [12] investigated machine learning methods for predicting the maximum load capacity (MLC) of circular reinforced concrete columns made of Fiber Reinforced Polymer (FRP). The Extreme Gradient Boosting (XGB) algorithm is integrated with unique metaheuristic algorithms to ensure resilience and generalizability over 200 Monte Carlo runs. The model is compared to eight different ML models and assessed for interpretability using SHAP values. The study also created an interactive GUI to improve understanding and application of the XGB model. Xue et al. [13] used materials and machine learning to predict the lateral confinement coefficient (Ks) of reinforced concrete columns. The Ks values were predicted using machine learning models such as genetic programming (GP), minimax probability machine regression (MPMR), and deep neural networks. GP and MPMR both performed well, but the GP model outperformed with more precision and fewer errors. The GP model earned more points and finished first. Nematzadeh et al. [14] investigated the eccentric compressive behavior of steel fiber-reinforced concrete columns strengthened with carbon fiber-reinforced polymers (CFRPs). Eighteen RC columns with plain concrete and fiber-reinforced concrete were subjected to eccentric compressive loading. The results showed that CFRP sheets improved loading capacity and ductility, but steel fibers in the concrete increased ductility. The applied load's eccentricity reduced the influence of CFRP sheet confinement on reinforced concrete strength. An analytical model was created to predict the behavior of fibrous concrete columns restricted with transverse reinforcement and CFRP sheets under eccentric compressive loads. Baili et al. [15] looked at the structural performance of glass fiber-reinforced polymer (glass-FRP) reinforced concrete (RC) columns versus steel rebar RC columns using steel hybrid fibers. The researchers discovered that GFC columns had lower axial strengths and greater ductility indices than SFC columns. The study created a new artificial neural network model and offered a theoretical equation for calculating GFC columns' AS. The results revealed an average discrepancy of 3.2 and 1.9% from the test results. Ilyas et al. [16] described a new GEP model for forecasting the compressive strength of circular CFRP-confined concrete columns. The model, which is based on a large database of 828 data points, has been reviewed and validated using multiple methods. Compared to other AI algorithms, GEP has a simpler mathematical relationship and is more reliable. The model outperforms linear and nonlinear regression models in terms of precision, efficiency, and proximity to the target. It also meets external validation standards better than other traditional models. Sayed et al. [7] reviewed machine-learning techniques for estimating axial compressive load of FRP-confined concrete columns. It discusses influential parameters and their effects on strength, ductility, and failure mode. Data from steel reinforced rectangular concrete columns and externally confined with different FRP composites were used to generate machine-learning models. The models were found to be in good agreement with test results, with gradient boosting and random forest repressors being more accurate.
Research SignificanceThe significance of this research lies in its contribution to advancing the predictive modeling of FRP-confined concrete columns, addressing the challenges posed by their complex nonlinear behavior, varying material properties, and diverse cross-sectional geometries. By leveraging machine learning approaches, including ensemble and regression-based models, this study provides highly accurate tools for estimating axial compressive strength, which enhances the reliability and efficiency of structural design and retrofitting strategies. Furthermore, the research integrates extensive experimental data with AI-driven modeling, offering practical predictive frameworks that reduce reliance on purely empirical or theoretical equations, improve interpretability, and support informed decision-making for the design and optimization of durable and resilient FRP-confined reinforced concrete structures.
Research Gap and Statement of NoveltyDespite considerable progress in modeling FRP-confined concrete columns, existing studies often focus on specific column shapes, limited datasets, or traditional empirical and analytical models that may not fully capture the complex, nonlinear interactions between FRP materials, concrete properties, and geometric parameters. Additionally, while machine learning approaches have been applied, there remains a lack of comprehensive comparative analyses of multiple AI and ensemble models for both circular and rectangular columns, as well as limited integration of sensitivity analysis to identify the most influential factors governing axial compressive strength. The novelty of this research lies in its development of a data-driven framework that combines a diverse experimental dataset with multiple machine learning techniques, including ensemble and regression-based models, to accurately predict the axial compressive strength of FRP-confined short concrete columns. This study not only demonstrates high predictive accuracy but also incorporates sensitivity analyses and closed-form modeling via RSM, providing both practical design tools and deeper insights into the relative influence of key structural and material parameters, thereby bridging the gap between experimental findings, AI modeling, and structural design applications.
An extensive literature search [4,5] produced 500 records which were collected from literature for compressive strength for short concrete columns with different concrete strengths, cross section shapes (square and circular), and wrapped with different FRP types, thickness. Each record contains the following data:b/bo: Size effect = Column width (or diameter) / (bo=150mm), r/b: Radius of corner round / column width (=0.5 for circular columns), d/b: Aspect ratio = Column length / column width (= 1.0 for square and circular columns), Stiff: Relative stiffness of wrapping FRP sheets (=2.t.Efpr/.b.Ec), Conf: Relative confining stress of wrapping sheets (=2.t.Ffrp/b.Fco), Fcc/Fco: Enhancement of axial capacity due to wrapping (wrapped concrete strength/unwrapped concrete strength). Where t is Thickness of wrapped FRP, Ffrp is Tensile strength of FRP, Efrp is Elastic modulus of FRP, Ec is Elastic modulus of concrete, and is Poisson ratio of concrete. The preprocessing of the collected dataset involved a careful review of all 500 records to identify and remove redundant or duplicate entries, ensuring that each data point represented a unique combination of column characteristics and FRP confinement properties. In addition, the dataset underwent shuffling to randomize the order of samples, which prevents any unintended sequential patterns from influencing the training process. These preprocessing steps were implemented to enhance the quality and performance of the machine learning models by providing a cleaner, more representative, and unbiased dataset for both the training and validation phases. The collected records were divided into training set (400 records80%) and validation set (100 records 20%) [17]. The appendix includes the complete dataset, while Table 1 summarizes their statistical characteristics. Finally, Figure 1 shows Pearson correlation matrix, histograms, and the relations between variables. It can be observed from this figure that Stiff: Relative stiffness of wrapping FRP sheets (=2.t.Efpr/.b.Ec) and Conf: Relative confining stress of wrapping sheets (=2.t.Ffrp/b.Fco) are the variables in the preliminary analysis that show strong internal consistencies of above 0.5.
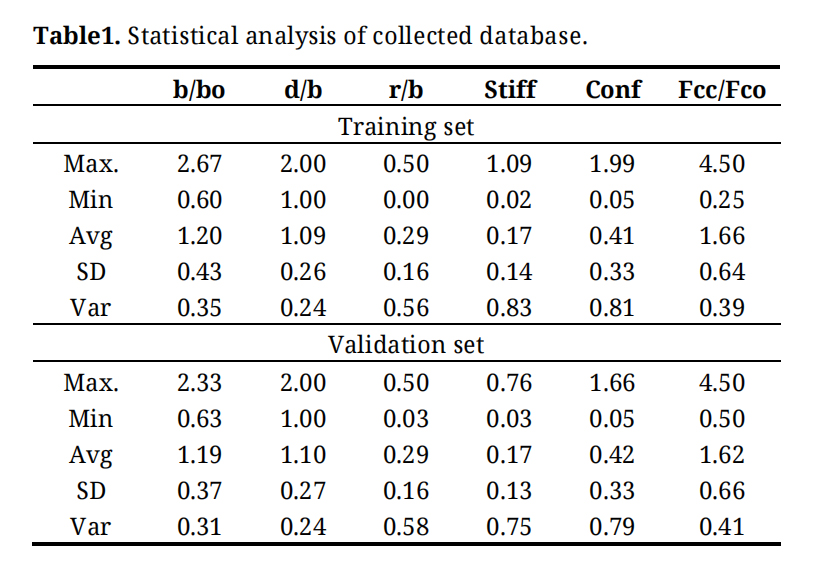 Table 1. Statistical analysis of collected database.
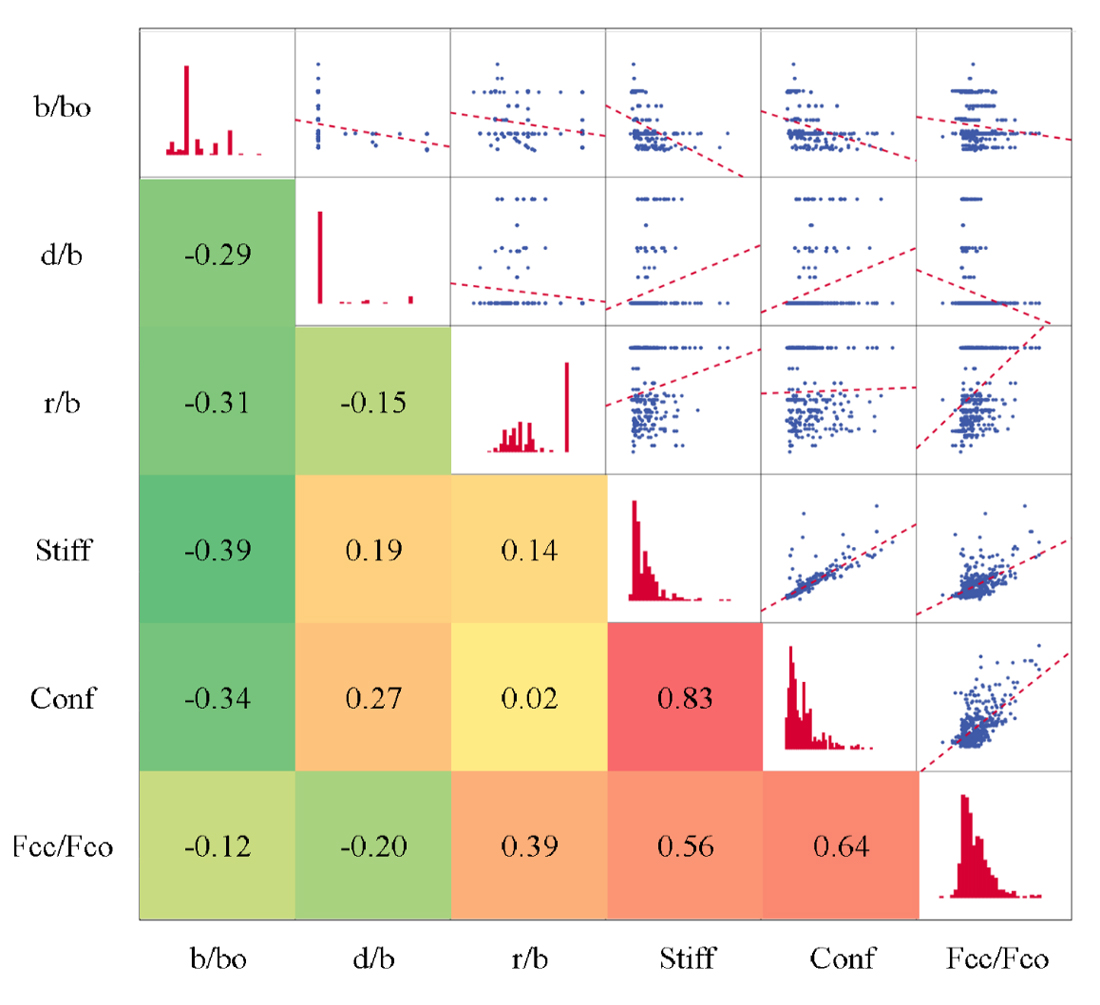 Figure 1. Correlation, Distribution and Interpreting chart.
Eight different ML classification techniques and one symbolic model were used to predict the axial capacity of short concrete columns of different shapes wrapped with FRP sheets using the collected database. These techniques are “Gradient Boosting (GB)”, “CN2 Rule Induction (CN2)”, “Naive Bayes (NB)”, “Support vector machine (SVM), “Stochastic Gradient Descent (SGD)”, “K-Nearest Neighbors (KNN)”, “Tree Decision (Tree)” and “Random Forest (RF)”. The developed models were used to predict (Fco/Fcc) considering size effect, aspect ratio, corner rounding, wrapping stress and stiffness. All the developed models were created using “Orange Data Mining” software version 3.36 [18–20]. The considered data flow diagram is shown in Figure 2. The following section discusses the results of each model. The Accuracies of developed models were evaluated by comparing sum of squared error (SSE), mean absolute error (MAE), mean squared error (MSE), root mean squared error (RMSE), Error %, Accuracy % and coefficient of determination (R2) between predicted and calculated axial capacity of short concrete columns of different shapes wrapped with FRP sheetsparameters values. The definition of each used measurement is presented in Equations (1)–(6).
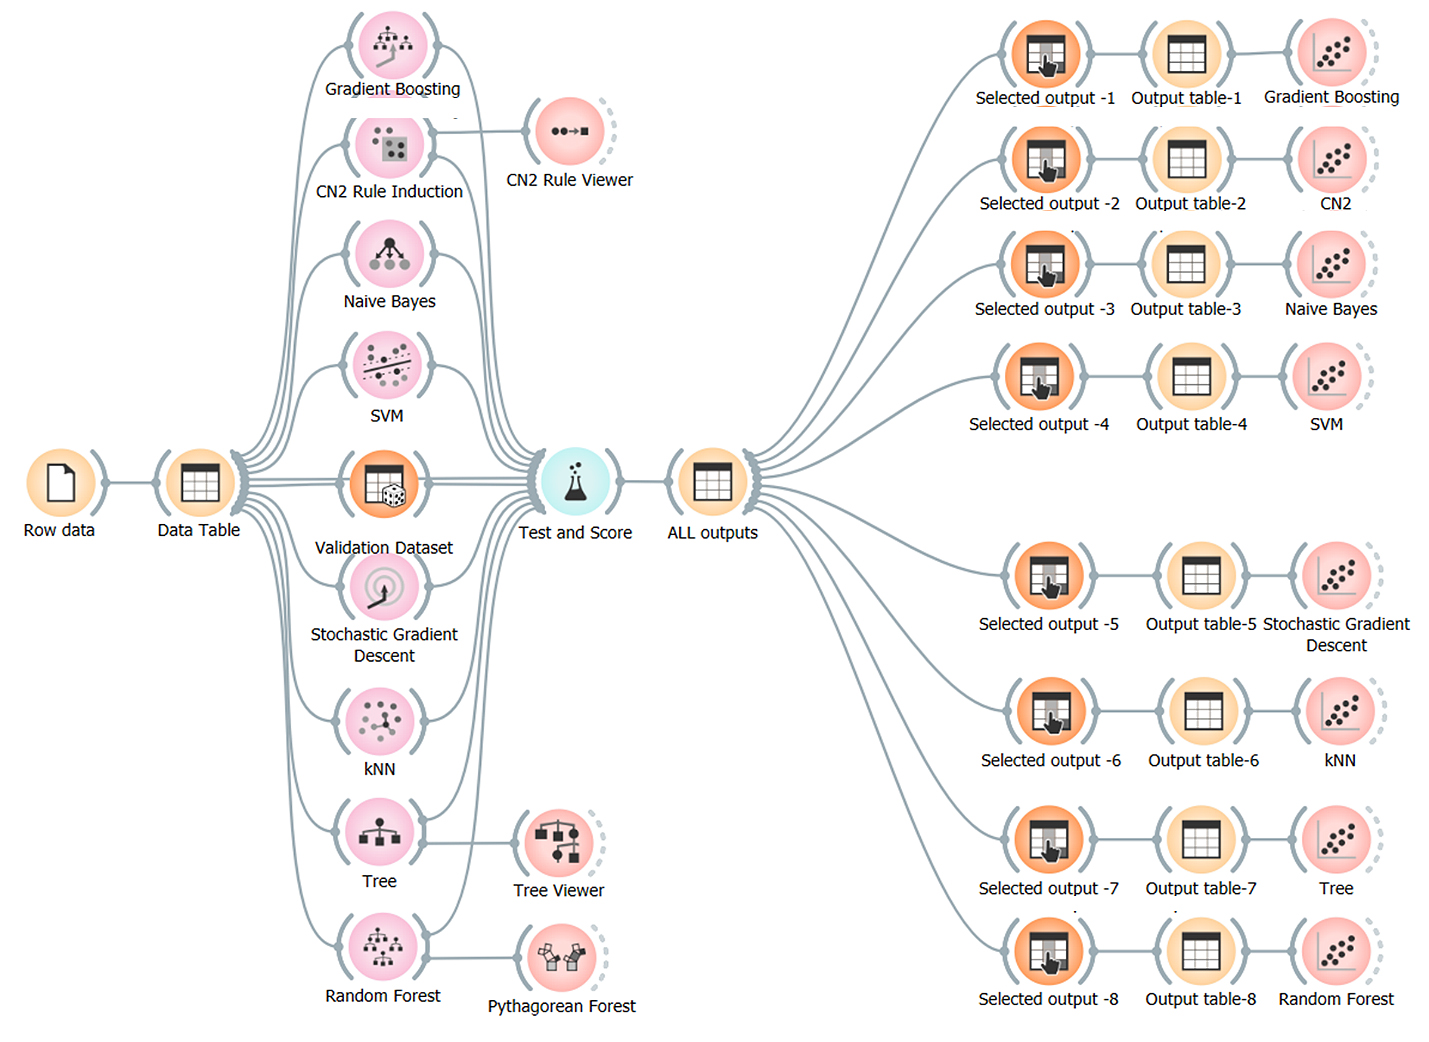 Figure 2. The considered data flow in Orange software.
Gradient Boosting (GB) is a powerful machine learning technique used for both regression and classification tasks. It works by building an ensemble of weak learners, typically decision trees, in a sequential manner. Each tree corrects the errors of the previous one by focusing on the residuals, creating a model that minimizes the overall error. Gradient Boosting variants exist such as Optimized version of GB with faster computation and additional features like handling missing data, LightGBM, focused on efficiency with large datasets and high-dimensional data and CatBoost, specializes in categorical features without requiring preprocessing. Gradient Boosting is a versatile and highly effective technique for predictive modeling. Its application in industries like construction, healthcare, and finance highlights its broad utility. When paired with domain knowledge and robust datasets, Gradient Boosting enables innovation, efficiency, and sustainability across various fields. The hyperparameters of the Gradient Boosting (GB) model play a central role in determining how effectively it captures the nonlinear relationships governing the axial load enhancement of FRP-confined concrete columns. In this context, where confinement stiffness, confining stress, geometric effects, and cross-sectional characteristics interact in complex ways, the tuning and behavior of key GB hyperparameters largely explain its high predictive accuracy. The learning rate controls the incremental contribution of each boosting stage. A moderate to low learning rate generally enables the model to build the prediction function gradually, reducing the risk of overfitting while allowing the ensemble to capture subtle nonlinearities. The strong predictive performance of GB in this study indicates that the learning rate allowed sufficient flexibility for modeling the combined effects of FRP stiffness, wrap stress, and geometric variation without destabilizing the training process. The number of estimators determines how many boosting iterations are used to refine the model. A sufficiently large number would be necessary to represent the layered effects of confinement behavior, especially given the heterogeneity across circular and square columns, varying FRP thicknesses, and different concrete strengths. The high accuracy reported suggests that the chosen number of trees allowed the GB model to learn these interactions comprehensively. If the number had been too low, the model would likely have missed higher-order dependencies; too high, and it might have begun fitting noise rather than meaningful structural behavior. Tree-related hyperparameters such as maximum depth, minimum samples split, and minimum samples leaf influence the complexity of each individual tree. A balanced depth would be needed to recognize dependencies, such as how corner rounding interacts with wrap stress or how stiffness ratios affect strength enhancement. The achieved accuracy above 90% reflects that the trees were deep enough to capture these interactions but not so deep as to compromise generalization. In problems rooted in structural mechanics, deeper trees often help identify threshold behaviors and interaction regions, and the GB model’s performance suggests that such patterns were effectively learned. Subsample ratio affects the robustness of the boosting process by introducing randomness into how samples are selected for each tree. A subsampling rate below unity reduces variance and helps avoid overfitting, especially in datasets where experimental variability is inherent. The successful validation accuracy of GB implies that the subsample configuration improved stability without diluting the predictive signal. Regularization parameters, including maximum features and any L1 or L2 constraints when used, further shape how aggressively the model fits the training data. Proper regularization would have been essential in handling highly correlated predictors such as confining stress and stiffness, allowing the model to emphasize their contribution without being dominated by redundancies. The strong performance of GB relative to several other models indicates that regularization was appropriately set to maintain generalization capability across diverse column geometries and material combinations. Overall, the hyperparameter configuration of the GB model appears to have provided an effective balance between model complexity and stability. This balance enabled the algorithm to capture the nonlinear confinement mechanics that govern the axial load enhancement of FRP-wrapped concrete columns while maintaining strong generalization across the validation dataset.
CN2 rule induction (CN2)The CN2 Rule Induction algorithm is a machine learning technique designed for classification tasks. It focuses on creating a set of interpretable and easy-to-understand rules that describe patterns within the data. Unlike black-box models, CN2 emphasizes transparency, making it ideal for domains where interpretability is critical, such as healthcare, law, and engineering. The algorithm searches for rules that distinguish between classes in the dataset. A rule takes the form:
IF (conditions) THEN (class prediction). CN2 uses a beam search strategy to explore the space of potential rules. This balances computational efficiency and the quality of discovered rules. Rules are evaluated based on metrics like entropy, accuracy, or Laplace accuracy. The best-performing rules are retained. Once a rule is generated, it is applied to the dataset, and all instances covered by the rule are removed. This process continues iteratively until all instances are classified or a stopping criterion is met. To avoid overfitting, the algorithm prunes rules by removing conditions that do not significantly improve performance. The CN2 Rule Induction algorithm offers a balance between interpretability and performance, making it a valuable tool in domains where transparency is critical. While it may not achieve the predictive power of complex models, its ability to generate clear, actionable insights ensures its continued relevance in machine learning and data-driven decision-making. The performance of the CN2 Rule Induction model in predicting the axial load enhancement of FRP-confined concrete columns is closely tied to the tuning and interaction of its key hyperparameters, which govern how rules are formed, refined, and selected. Central to CN2 is the beam width, which controls the number of candidate rule complexes retained during the search process. A larger beam width expands the search space, allowing the algorithm to explore more potential combinations of predictor variables such as confinement stress, stiffness, and geometric ratios. This can improve predictive accuracy by enabling the discovery of more nuanced rule sets, but it also increases computational cost and raises the risk of overfitting, especially when the model begins to capture noise associated with less influential variables. A narrower beam width constrains the search, promoting more generalized rules but potentially overlooking important interactions. The significance threshold plays an equally important role by determining whether a candidate rule possesses sufficient statistical strength to be accepted into the rule list. Higher significance thresholds ensure that only robust rules, strongly associated with accurate classification of Fco/Fcc enhancement, are included. This produces a cleaner and more reliable rule set but may reduce model sensitivity to subtle variations caused by secondary factors such as size and aspect ratio. Lower significance thresholds allow more rules to enter the model, which increases granularity but may also introduce instability and inconsistency in predictions. The minimum coverage parameter influences how broadly applicable each rule must be before it is considered valid. Larger coverage requirements prevent the model from generating overly specific rules that capture only small subsets of the data, thereby promoting generality and better performance on unseen samples. In contrast, low coverage settings allow the algorithm to form narrow rules that may explain rare patterns in the dataset but are unlikely to improve overall predictive accuracy. Together with the evaluation measure typically based on entropy, likelihood ratio, or weighted accuracy. These hyperparameters shape the model’s learning behavior. The evaluation measure influences how the algorithm ranks rule candidates, with measures emphasizing information gain or probability often steering CN2 toward rules that capture the dominant predictors, such as confining stress and stiffness, which the sensitivity analysis identified as decisive factors. Through the interaction of these hyperparameters, the CN2 model balances exploration of the predictor space with the need to avoid overfitting. Proper tuning ensures that the resulting rule set remains interpretable while maintaining the high accuracy observed in the study, where CN2 performed comparably to other strong learners like gradient boosting and SVM.
Naive bayes (NB)The behavior of the Naive Bayes model in predicting the axial load enhancement of FRP-confined concrete columns is shaped primarily by how its hyperparameters manage probability estimation, handle numerical features, and control the model’s sensitivity to data distribution. Since Naive Bayes relies on the assumption of feature independence, its hyperparameters influence how strictly or flexibly this assumption is applied when estimating the likelihood of each input variable, such as confinement stress, stiffness, cross-sectional ratios, and corner radius. For datasets composed mostly of continuous variables, as in this study, the Gaussian variant is commonly used, and its key hyperparameter is the variance smoothing term. This parameter regulates the stability of the estimated feature variances by adding a small constant to prevent division by zero or extremely small variances that could otherwise distort probability calculations. When variance smoothing is too small, the model becomes overly sensitive to slight fluctuations in numerical predictors, leading to unstable probability estimates and poor generalization. When it is increased, the distributions become smoother and more robust, but potentially at the cost of reduced sensitivity to meaningful distinctions between data classes. The underperformance of Naive Bayes in this study suggests that even with reasonable smoothing, the independence assumption limits its ability to capture the strong interactions among variables like confinement pressure, aspect ratio, and size effect. In multinomial or categorical variants, which are less suited to this type of dataset, the primary hyperparameter is alpha in Laplace or Lidstone smoothing. This parameter prevents zero-probability issues for rarely occurring classes or attribute levels. Although smoothing can help stabilize predictions, it cannot compensate for the model’s inability to capture nonlinear relationships or variable interactions essential in structural performance prediction. When alpha is small, the model closely follows the empirical distribution but may overfit when categories are sparse. When alpha is larger, probability estimates become more uniform, improving robustness but reducing fidelity to actual patterns. Given the physics-driven nature of FRP confinement and the nonlinear interactions among its governing variables, the simplicity of Naive Bayes limits its predictive capability, regardless of hyperparameter adjustments. Even optimal variance or Laplace smoothing cannot overcome the model’s structural assumption of independent predictors. As a result, its lower accuracy relative to models like GB, CN2, SVM, and KNN reflects both its restricted functional form and the mismatch between its probabilistic assumptions and the complexity of the FRP-confined concrete dataset. Naive Bayes (NB) is a family of probabilistic classification algorithms based on Bayes' Theorem. It assumes that features are conditionally independent given the class label, a simplification that is often untrue in practice but allows for efficient computation. Despite this "naive" assumption, NB performs surprisingly well in many real-world scenarios, especially in text classification and other high-dimensional data applications.
The foundation of Naive Bayes is Bayes' Theorem:
Where: P(C/X) is Posterior probability of class C given the feature vector X, P(C/X) is Likelihood of X given the class C, P(C) is Prior probability of class C, and P(X) is Marginal probability of the feature vector X.NB assumes that all features are independent:
Where:x1,x2,..... andxn are the individual features of X.
From Equation (8), the model predicts the class CCC with the highest posterior probability:
Naive Bayes is a simple yet powerful tool for classification, especially in text-based and high-dimensional datasets. While it makes strong independence assumptions, it often performs surprisingly well in practical applications, making it a staple in the machine learning toolkit. By balancing speed, simplicity, and effectiveness, Naive Bayes remains a reliable choice for interpretable and fast predictive modeling.
Support vector machine (SVM)Support Vector Machine (SVM) is a powerful supervised learning algorithm used for both classification and regression tasks. It excels in finding an optimal hyperplane that separates data points of different classes in a high-dimensional space. SVM is widely recognized for its effectiveness, especially in small or medium-sized datasets with clear class boundaries. Support Vector Machine (SVM) is a versatile and robust algorithm for both classification and regression tasks. It shines in high-dimensional datasets and excels at finding the optimal boundary between classes. While computationally intensive and sensitive to parameter tuning, SVM remains a go-to choice for interpretable and high-performing models in structured data analysis. The performance of the Support Vector Machine model for predicting axial load enhancement in FRP-confined concrete columns is governed largely by how its hyperparameters control margin width, kernel behavior, and the model’s sensitivity to nonlinear patterns in the predictors. Central to SVM is the regularization parameter C, which determines the trade-off between achieving a wide separating margin and minimizing classification errors. When C is small, the model prioritizes a smoother decision boundary and tolerates misclassified points, promoting generalization but potentially overlooking important nonlinear interactions among variables such as confinement stress, stiffness, and geometric ratios. When C is large, the model forces tighter fitting around the training data, capturing more complex relationships but becoming vulnerable to overfitting, especially in datasets with noise or overlapping classes. Equally influential is the kernel choice, which dictates how the input space is transformed to allow linear separation of patterns that are not linearly separable. The radial basis function (RBF) kernel is often suitable for structural mechanics datasets because it captures localized nonlinear interactions, while the linear kernel assumes a global linear relationship among variables. The polynomial kernel introduces intermediate flexibility by controlling the order of interactions. Each kernel brings its own hyperparameters, most notably gamma in the RBF kernel. Gamma determines how far the influence of a single training sample extends. When gamma is small, the decision function depends on broader patterns, yielding smoother boundaries that may not fully capture the combined effects of confinement and geometry. When gamma is large, the influence becomes more localized, enabling the model to follow intricate variations in the predictor space but risking the formation of overly complex boundaries. For polynomial kernels, the degree controls the complexity of interactions modeled: higher degrees capture richer nonlinearities but can make the solution unstable. The coefficient term in polynomial and sigmoid kernels influences how strongly interactions depend on baseline offsets. Kernel-specific scaling parameters also play a role in preventing numerical instabilities when predictors span different magnitudes. The interplay of these hyperparameters determines whether SVM can adequately represent the physical and mechanical interactions inherent to FRP confinement. Properly tuned C and gamma, combined with an appropriate kernel choice, allow SVM to capture the nonlinear coupling among confinement stress, stiffness, and cross-sectional geometry. This explains its strong performance in the study, where it achieved accuracy exceeding 90%, indicating that the optimized configuration effectively learned the structural behavior patterns embedded in the dataset.
Stochastic gradient descent (SGD)Stochastic Gradient Descent (SGD) is an optimization algorithm widely used in machine learning and deep learning for minimizing a cost function by iteratively updating model parameters. Unlike traditional gradient descent, which computes gradients using the entire dataset, SGD updates parameters using a single randomly selected data point (or a small batch), making it computationally efficient for large datasets. Stochastic Gradient Descent (SGD) is a foundational optimization algorithm in machine learning and deep learning. Its efficiency, simplicity, and scalability make it a preferred choice for large datasets. While sensitive to hyperparameters, enhancements like momentum, adaptive learning rates, and mini-batches mitigate many of its challenges. SGD remains a cornerstone in modern optimization techniques, enabling rapid model training for complex tasks. The performance of the Stochastic Gradient Descent model in predicting the axial load enhancement of FRP-confined concrete columns depends heavily on how its hyperparameters regulate learning stability, convergence behavior, and the model’s ability to approximate complex decision boundaries. The learning rate is the most critical parameter because it governs how aggressively the model updates its weights with each training sample. When the learning rate is too high, the optimization path becomes unstable and oscillatory, preventing the model from converging to a meaningful solution. When it is too low, the model converges very slowly and may become trapped in shallow minima, leading to underfitting. Variants such as constant, optimal, or adaptive learning rate schedules influence whether the model maintains a steady update pattern or adjusts to the loss landscape as training progresses. The choice of loss function also dictates how SGD responds to misclassified or poorly fitted samples. Hinge loss steers the model toward behavior similar to linear SVM, while log loss encourages probabilistic outputs. For a dataset with nonlinear interactions involving confinement stress, stiffness, and geometric features, linear loss functions restrict the model to linear decision boundaries, which contributes to its limited accuracy. Incorporating penalty terms such as L1, L2, or elastic-net regularization further shapes the optimization space. L2 regularization smooths the solution by discouraging large weights, helping prevent overfitting but limiting model expressiveness. L1 encourages sparsity, which can be beneficial for feature selection but may be too restrictive when multiple variables jointly influence the structural performance. Elastic-net blends both effects but still operates under the assumption that a linear combination of features is adequate to represent the underlying relationships. The number of iterations and stopping criteria define how long the model is allowed to refine its solution. Insufficient iterations lead to premature stopping, while excessive iterations exacerbate overfitting, especially when the data contain noise or overlapping classes. Shuffle settings determine whether the order of samples varies between epochs; shuffling typically improves convergence by reducing bias from data ordering. The epsilon parameter in some SGD variants influences the tolerance threshold for convergence and controls how aggressively the algorithm terminates optimization when improvements diminish. Overall, the underperformance of SGD in this study reflects the mismatch between its linear modeling structure and the nonlinear, interaction-dominated relationships inherent to FRP confinement mechanics. Even with well-tuned learning rates, regularization, and iteration settings, SGD remains limited by its reliance on linear separability, making it unsuitable for capturing the coupled effects of confinement pressure, stiffness, and geometric ratios. This constraint explains why its accuracy fell below 70%, in contrast to more flexible models like GB, CN2, SVM, and KNN.
K-Nearest neighbors (KNN)The K-Nearest Neighbors (KNN) algorithm is a simple yet effective supervised machine learning method used for classification and regression tasks. It is a non-parametric algorithm, meaning it makes no assumptions about the underlying data distribution, and is based on the principle of proximity predicting outcomes based on the similarity of data points.KNN is a robust, interpretable, and versatile algorithm suitable for both classification and regression tasks. Despite its simplicity, it delivers competitive results in many scenarios, especially for small datasets with well-separated classes. Addressing its computational and scaling challenges ensures effective deployment in real-world applications. The effectiveness of the K-Nearest Neighbors model in predicting the axial load enhancement of FRP-confined concrete columns depends largely on how its hyperparameters control neighborhood structure, distance evaluation, and the smoothness of decision boundaries. The most influential parameter is k, the number of neighbors considered in classification. When k is small, the model becomes highly sensitive to local fluctuations and noise in the dataset, capturing fine-scale variations in variables such as confinement stress, stiffness, and geometric ratios. This can lead to overfitting because isolated or noisy samples exert disproportionate influence. When k is large, the model produces overly smoothed decision boundaries that may overlook important nonlinear transitions, particularly those related to the interaction between FRP stiffness and column shape. Optimal performance arises when k balances local detail with global stability, allowing the model to capture nonlinear behavior without becoming erratic. The choice of distance metric further shapes how the model interprets similarity between samples. Euclidean distance is commonly used, but its effectiveness depends on proper feature scaling, since unscaled variables such as stiffness ratios or confinement stress can dominate distance computations. Alternative metrics such as Manhattan or Minkowski can alter sensitivity to feature magnitudes and outliers. The weighting scheme also significantly affects predictions. Uniform weighting treats all neighbors equally, whereas distance-based weighting assigns greater influence to closer samples. For datasets where confinement behavior exhibits gradual transitions, distance weighting helps emphasize physically similar conditions and improves classification stability. The algorithm parameter determines computational efficiency and search structure. Methods such as ball tree or KD-tree accelerate neighbor search but assume certain distributions in the feature space; their effectiveness is reduced if the dataset contains complex, high-dimensional, or irregular patterns. The leaf size setting influences the trade-off between search precision and computational cost, with smaller leaf sizes improving accuracy at the expense of speed. Feature scaling is an implicit but essential hyperparameter choice. Without normalization or standardization, features with larger numeric ranges overwhelm the distance function, distorting the importance of variables such as corner radius or size effect. Proper scaling ensures that all variables contribute proportionally to similarity assessment. Overall, the KNN model performs well because its non-parametric structure captures nonlinear interactions between confinement stress, material stiffness, and geometric characteristics without requiring explicit functional assumptions. However, its sensitivity to k, distance metrics, and feature scaling means that careful hyperparameter tuning is crucial for achieving the high accuracy observed in this study.
Tree decision (Tree)A Decision Tree is a supervised machine learning algorithm used for classification and regression tasks. It structures data into a tree-like graph of decisions and possible outcomes, making it both interpretable and flexible. The algorithm recursively splits the dataset based on feature values to minimize a defined error metric or maximize information gain. Decision Trees are powerful tools for both classification and regression tasks, offering intuitive and interpretable solutions. While prone to overfitting and instability, techniques like pruning and ensemble methods (e.g., Random Forest) can mitigate these issues, making Decision Trees invaluable in data-driven decision-making and prediction tasks. The performance of the Decision Tree model in predicting the axial load enhancement of FRP-confined concrete columns is governed by hyperparameters that regulate tree complexity, splitting behavior, and the balance between model interpretability and predictive accuracy. One of the most influential parameters is the maximum depth, which determines how many hierarchical splits the tree is allowed to form. Shallow trees tend to underfit because they cannot adequately capture the nonlinear interactions among confinement stress, stiffness, geometric properties, and material characteristics. Deep trees, however, tend to memorize the training data, producing highly irregular partitions that fail to generalize well. The depth at which the tree stabilizes therefore plays a critical role in controlling overfitting. The minimum samples required for a split and the minimum samples per leaf also shape the granularity of the decision boundaries. Smaller thresholds allow the model to create finely detailed partitions that reflect subtle variations in the dataset, such as changes in confinement effectiveness with corner rounding or stiffness increments. However, overly small thresholds produce branches that respond to noise rather than meaningful physical trends. Larger thresholds smooth the structure of the tree, reducing variance but potentially overlooking important patterns linked to FRP confinement mechanisms. The choice of splitting criterion affects how the tree decides where to partition the feature space. Gini impurity and entropy both measure the homogeneity of a node but respond differently to class distributions. Entropy is more sensitive to small changes in probability distributions, while Gini tends to produce slightly faster and often more stable splits. The criterion influences how strongly the model prioritizes variables like confining stress and stiffness, which typically dominate early splits due to their high predictive power. The maximum number of features considered at each split controls the dimensionality of the search process. Using all features at every split ensures that the tree can identify the strongest predictors at each step, often elevating confinement stress and stiffness to the top of the hierarchy. Restricting the number of features introduces randomness and can mitigate overfitting but may reduce accuracy when certain variables consistently contribute more to classification outcomes. Pruning-related hyperparameters, such as cost-complexity pruning, enable the model to remove branches that contribute little to predictive performance. This helps correct the natural tendency of trees to overfit, especially when the dataset contains overlapping or noisy samples. Proper pruning results in a more stable structure that aligns better with the underlying mechanics of FRP confinement. Overall, these hyperparameters collectively determine how well the Decision Tree model captures the nonlinear and interaction-driven behavior of FRP-wrapped short concrete columns. With appropriate tuning, the model can effectively identify dominant predictors and produce clear, interpretable decision rules, which explains its high accuracy within the study. However, without careful control of depth, splitting thresholds, and pruning, the model can easily become either too simplistic or overly specialized, highlighting the importance of balanced hyperparameter optimization.
Random forest (RF)Random Forest (RF) is an ensemble learning method for classification, regression, and other tasks. It operates by building multiple decision trees during training and outputs the average prediction for regression or the majority vote for classification. By aggregating predictions from many trees, RF improves accuracy, reduces overfitting, and increases robustness. Random Forest is a robust and versatile algorithm that performs well across a range of tasks. Its ability to reduce overfitting and handle diverse datasets makes it an essential tool for machine learning practitioners. While computationally intensive, the accuracy and stability it provides justify its usage, particularly for applications requiring strong generalization and robustness. The predictive performance of the Random Forest model for estimating the axial load enhancement of FRP-confined concrete columns depends on hyperparameters that control the ensemble structure, diversity among trees, and the balance between variance reduction and model generalization. One of the most influential hyperparameters is the number of trees in the forest, which determines the stability of the ensemble. A larger number of trees reduces variance by averaging many different decision boundaries, making the model less sensitive to noise in variables such as confinement stiffness, stress ratio, or geometric parameters. However, extremely large forests provide diminishing returns and increase computational cost without meaningful accuracy gains. The maximum depth of individual trees governs how complex each tree is permitted to become. Deep trees capture detailed nonlinear relationships and interactions between features such as corner radius or size effect, but they also risk overfitting if grown without constraints. Shallow trees generalize better but may miss critical patterns that influence the confinement efficiency of FRP wrapping. The model’s overall behavior results from the interplay between tree depth and the averaging effect of the ensemble. The number of features considered at each split is central to creating diversity within the forest. By restricting the number of candidate variables at each node, Random Forest ensures that different trees explore different subsets of the feature space. This randomness prevents dominant predictors such as confinement stress or stiffness from controlling all early splits, enabling the forest to capture complementary effects from geometric ratios or material indices. If too few features are used, the model risks underrepresenting strong predictors; if too many are included, trees may become overly similar and reduce the ensemble’s advantage. Minimum samples per split and per leaf regulate how granular each tree becomes. Smaller thresholds allow intricate partitions in regions where small variations in stiffness or geometric configuration lead to changes in behavior, but they also amplify sensitivity to noise. Larger thresholds smooth the partitions and promote generalization, though at the cost of potentially overlooking meaningful structural transitions. Bootstrap sampling, which determines whether each tree is trained on a randomly sampled subset of the data, directly affects variance and robustness. With bootstrapping enabled, individual trees are exposed to different training subsets, enhancing diversity and reducing the risk that the forest overfits specific patterns. Disabling bootstrapping makes the forest behave more like a uniform ensemble of similar trees, limiting its ability to generalize. The split criterion, typically Gini impurity or entropy, dictates how the model evaluates the quality of each split. Although both criteria function similarly, their subtle differences influence the prioritization of dominant predictors. For example, entropy may produce slightly more refined splits when differences in confinement parameters are subtle, while Gini offers computational efficiency and stable performance. Overall, the Random Forest model performs well because its hyperparameters collectively enable it to capture complex, nonlinear interactions among confinement stress, stiffness, and geometric features while mitigating overfitting through averaging and controlled randomness. The moderately lower accuracy compared to models like Gradient Boosting or CN2 reflects the challenge of fully capturing certain fine-scale transitions in FRP confinement behavior, but the model remains robust and reliable when hyperparameters are properly tuned.
Response surface methodology (RSM)Response Surface Methodology (RSM) is a statistical and mathematical technique used for modeling and analyzing problems where a response of interest is influenced by multiple variables. Its primary goal is to optimize the response by determining the relationships between the input variables and the response. RSM is widely used in experimental design, process optimization, and product development. Response Surface is a graphical representation of the relationship between the input variables (independent variables) and the response (dependent variable). RSM relies on structured experimental designs such as factorial designs, central composite designs (CCD), and Box-Behnken designs.RSM is a powerful tool for experimental optimization and understanding factor-response relationships. While it excels in situations with relatively few factors and clear functional relationships, it can be complemented with advanced machine learning methods for highly nonlinear or complex systems. Its efficiency and graphical outputs make it an invaluable method in various engineering, material science, and industrial optimization applications.
Sensitivity AnalysisThe axial capacity of concrete columns wrapped with Fiber Reinforced Polymer (FRP) sheets is a critical aspect in designing reinforced concrete structures, particularly in terms of improving their load-bearing capacity, durability, and resistance to various forms of stress. Sensitivity analysis is an essential technique used to identify how different factors (inputs) influence the axial capacity (response) of these columns. The sensitivity analysis examines the impact of various design parameters on the axial capacity of short concrete columns wrapped with FRP sheets. These columns are typically used in structural engineering to enhance the performance and longevity of existing concrete structures or to improve the load resistance capacity of new constructions. Columns can have different cross-sectional shapes (circular, square, rectangular, or other irregular shapes), which will influence the distribution of stresses and the effectiveness of the FRP wrapping. The type of FRP material (e.g., carbon, glass, or aramid fibers) affects the bonding characteristics, stiffness, strength, and overall enhancement of the concrete column. These materials differ in terms of their modulus of elasticity, tensile strength, and layer thickness. The thickness of the FRP sheets around the concrete column directly impacts the axial load resistance. Thicker wraps can offer more confinement, leading to a greater enhancement in the column's axial capacity. The bonding between the FRP sheet and the concrete surface plays a crucial role in transferring the stresses from the concrete to the FRP. Poor adhesion reduces the efficiency of the FRP wrapping. The strength of the concrete (e.g., compressive strength fc) is an important factor that affects the column's overall capacity. Higher-strength concrete generally leads to an increase in the axial capacity, particularly when enhanced by FRP wrapping. The orientation of the fibers in the FRP sheet (whether longitudinal, transverse, or a combination) will affect the confinement effectiveness and hence the axial load capacity. The dimensions of the concrete column (e.g., diameter or side length, height) significantly influence the axial load capacity. Larger columns tend to have higher axial capacity, but the effect of wrapping with FRP varies depending on the geometry. The curing process and the conditions under which the concrete sets (e.g., temperature, humidity) affect the overall performance of the concrete and can influence the axial capacity of the column wrapped with FRP. To conduct sensitivity analysis for the axial capacity of short concrete columns wrapped with FRP sheets, a mathematical or computational model (such as finite element analysis, nonlinear regression models, or machine learning-based models) can be used to evaluate the relationship between input parameters and the axial load response. A design of experiments (DOE) approach can be used to select combinations of the parameters mentioned above. A full factorial design or central composite design (CCD) might be used to systematically vary input parameters like column shape, FRP thickness, concrete strength, etc. Finite Element Analysis (FEA) can be used to simulate the behavior of concrete columns wrapped with FRP under different loading conditions. In this context, the axial capacity of the column can be determined by considering various material properties and geometrical configurations. Software such as ABAQUS or ANSYS is often used to simulate the behavior of the FRP-wrapped columns. Once the simulation or model is developed, global sensitivity analysis can be conducted using methods like variance-based methods (e.g., Sobol indices), regression-based sensitivity analysis and Monte Carlo simulations to account for uncertainty in input parameters. From the sensitivity analysis, the impact of each parameter on the axial capacity can be determined. Circular columns generally show the highest axial capacity when wrapped with FRP due to uniform stress distribution. Rectangular or square columns may exhibit different confinement effects, influencing the overall axial capacity differently depending on the aspect ratio. The type of FRP material (e.g., carbon FRP is stronger and stiffer than glass FRP) can significantly enhance the axial load capacity of the column. Thicker FRP sheets also lead to higher axial capacity as they offer better confinement to the concrete. High-strength concrete generally results in higher axial capacity, with FRP sheets providing more effective confinement. In contrast, for low-strength concrete, the FRP sheets offer less improvement in axial load resistance. The quality of bonding between the FRP sheets and the concrete is a critical factor. Any failure or delamination at the interface reduces the axial capacity enhancement provided by FRP wrapping. Proper curing conditions, especially temperature and humidity, impact the compressive strength of concrete, influencing the axial load capacity of the wrapped column. Sensitivity analysis can provide insight into the most effective combination of parameters (e.g., FRP type, thickness, and column shape) to maximize the axial capacity of short concrete columns. This can guide engineers in selecting optimal materials and designs for concrete structures. By understanding the parameters that most influence axial capacity, unnecessary over-engineering can be avoided, leading to cost-effective designs that still meet safety and performance standards. The use of FRP-wrapped concrete columns can lead to the reuse of materials and longer-lasting structures, contributing to sustainable construction practices. Sensitivity analysis provides a foundation for developing design guidelines that can be used in practice to improve the safety and performance of concrete columns in buildings and infrastructure. Sensitivity analysis of the axial capacity of short concrete columns wrapped with FRP sheets is a crucial step in optimizing column design and ensuring safe and efficient use of materials. By understanding the impact of various factors such as column shape, FRP properties, concrete strength, and curing conditions, engineers can make informed decisions about material selection, design configurations, and construction techniques, ultimately enhancing the performance and sustainability of concrete structures. A preliminary sensitivity analysis was carried out on the collected database to estimate the impact of each input on the (Y) values. “Single variable per time” technique is used to determine the “Sensitivity Index” (SI) for each input using Hoffman & Gardener [21] formula as follows:
A sensitivity index of 1.0 indicates complete sensitivity, a sensitivity index less than 0.01 indicates that the model is insensitive to changes in the parameter. Figure 3 shows the sensitivity analysis with respect to Fco/Fcc. The sensitivity analysis with respect to Fco/Fcc having 40% Conf influence, 31% Stiff influence, 18% d/b influence, 11% r/b influence and 0% b/b0 influence on the axial capacity of short concrete columns of different shapes wrapped with FRP sheets. The sensitivity analysis conducted on short concrete columns wrapped with Fiber Reinforced Polymer (FRP) sheets investigates how different factors influence the axial capacity (the load-bearing capacity) of these columns. Specifically, the sensitivity analysis looks at the ratio of Fco/Fcc, as well as other important parameters, and their impacts on axial capacity. Fco/Fcc Ratio (40% Contribution): The ratio Fco/Fcc represents the strength ratio of the concrete with and without external FRP confinement, where Fco is the axial strength of the confined concrete and Fcc is the axial strength of unconfined concrete. A 40% influence on axial capacity means that Fco/Fcc is a highly significant factor in determining the load-bearing capacity of the concrete column. This implies that a higher Fco/Fcc ratio indicates better confinement provided by the FRP wrap, leading to a larger increase in axial capacity. Thus, selecting an appropriate FRP material that enhances Fco while ensuring good bonding with the concrete is crucial for improving axial strength. This ratio is particularly important when optimizing the type of FRP wrapping (such as carbon or glass fibers) and the number of FRP layers used. Stiffness (31% Contribution): The stiffness of the concrete column (or more specifically the stiffness of the FRP wrap and its interaction with concrete) plays a vital role in determining the axial capacity. Stiffness typically refers to the column's ability to resist deformation under axial load.31% influence on the axial capacity indicates that the column's material properties (including the modulus of elasticity of both the FRP and concrete) have a substantial impact on the column's ability to withstand compressive forces. This implies that a higher stiffness of the FRP wrap leads to better confinement and more efficient load distribution, improving the column’s axial load capacity. In practice, this suggests that selecting an FRP material with high stiffness (e.g., carbon FRP) will lead to enhanced axial strength, especially in high-performance applications. d/b (18% Contribution):d/b refers to the diameter-to-length ratio or width-to-length ratio (for circular or rectangular columns, respectively), representing the column's geometric shape.18% influence indicates that the geometry of the column (its cross-sectional shape and aspect ratio) plays a significant, though slightly smaller, role in determining the axial capacity. Shorter and stiffer columns typically show higher axial capacities than slender ones. This implies that columns with a smaller d/b ratio (more compact or less slender columns) generally exhibit better performance when wrapped with FRP because the confinement effect is more evenly distributed. This also emphasizes the need for optimizing column dimensions based on the intended application. r/b (11% Contribution):r/b represents the radius-to-length or radius-to-width ratio, which is another geometric aspect affecting how forces are transferred within the column.11% influence indicates that the radius-to-length ratio also contributes to the axial capacity but to a lesser degree than Fco/Fcc and stiffness. A column with a higher radius-to-length ratio might undergo more distortion under axial load, potentially leading to reduced performance. This implies that a balanced r/b ratio is necessary for optimizing confinement efficiency and improving axial capacity. In practice, columns with more compact cross-sections or higher r/b values may benefit more from FRP wrapping.b/b0 (0% Contribution):b/b0 is the width-to-original width ratio, indicating the relative increase in the width of the column due to the FRP wrapping or the change in dimensions after confinement.0% influence suggests that this parameter has no significant impact on the axial capacity of the column, implying that, within the scope of the study, variations in the b/b0 ratio are negligible in determining the axial load-bearing capacity when FRP wraps are used. This implies that since b/b0 has no influence, this suggests that other factors (such as Fco/Fcc, stiffness, and geometry) are far more critical to the axial capacity than the column's increase in width due to the FRP application. The findings from the sensitivity analysis have direct implications for the design and strengthening of concrete structures in the field. The factors with the greatest influence, particularly Fco/Fcc (40%) and stiffness (31%), should be prioritized when selecting FRP materials and designing the wrapping system for concrete columns. In practical applications, a higher Fco/Fcc ratio can be achieved by using FRP materials with higher tensile strength, such as carbon FRP, which enhances confinement. The stiffness of the FRP material is crucial, especially in cases where the column needs to carry significant axial loads. Thus, materials with high elastic moduli should be chosen for better confinement. Column dimensions should be optimized to reduce d/b and r/b ratios, ensuring the columns are not too slender, which might hinder the confinement effect provided by the FRP wrapping. The b/b0 ratio being insignificant in the sensitivity analysis suggests that, in most practical applications, column dimensions need not be modified drastically for the sake of the FRP wrapping. The sensitivity analysis of the axial capacity of short concrete columns wrapped with FRP sheets reveals the most influential parameters affecting the strength and performance of these columns. The Fco/Fcc ratio and stiffness were found to have the highest impact, emphasizing the importance of material properties and confinement efficiency. The geometry of the column (expressed through d/b and r/b ratios) also plays a significant role, while the b/b0 ratio was found to have no noticeable impact on axial capacity. For field applications, this analysis suggests that engineers should focus on optimizing the FRP material selection, ensuring appropriate stiffness and confinement efficiency, and optimizing column geometry to maximize axial capacity. These considerations are crucial for improving the safety, durability, and cost-effectiveness of concrete structures wrapped with FRP, especially in the context of structural rehabilitation and strengthening.
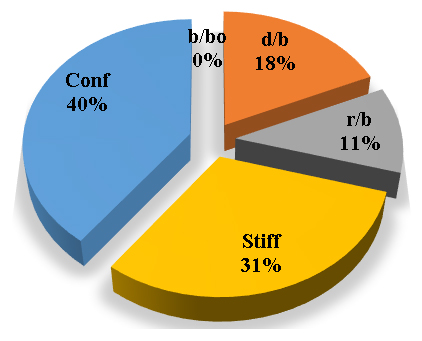 Figure 3. Sensitivity analysis with respect toFco/Fcc.
The developed (GB) model was based on (Scikit-learn) method with learning rate of 0.1and minimum splitting subset of 2. Nine trials were conducted for each model started with one tree and one tree level and increased gradually to four trees and nine tree levels. The reduction of the prediction Error (%) for each trail is presented in Figure 4. Accordingly, the models with four trees and nine tree levels are considered the optimum ones. Performance metrics of the three developed models for both training and validation dataset are listed in Table 2. The average achieved accuracy was (92%) and the R2 is 0.96. The relations between calculated and predicted values are shown in Figure 5. The analysis of a Gradient Boosting (GB) model for predicting the axial capacity of short concrete columns of different shapes wrapped with FRP sheets involves considering the design of the model and its implications for real-world application. Gradient Boosting is well-suited for capturing non-linear relationships and interactions among features, which are often present in structural engineering problems. The choice of GB suggests that the problem involves complex dependencies between input variables (e.g., column shape, material properties, FRP thickness, etc.) and axial capacity. The effectiveness of the model depends on the quality and relevance of input features, such as column geometry (circular, square, rectangular), concrete compressive strength, FRP properties (thickness, tensile strength, modulus of elasticity) and wrapping configuration.The high accuracy (92%) and R² (0.96) suggest effective feature selection or engineering, capturing most of the variability in the axial capacity.Performance metrics indicate a robust training process, likely involving hyperparameter tuning to optimize learning rates, tree depths, and boosting stages. With an average achieved accuracy of 92%, the model is reliable for predicting axial capacity in most scenarios. However, this accuracy may vary with the quality and representativeness of the input data. Any significant deviations in the field data from the training data distribution could reduce performance. The R² value of 0.96 indicates a strong correlation between predicted and actual axial capacities, suggesting the model captures the majority of the variation. This implies a high level of confidence in its predictions for design and analysis purposes. A potential limitation lies in the generalization ability of the model. If the training data doesn't adequately represent all possible shapes, materials, or boundary conditions, predictions for new scenarios may be less reliable. Practical application requires careful measurement of input features. Inaccurate data collection in the field (e.g., variability in material properties) could lead to errors in predictions. Different shapes (circular, square, rectangular) might introduce unique behavior in how FRP confinement enhances axial capacity. The model's performance across these shapes should be validated. In field applications, the GB model should complement, not replace, code-based methods. Engineers must ensure that the model's predictions align with safety factors and design codes. Test the model against field data from diverse real-world scenarios to confirm its reliability and robustness. Introduce factors of safety to account for potential prediction errors or uncertainties in field conditions. Periodically update the model with new data to improve its generalization capabilities. Develop software tools or user interfaces that simplify inputting parameters and interpreting results for practitioners. Align the model outputs with existing design codes to facilitate its adoption by structural engineers. In summary, the GB model demonstrates strong predictive performance for short FRP-wrapped concrete columns' axial capacity. While its accuracy and R² value are impressive, practical application should focus on validating the model, managing uncertainties, and ensuring its alignment with design codes for safe and effective use.
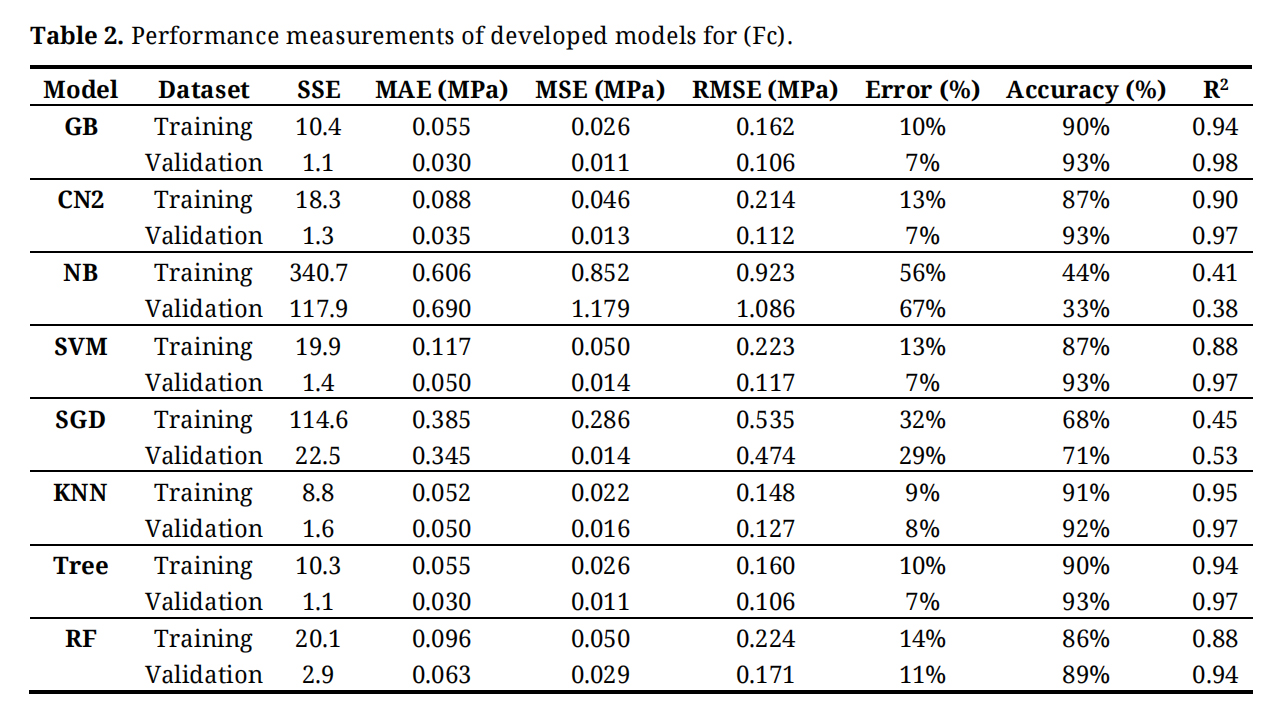 Table 2. Performance measurements of developed models for (Fc).
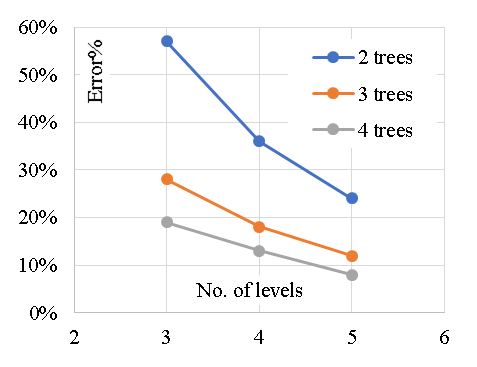 Figure 4. Reduction in Error % with increasing the number of trees and levels.
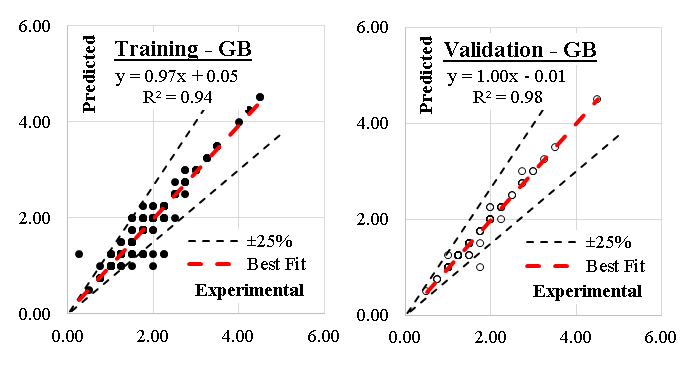 Figure 5. Relation between predicted and calculated strength using (GB).
Similarly, five (CN2) models were developed considering “Laplace accuracy” as evaluation measurement with beam width of 1.0and minimum rule coverage of 1.0. The maximum rule length was started by 2.0 and increased up to 10. Figure 6 shows the reduction in Error % with increasing the rule length. Accordingly, rule length of 10.0 is considered. The developed models contains247 “IF condition” rules, Figure.7 presents some of these rules. Performance metrics of the developed model for both training and validation dataset are listed in Table 2. The average achieved accuracy was (90%) and R2 is 0.935. The relations between calculated and predicted values are shown in Figure 8. Analyzing the CN2 rule induction algorithm for predicting the axial capacity of short concrete columns of different shapes wrapped with FRP sheets involves evaluating its design and practical implications, especially considering its average achieved accuracy (90%) and R² (0.935). The CN2 algorithm is a rule-based learning method that generates interpretable rules for classification or regression problems. Its use indicates a focus on interpretability and simplicity in capturing relationships between input features and axial capacity. Rule-based models are advantageous for understanding the impact of specific variables or conditions (e.g., column shape, FRP thickness, concrete strength) on outcomes. The success of the model depends on the representativeness and quality of the features in the dataset. Accuracy (90%) indicates reliable predictions but slightly lower than the GB model's 92%. This may be due to the CN2 model's simpler structure, which could overlook some complex interactions. R² (0.935) suggests the model captures a significant portion of the variance in axial capacity, making it a robust choice for practical use. One of the key advantages of the CN2 model is its interpretability. Engineers can easily understand the generated rules, making the model highly transparent and suitable for decision-making. A rule might state that "If column shape is circular and FRP thickness > 2 mm, then axial capacity increases by X%," which is directly actionable. The 90% accuracy suggests the model provides reliable predictions but may not be as precise as more complex models (e.g., GB). This could result in slightly conservative or less reliable predictions in edge cases. The R² value (0.935) shows strong correlation, but real-world deviations (e.g., material inconsistencies or unmodeled factors) might reduce reliability. Rule-based models can struggle with generalization if training data is limited or not comprehensive. Field conditions that deviate from the training dataset (e.g., unique column shapes or non-standard FRP properties) could lead to errors. The CN2 model's reliance on specific rules makes it sensitive to noise or inaccuracies in input data. Field application requires high-quality and consistent data collection. The simplicity of CN2 rules might limit the model's ability to capture highly complex, non-linear interactions between variables, especially for diverse shapes or configurations. Validate the model using field data across various column shapes, sizes, and FRP configurations to ensure it performs reliably in diverse scenarios. Apply safety margins to the model's predictions to account for uncertainties in field conditions and data input. Update the model regularly with new data to improve rule coverage and generalization for diverse applications. Align the model's rules with design codes and standards to ensure compliance and facilitate adoption by practitioners. Use the model as a supplementary tool alongside other methods (e.g., empirical equations, finite element models) rather than a standalone solution, particularly for high-stakes designs. The CN2 model offers greater interpretability but may underperform compared to the GB model in terms of accuracy and capturing complex interactions. Its rule-based nature makes it more intuitive for practitioners but potentially less robust for highly complex or novel scenarios. The CN2 model, with a 90% accuracy and R² of 0.935, is a reliable, interpretable tool for predicting the axial capacity of short FRP-wrapped concrete columns. Its design emphasizes simplicity and transparency, making it a good choice for scenarios where interpretability is essential. However, its practical application requires careful validation, alignment with safety standards, and supplementary use alongside other methods to ensure robustness in diverse field conditions.
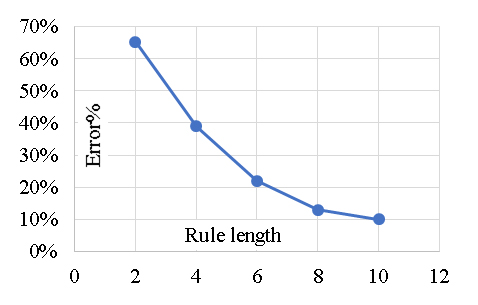 Figure 6. Reduction in Error % with increasing the rule length.
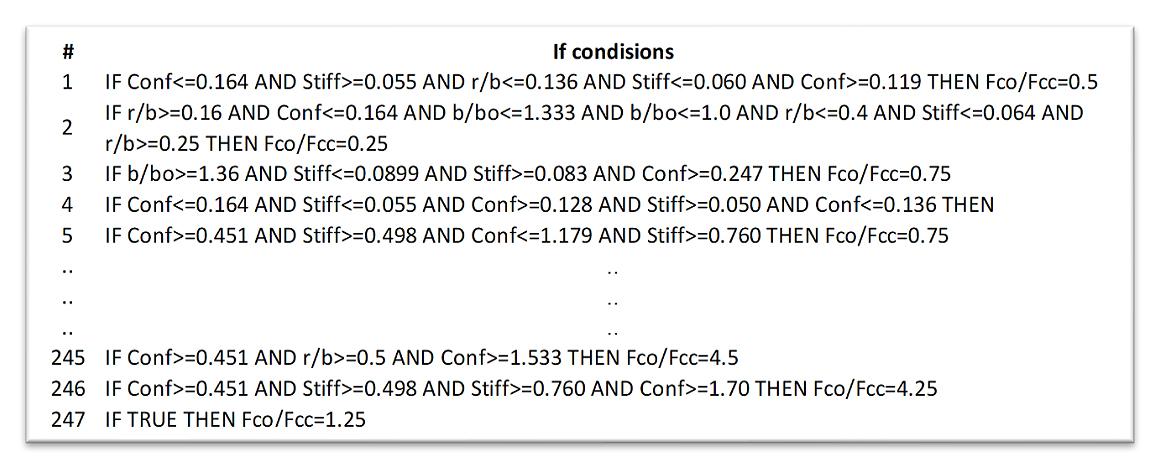 Figure 7. Sample of the developed CN2 “If condition”.
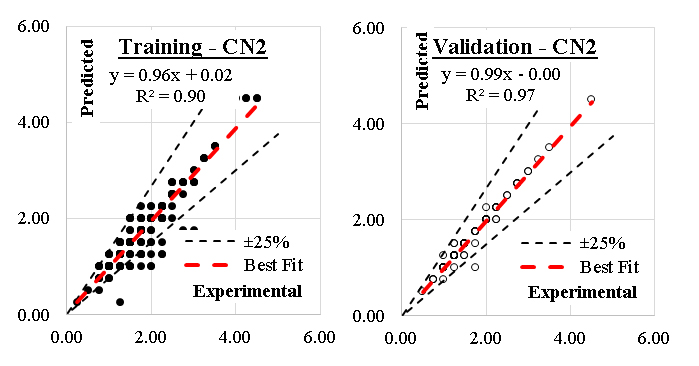 Figure 8. Relation between predicted and calculated strength using (CN2).
Traditional Naive Bayes classifier technique considering the concept of “Maximum likelihood” was used to develop the nine models. Although this type of classifier is highly scalable and are used in many applications, but it showed a very low performance as shown in Table 2. The relations between calculated and predicted values are shown in Figure 9. The achieved average accuracy was12% and R2 is 0.395. The performance of the Naive Bayes (NB) model for predicting the axial capacity of short FRP-wrapped concrete columns, with an average accuracy of 12% and R² of 0.395, is significantly subpar. Naive Bayes is typically used for classification problems and assumes strong independence between input features. Its application to this regression problem suggests an inappropriate choice of model architecture or a misalignment with the nature of the data. The independence assumption likely fails in this case, as features such as column shape, FRP thickness, and concrete strength are interdependent. Typical features (e.g., geometry, material properties, and FRP characteristics) are likely correlated, violating the NB assumption of feature independence. NB's reliance on probability distributions may lead to oversimplified predictions in a complex, nonlinear domain like axial capacity. Accuracy (12%): The model provides predictions that are only marginally better than random guesses, highlighting significant issues with its suitability for the task. R² (0.395) indicates that the model explains less than half of the variance in the axial capacity, which is inadequate for reliable predictions. With only 12% accuracy, the NB model is not reliable for predicting axial capacity. Its predictions may lead to unsafe or overly conservative designs. Users unfamiliar with the model’s limitations might incorrectly trust its outputs, leading to flawed engineering decisions. Axial capacity prediction involves nonlinear relationships and interactions among variables, which NB cannot effectively model due to its independence assumption. The low R² suggests poor generalization to unseen data. This makes the model unsuitable for field conditions, where variability is high and the data may deviate significantly from the training set. While NB models are simple and interpretable in classification tasks, their application in regression provides little insight into feature contributions, especially when predictions are inaccurate. NB is inherently unsuitable for this regression problem due to its simplistic assumptions. A model better suited to nonlinear, interactive relationships such as Gradient Boosting, Random Forests, or even Neural Networks should be employed. Conduct a detailed analysis of feature dependencies and relationships. Use models that can capture and leverage these interactions. Ensure data preprocessing and feature engineering address issues such as multicollinearity and represent all relevant structural behaviors. Models like Gradient Boosting (GB) or Support Vector Machines (SVM) with appropriate kernels could handle the complex interactions between input variables more effectively. Using a model with such poor performance in structural design could result in unsafe structures if actual axial capacities are significantly overestimated or underestimated. Deploying a model with such low accuracy might undermine confidence in computational tools among practitioners. Time and resources spent on refining or validating an inappropriate model could be better directed toward exploring more suitable alternatives. The Naive Bayes model is highly unsuitable for predicting the axial capacity of FRP-wrapped concrete columns due to its low accuracy (12%) and R² (0.395). Its poor performance highlights a fundamental mismatch between the model's assumptions and the complexity of the problem. Abandoning NB for more sophisticated regression techniques is essential for producing reliable, actionable predictions in this domain.
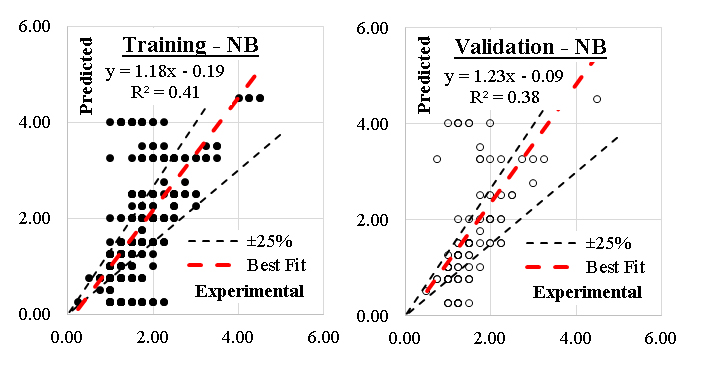 Figure 9. Relation between predicted and calculated strength using (NB).
The developed (SVM) model was based on “polynomial” kernel with cost value of 100, regression loss of 0.10 and numerical tolerance of 1.0. The kernel started with one-degree polynomial (linear) and increased up to four-degree polynomial (quartic). The reduction in the error % with increasing the polynomial degree is illustrated in Figure 10. Accordingly, (quartic) kernel is considered. Performance metrics of the three developed models for both training and validation dataset are listed in Table 2. The average achieved accuracy was 90% and R2 is 0.925. The relations between calculated and predicted values are shown in Figure 11. The Support Vector Machine (SVM) model, achieving an average accuracy of 90% and an R² of 0.925, demonstrates strong predictive capability for the axial capacity of short concrete columns wrapped with FRP sheets. SVM is a powerful algorithm for regression problems (SVR), especially for capturing non-linear relationships. It relies on mapping input data to a high-dimensional feature space using kernels (e.g., radial basis function (RBF), polynomial). The choice of SVM indicates the problem's complexity and the need for a flexible model that handles intricate relationships between features (e.g., column shape, material properties, and FRP characteristics). Accuracy (90%) indicates the model performs well across the dataset, reliably predicting axial capacity. R² (0.925) suggests the model explains most of the variance in the data, making it suitable for capturing essential patterns. Success with SVM depends heavily on the kernel type and hyperparameters (e.g., regularization parameter C, kernel coefficient γ). The high performance suggests effective tuning, potentially via cross-validation. SVM models work best with a moderate-sized dataset, as training time and memory requirements can increase with larger datasets. A well-curated dataset likely underpins the model's success. With 90% accuracy and an R² of 0.925, the SVM model is reliable for most design scenarios, providing accurate predictions of axial capacity. These metrics ensure confidence in the model for routine field use, particularly in well-defined conditions that match the training data. The non-linear capabilities of SVM allow it to model the effects of variables like column geometry, FRP wrapping, and material properties effectively. For example, the model can predict how a circular column responds to increased FRP thickness differently from a rectangular column. SVM models generalize well to unseen data when properly trained, but care must be taken to ensure that the training dataset covers the range of field conditions (e.g., column shapes, material properties, and boundary conditions). SVM can be sensitive to noisy or imbalanced datasets. Inaccurate field data, such as variability in material properties or incomplete measurements, could reduce prediction reliability. While training SVMs can be computationally intensive, especially with large datasets, prediction in field applications is typically fast, making SVM practical for real-time use. Validate the model across a wide range of field scenarios, ensuring it performs well for different column shapes, FRP configurations, and material properties. Data quality ensure accurate measurement of input parameters (e.g., FRP properties, column geometry) to maintain prediction reliability. Incorporate safety margins into the model’s predictions to account for potential variability or unseen conditions in the field. Develop user-friendly interfaces or software that integrate the SVM model, allowing engineers to input parameters and receive predictions easily. Retrain and fine-tune the model periodically with updated datasets from field tests and experiments to ensure robustness. Unlike rule-based models like CN2, SVM lacks straightforward interpretability. Engineers must rely on the model’s outputs without detailed insights into the exact relationships between inputs and outputs. While SVM performs slightly worse than Gradient Boosting (GB) in terms of R² (0.925 vs. 0.96), it offers a robust alternative with comparable accuracy and is likely less prone to overfitting with proper tuning. Compared to simpler models (e.g., Naive Bayes), SVM is far more effective for this complex, non-linear problem. The SVM model, with 90% accuracy and R² of 0.925, is a strong candidate for predicting the axial capacity of FRP-wrapped concrete columns. Its ability to model non-linear relationships makes it well-suited for this application, provided that the training data is representative of field conditions. To maximize its utility, engineers should ensure data quality, validate the model across diverse scenarios, and integrate it with practical design tools. However, its limited interpretability should be mitigated by incorporating safety factors and supplementary analyses.
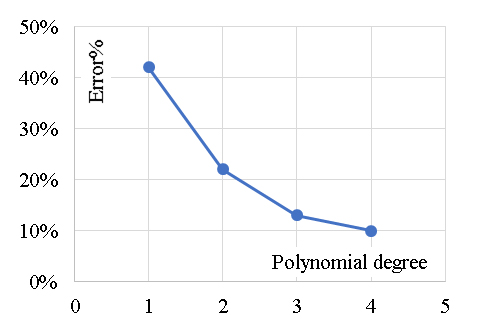 Figure 10. Reduction in Error % with increasing the polynomial degree.
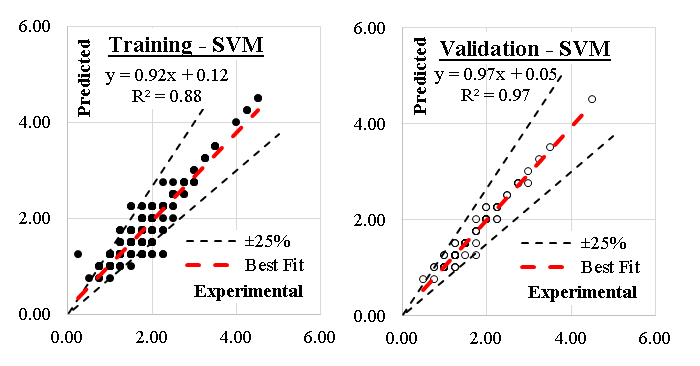 Figure 11. Relation between predicted and calculated strength using (SVM).
These three models were developed considering modified Huber classification function and “Elastic net” re-generalization technique with mixing factor of 0.01 and strength factor of 0.001. The learning rate starts with 0.01, then gradually decreased to 0.001. The reduction in error% with reducing the learning rate is presented in Figure 12. Performance metrics of the three developed models for both training and validation dataset are listed in Table 2. The average achieved accuracy was69% and R2 is 0.49. The relations between calculated and predicted values are shown in Figure 13. The Stochastic Gradient Boosting (SGB) model, achieving an average accuracy of 69% and an R² of 0.49, exhibits moderate performance in predicting the axial capacity of FRP-wrapped short concrete columns. Stochastic Gradient Boosting combines Gradient Boosting with randomization, introducing subsampling to improve generalization and reduce overfitting. However, its effectiveness heavily depends on proper parameter tuning and quality of the training data. The suboptimal performance (accuracy 69% and R² 0.49) indicates possible issues such as insufficient or non-representative training data, poorly tuned hyperparameters (e.g., learning rate, number of estimators, max depth), and high noise in the dataset or a lack of critical features. SGB typically performs well with a variety of features and can model non-linear interactions. The moderate performance suggests either the model struggled to capture complex dependencies or the features did not adequately describe the problem. Accuracy (69%), while better than random guessing, it indicates the model's predictions often deviate significantly from actual values. R² (0.49) suggests the model explains less than half of the variance in the axial capacity, making it unreliable for accurate predictions in diverse scenarios. With 69% accuracy and an R² of 0.49, the SGB model lacks sufficient precision for high-stakes structural engineering decisions. Its predictions may lead to unsafe designs if axial capacities are overestimated or to inefficiencies if they are underestimated. The low R² indicates poor generalization. In real-world field conditions, where input variables can vary widely, the model’s predictions may deviate significantly from actual behavior. The model may be sensitive to noisy or imbalanced datasets. Inconsistent or incomplete input data (e.g., variations in material properties or column geometry) can exacerbate prediction errors. The moderate performance suggests either underfitting, where the model is too simple to capture relationships, or overfitting, where the model learns noise in the training data but fails to generalize to new data. SGB models are computationally more complex than simpler algorithms like linear regression or Naive Bayes. The modest performance does not justify the additional complexity in this case. Improve the dataset by ensuring it covers a wide range of column shapes, sizes, FRP configurations, and material properties. Perform feature engineering to include critical factors that may influence axial capacity, such as boundary conditions and environmental effects. Optimize SGB parameters (e.g., learning rate, subsample ratio, number of estimators) using techniques like grid search or random search combined with cross-validation. Investigate feature importance to identify variables that contribute most to the predictions and ensure the dataset adequately captures their effects. Consider using other models like Gradient Boosting (GB), Random Forests, or Neural Networks, which might better capture the complexity of the problem. Explore ensemble methods or hybrid models that combine the strengths of SGB with other algorithms to improve predictive accuracy and generalization. Given its moderate accuracy, the SGB model should only be used as a supplementary tool alongside traditional design methods or other predictive models with higher accuracy. Introduce conservative safety factors to account for the model’s limited reliability and variability in predictions. Validate the model on field data before use in practical applications, ensuring its predictions align with observed behavior for specific cases. Engineers using the model must be aware of its limitations and avoid over-reliance on its predictions for critical design decisions. The SGB model underperforms compared to other models like SVM or Gradient Boosting (GB), which often achieve R² values above 0.9 for similar problems. The additional computational effort involved in training and deploying an SGB model does not yield sufficient accuracy to justify its use over simpler or more advanced algorithms. The SGB model, with a 69% accuracy and R² of 0.49, is moderately effective but not sufficiently reliable for predicting the axial capacity of FRP-wrapped concrete columns. Its performance suggests issues with data quality, feature representation, or model tuning. To improve its applicability, efforts should focus on better data curation, parameter optimization, and potentially exploring alternative or complementary models. For field applications, the SGB model should only play a supplementary role, with conservative safety margins and validation against empirical or experimental data.
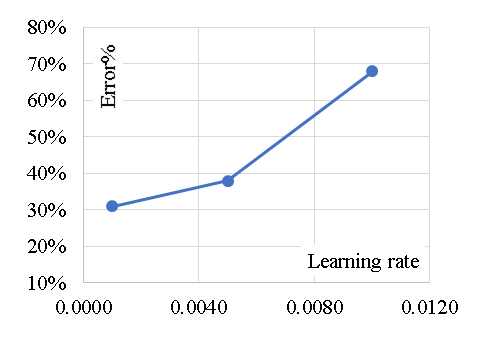 Figure 12. Reduction in Error % with reducing the learning rate.
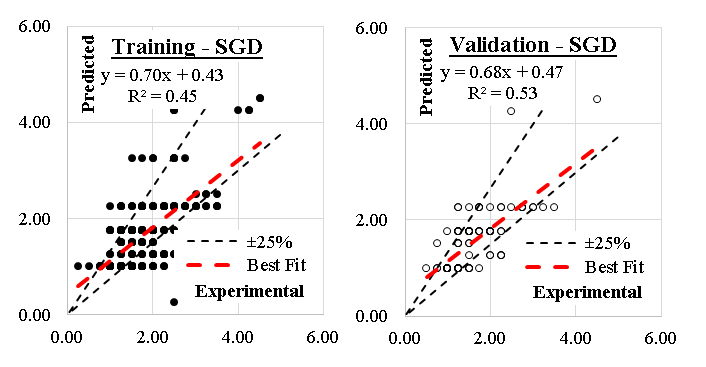 Figure 13. Relation between predicted and calculated strength using (SGD).
Considering number of neighbors of 1.0, Euclidian metric method and weights were evaluated by distances, the developed (KNN) models showed the best accuracy. (KNN) model showed the best performance where the average error% was92% and R2 is 0.96. The relations between calculated and predicted values are shown in Figure 14. The k-Nearest Neighbors (kNN) model, achieving an R² of 0.96 but producing an average error of 92%, presents an unusual performance pattern that warrants closer examination. kNN is a non-parametric, instance-based learning algorithm that predicts outcomes based on the similarity of input features to its nearest neighbors in the training dataset. Its high R² suggests it captures a strong correlation between features (e.g., column shape, FRP properties, and concrete strength) and the axial capacity. However, the extremely high error indicates significant issues in implementation, scaling, or the data's suitability for kNN. R² (0.96): Indicates the model accounts for 96% of the variance in the data, which should theoretically make it a strong predictor. Average Error (92%), highlights an inconsistency; despite high R², the absolute prediction accuracy is extremely poor. kNN can be computationally expensive for large datasets since it requires storing the entire dataset and computing distances for every prediction. This may hinder its practicality for large-scale applications. The high error percentage makes the kNN model unreliable for practical use despite its strong R². Engineers cannot depend on it to provide consistent or accurate axial capacity predictions in field conditions. kNN heavily relies on the quality, representativeness, and density of training data. Any gaps or biases in the data can significantly skew predictions. kNN is sensitive to the scale of input features. If features such as column dimensions, FRP thickness, or concrete strength are not normalized, the model may assign disproportionate importance to certain variables, leading to errors. kNN’s predictions are based on local similarities. In the case of sparse or unevenly distributed training data, the model may fail to generalize to unseen field conditions. Combine kNN with other algorithms (e.g., ensemble methods) to leverage its strengths while compensating for its weaknesses. The combination of high R² and extremely high average error makes the kNN model unreliable for field use in its current form. Rigorous testing against experimental or field data is essential to validate the model’s utility. The kNN model could serve as a supplementary tool for specific datasets or scenarios where high-quality, dense training data are available. kNN has the potential to model non-linear relationships without assuming a functional form, making it flexible for complex problems. Compared to models like Gradient Boosting or SVM, kNN is highly sensitive to data issues, scaling, and computational efficiency. Its high error undermines its utility despite the strong R². The kNN model, despite an impressive R² of 0.96, is fundamentally flawed for predicting the axial capacity of short FRP-wrapped concrete columns due to its average error of 92%. This inconsistency likely stems from issues such as poor feature scaling, inappropriate parameter choices, or data quality problems. While the model shows potential, it requires significant adjustments and rigorous validation before it can be considered for field applications. As it stands, it is unsuitable for reliable design or decision-making in structural engineering contexts.
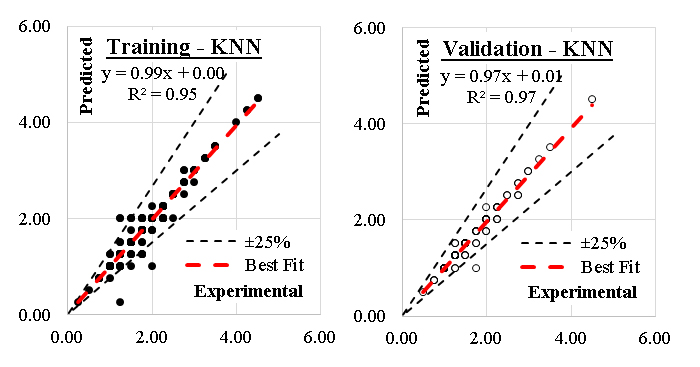 Figure 14. Relation between predicted and calculated strength using (KNN).
These five models were developed considering minimum number of instants in leaves of 2.0 and minimum split subset of 5.0. The models began with only one tree level and gradually increased to 9.0 levels. Figure 15 illustrates the reduction in Error % with increasing the number of layers. The layouts of the generated modelsare presented in Figure 16. Performance metrics of the last developed model for both training and validation dataset are listed in Table 2. The achieved accuracy was92% and R2 of 0.955. The relations between calculated and predicted values are shown in Figure 17. The Decision Tree (Tree) model, achieving 92% accuracy and an R² of 0.955, demonstrates strong predictive performance for estimating the axial capacity of short concrete columns wrapped with FRP sheets. A Decision Tree is an interpretable machine learning algorithm that uses a tree-like structure to model decision rules based on feature values (e.g., column shape, FRP thickness, material properties). Its high performance suggests effective partitioning of the input space and strong alignment between the training data and the problem's underlying relationships. Accuracy (92%) indicates the model reliably predicts axial capacity for most cases. R² (0.955) suggests the model explains 95.5% of the variance in the dataset, highlighting its capability to capture the complexity of the problem. The decision rules and thresholds are easy to understand, making the model transparent for engineering applications. Decision Trees naturally provide insights into the importance of input variables, allowing identification of the most critical factors influencing axial capacity. Trees handle non-linear relationships well, which is essential for modeling interactions between variables such as column geometry, FRP properties, and loading conditions. With high accuracy and R², the Tree model is a reliable tool for estimating the axial capacity of short FRP-wrapped concrete columns under controlled conditions. The interpretability of the model makes it accessible to engineers who may not have expertise in machine learning. It can serve as a decision-support tool to quickly estimate axial capacities without requiring advanced computation. The high R² indicates strong generalization across the dataset, but care must be taken to ensure the training data includes all relevant field scenarios (e.g., different column shapes and FRP configurations). The model's ability to identify critical variables can guide engineers to focus on key design parameters, such as the effect of FRP thickness or the influence of column cross-sectional shape. Decision Trees excel at providing discrete predictions for specific cases, such as axial capacity variations based on FRP layer count or different concrete grades. For broader applicability, consider using an ensemble of trees (e.g., Random Forest or Gradient Boosting) to improve robustness and reduce the potential for overfitting. The model's insights can help optimize the use of FRP materials, balancing strength and cost. Its interpretable nature enables use as a decision-support tool in design reviews, allowing engineers to assess the impact of different design choices quickly. With minimal computational requirements for predictions, the Tree model is well-suited for real-time or on-site estimations of axial capacity. Compared to more complex models like SVM or Neural Networks, the Tree model offers superior interpretability while maintaining comparable predictive performance (R² of 0.955 vs. typical R² > 0.9 for other high-performing models). Outperforms simple models like Naive Bayes or poorly tuned algorithms in both accuracy and usability. The Tree model, achieving 92% accuracy and R² of 0.955, is a strong candidate for predicting the axial capacity of short FRP-wrapped concrete columns. Its high reliability, interpretability, and ease of use make it well-suited for both design optimization and on-site applications. However, careful validation, data quality assurance, and the inclusion of safety factors are essential to ensure its effectiveness in diverse field conditions. For even greater robustness, ensemble methods based on Decision Trees could be explored as an enhancement to the model.
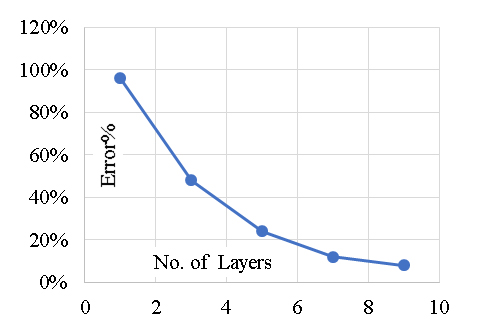 Figure 15. Reduction in Error % with increasing the No. of layers.
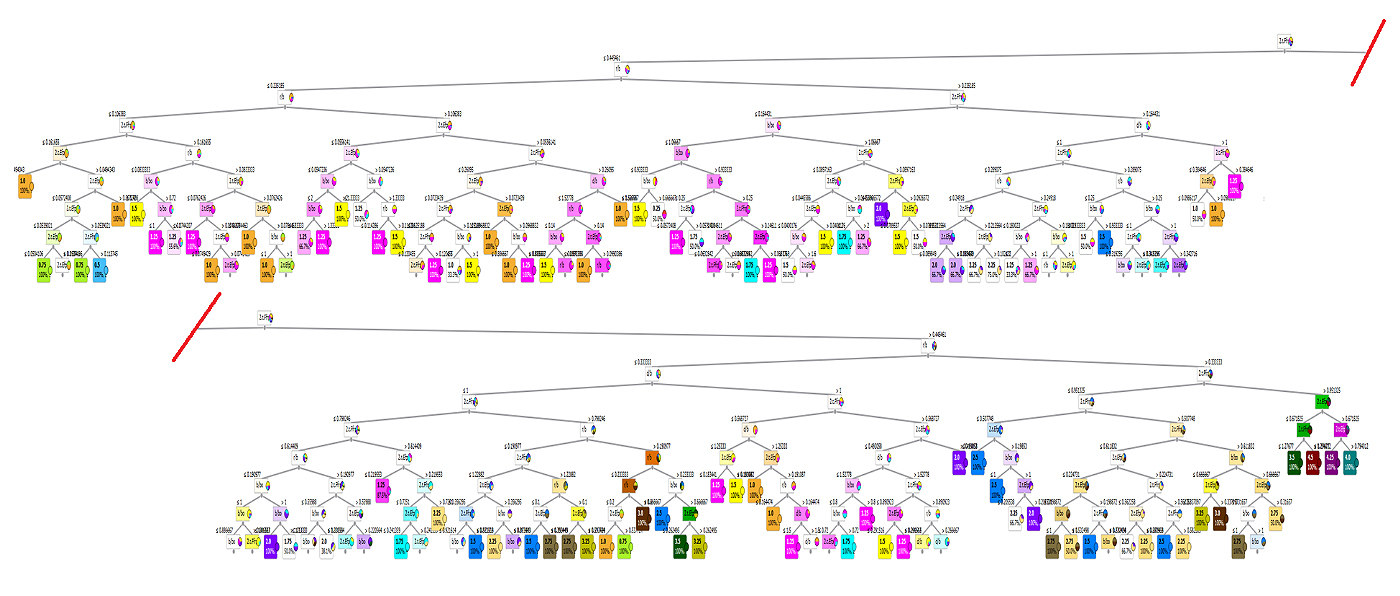 Figure 16. The layout of the developed (Tree).
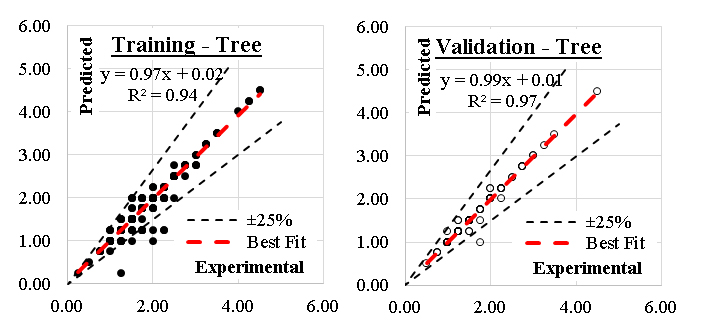 Figure 17. Relation between predicted and calculated strength using (Tree).
Finally, nine (RF) models were generated. The models began with only three trees and two level and increased up to nine trees and four levels. Figure 18 shows the reduction in Error % with increasing number of Tress and layers. Accordingly, the models with nine trees and four layers are considered. The developed modelsare graphically presented using Pythagorean Forest in Figure 19. These arrangements leaded to a good average accuracy of 88% and R2 of 0.91. The relations between calculated and predicted values are shown in Figure 20. The Random Forest (RF) model, achieving an average accuracy of 88% and an R² of 0.91, demonstrates solid predictive capabilities for estimating the axial capacity of short concrete columns wrapped with FRP sheets. Below is an analysis of its design and implications for field applications. RF is an ensemble learning method that builds multiple Decision Trees and aggregates their predictions, improving accuracy and robustness compared to a single tree. The model's high performance (88% accuracy, R² of 0.91) reflects its ability to model complex, non-linear relationships between input features (e.g., column shape, FRP thickness, and material properties) and axial capacity. Accuracy (88%) indicates reliable predictions for most cases but leaves some room for improvement. R² (0.91) suggests the model explains 91% of the variance, which is strong but slightly lower than some other advanced models. RF reduces overfitting by averaging predictions across multiple trees. RF provides insights into which input variables (e.g., FRP configuration or concrete strength) contribute most to predictions. RF works well with both numerical and categorical data and captures non-linear interactions effectively. While more interpretable than Neural Networks, RF models are less intuitive than single Decision Trees. RF requires more computational resources for training and prediction compared to simpler models, which might limit its scalability for very large datasets. With 88% accuracy and R² of 0.91, the RF model is a reliable tool for predicting axial capacity in typical scenarios. However, it may struggle with edge cases or highly unconventional column designs. The ensemble nature of RF ensures stable predictions across diverse conditions, making it suitable for varying column geometries and FRP configurations. RF's ability to generalize well reduces the risk of overfitting, ensuring reliable predictions in field conditions even with moderate variations in input data. Feature importance rankings from RF can help engineers identify and prioritize the most influential factors affecting axial capacity, aiding in both design and material selection. For large-scale applications, optimize the computational pipeline by limiting the number of trees or parallelizing training. Embed the RF model into user-friendly software or decision-support tools to facilitate its application by engineers without specialized knowledge in machine learning. The RF model can help optimize column designs by evaluating how different parameters (e.g., FRP layers, column shapes) influence axial capacity. RF predictions can complement traditional methods, providing quick and reliable capacity estimates for preliminary designs or comparative studies. With suitable computational tools, the RF model can be used for real-time predictions on-site, aiding in quick decision-making during construction or retrofitting. By identifying the most critical design variables, RF can help minimize overdesign and material waste, reducing overall costs. RF strikes a good balance between accuracy and interpretability, outperforming simpler models like kNN or Naive Bayes while being easier to understand than Neural Networks. Its robustness makes it more reliable than single Decision Trees or models prone to overfitting. RF's performance (88% accuracy, R² of 0.91) is slightly lower than other advanced models like Gradient Boosting or Support Vector Machines, which can achieve R² values exceeding 0.95. Computational complexity is higher compared to simpler models, making it less ideal for extremely large datasets or real-time applications without optimization. The Random Forest model, with 88% accuracy and an R² of 0.91, is a robust and reliable tool for predicting the axial capacity of short concrete columns wrapped with FRP sheets. Its ensemble approach ensures consistent and generalizable predictions, making it suitable for a wide range of design and field applications. However, there is room for improvement in accuracy, and validation on diverse datasets is essential to ensure field reliability. RF’s balance of performance and interpretability makes it a strong candidate for integration into engineering workflows, particularly in scenarios where computational resources and data quality are well-managed. The Taylor diagram has been presented in Figure 21 for comparing the accuracies of the developed models for (Fco/Fcc).
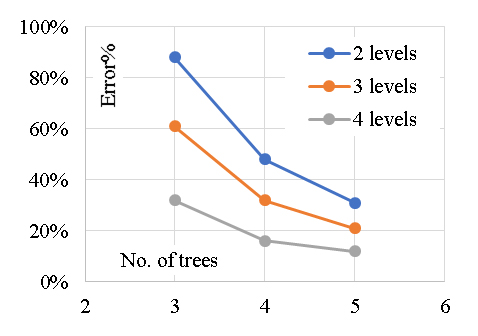 Figure 18. Reduction in Error % with increasing the No. of Tress and layers.
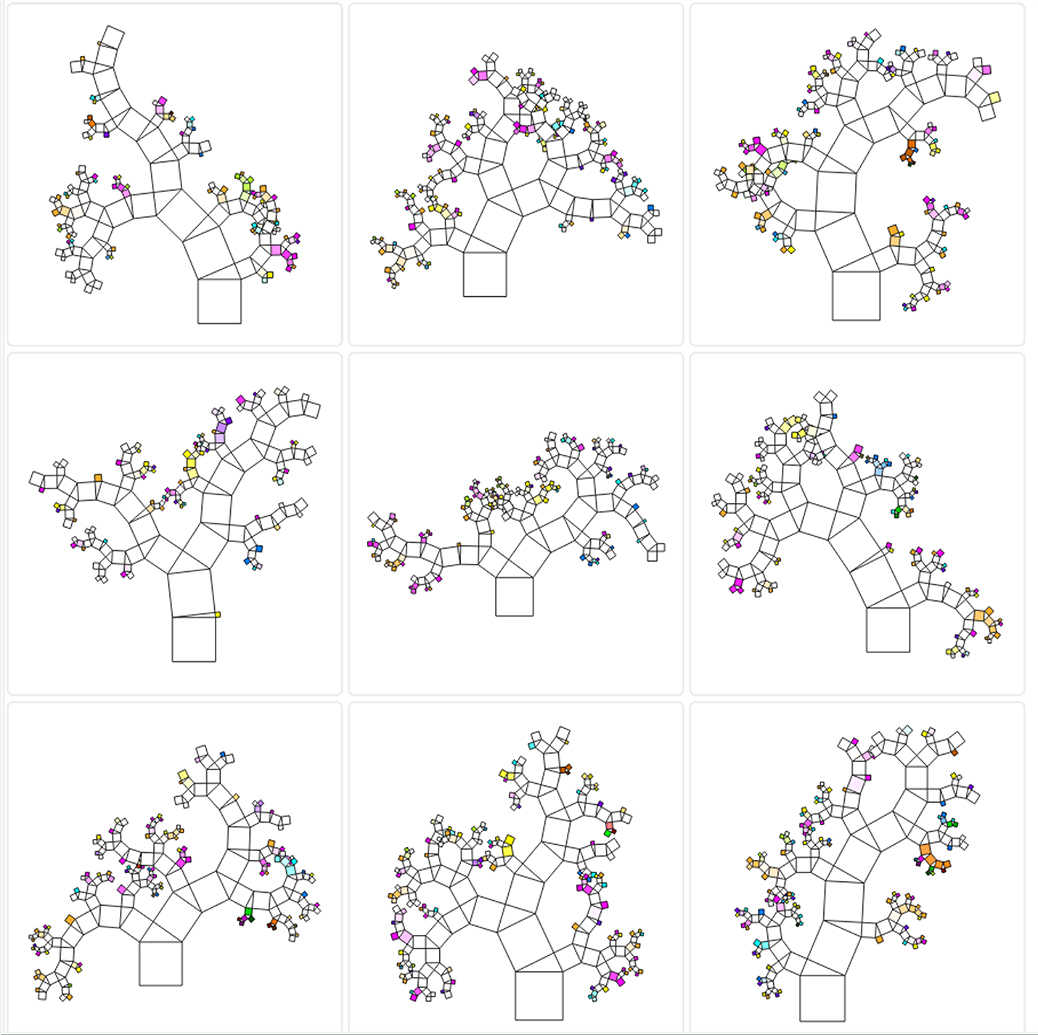 Figure 19. Pythagorean Forest diagram for the developed (RF) models.
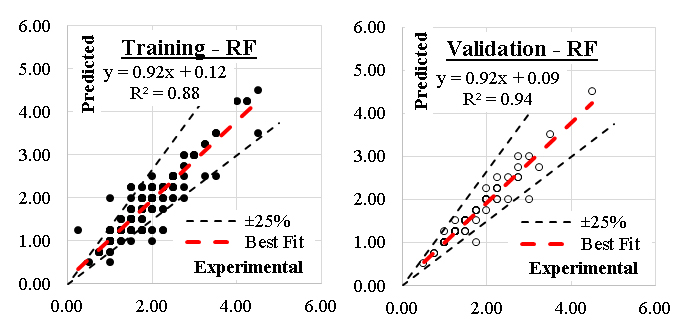 Figure 20. Relation between predicted and calculated strength using (RF).
Comparatively, Table 2 shows the summary of the performance evaluation of the models. The performance of the developed models for predicting compressive strength (Fc) was evaluated based on statistical error metrics and accuracy. The GB, Tree, and KNN models exhibited the best performance, achieving high accuracy rates above 90% and low error values. GB and Tree models both attained 90% accuracy in training and 93% in validation, with root mean square errors (RMSE) of 0.162 MPa and 0.106 MPa, respectively, indicating strong predictive reliability. KNN followed closely with 91% accuracy in training and 92% in validation, maintaining low mean absolute error (MAE) and mean squared error (MSE) values. The CN2 and SVM models demonstrated slightly lower accuracy at 87% during training but improved to 93% in validation, suggesting robust generalization capability. The RF model performed well with an accuracy of 86% in training and 89% in validation but had higher RMSE values compared to the top-performing models. In contrast, the NB and SGD models yielded the weakest results. NB exhibited poor predictive performance with 44% accuracy in training and 33% in validation, accompanied by significantly high error metrics, such as an RMSE of 0.923 MPa in training and 1.086 MPa in validation. SGD, although performing better than NB, showed only moderate prediction accuracy with 68% in training and 71% in validation, along with relatively high RMSE values of 0.535 MPa and 0.474 MPa, respectively. Overall, the GB, Tree, and KNN models proved to be the most effective, followed by CN2, SVM, and RF, which displayed strong but slightly lower performance. Meanwhile, the NB and SGD models failed to provide reliable predictions due to their high error margins and lower R² values.
Conversely, the present study's predictive models for estimating the axial compressive strength of FRP-wrapped concrete columns demonstrated strong accuracy, particularly with models such as GB, Tree, KNN, and SVM, which achieved validation accuracy above 90%. These results align with findings from previous studies, where machine learning and artificial intelligence approaches have been widely used to enhance prediction accuracy. Berradia et al. [10] employed artificial neural networks (ANNs) and standard regression analysis to model the axial loading capacity of circular concrete columns wrapped with CFRP. Their optimized ANN model showed superior accuracy compared to theoretical models, which is consistent with the high accuracy achieved by the present study's top-performing models such as GB, Tree, and KNN. Similarly, Ma et al. [11] applied the XGBoost algorithm to predict the axial capacity of CFRP-confined CFST columns, achieving an R² of 0.9719, which is comparable to the present study's best-performing models, where R² values exceeded 0.94. The use of ensemble learning in Ma et al.'s research reinforces the effectiveness of boosting techniques, as observed in the present study where GB performed exceptionally well. Onyelowe et al. [5] explored AI-based predictions of confined concrete strength using genetic programming, ANN, and evolutionary polynomial regression. Their findings highlighted the significant influence of confinement stress and fiber tensile strength, aligning with the sensitivity analysis of the current study, which identified confining stress and stiffness as the most influential factors. Prakash and Nguyen [12] integrated Extreme Gradient Boosting (XGB) with metaheuristic algorithms, ensuring high generalizability over Monte Carlo runs, while the present study demonstrated similarly strong generalization with its machine learning models, particularly GB and Tree. Xue et al. [13] employed machine learning models to predict lateral confinement coefficients, where genetic programming (GP) outperformed other techniques due to its precision and reduced error. This result resonates with the current study, where RSM provided a closed-form equation, enhancing practical applicability. Nematzadeh et al. [14] examined the eccentric compressive behavior of CFRP-strengthened concrete columns, concluding that CFRP improved strength and ductility. While their study developed an analytical model, the present study’s ML models also demonstrated high predictive performance, particularly in capturing the effects of confinement and stiffness. Baili et al. [15] investigated the structural behavior of glass-FRP reinforced concrete columns and developed an ANN model with a theoretical equation. Their findings, with minimal discrepancies from test results, align with the high prediction accuracy of the present study’s models. Similarly, Ilyas et al. [16] introduced a gene expression programming (GEP) model validated against an extensive dataset. While GEP provided a simpler mathematical relationship, the present study’s RSM model also offered a practical closed-form equation. Finally, Sayed et al. [7] reviewed machine learning models for FRP-confined concrete columns, emphasizing the effectiveness of gradient boosting and random forest, which corresponds with the strong performance of GB and RF in the present study. Overall, the present study’s machine learning models achieved accuracy levels comparable to or exceeding those reported in prior literature [20–25]. The superior performance of GB, Tree, and KNN in this study aligns with the success of ensemble learning techniques and artificial neural networks in previous research, confirming the robustness and reliability of machine learning for predicting the compressive strength of FRP-wrapped concrete columns.
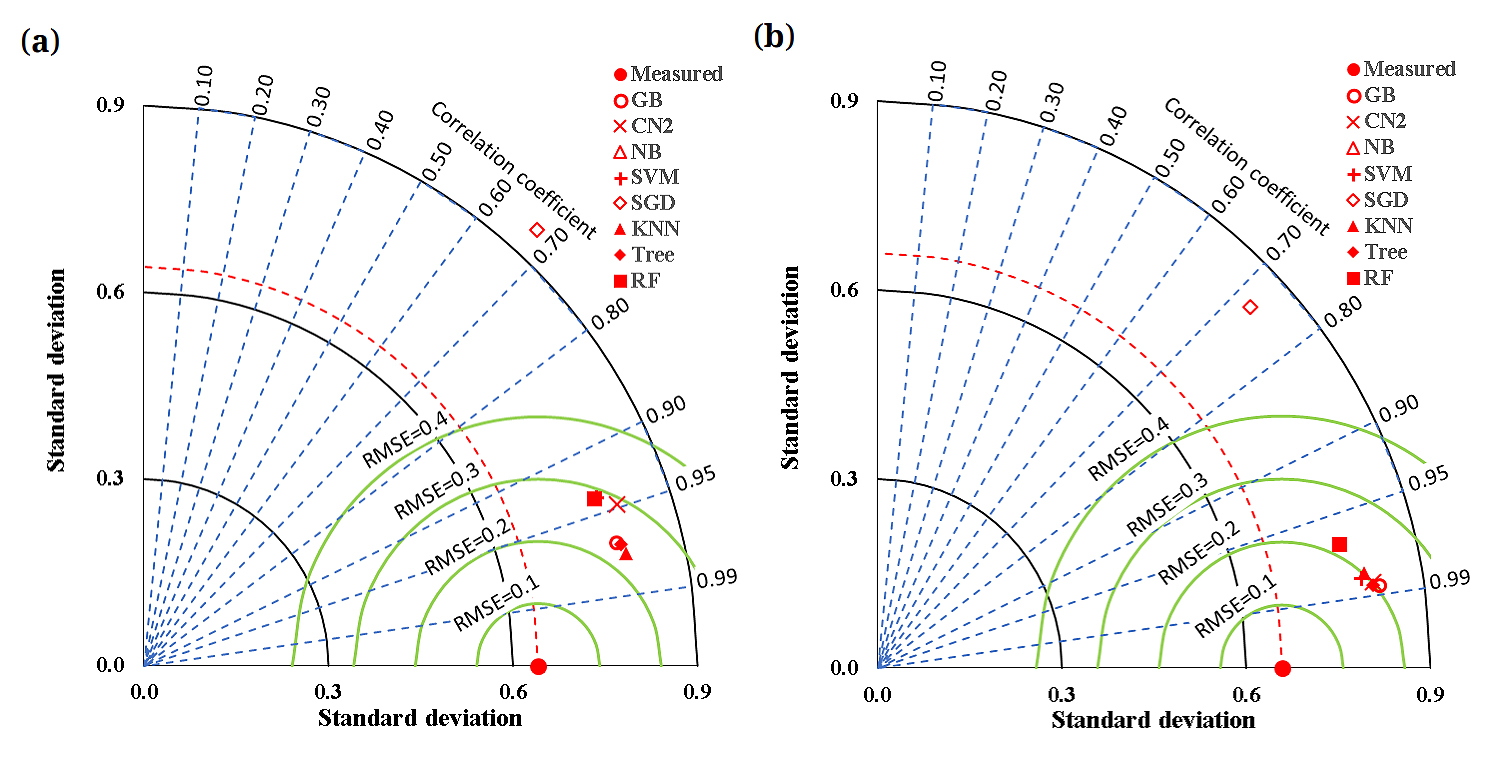 Figure 21. Comparing the accuracies of the developed models for (Fco/Fcc) using Taylor charts, (a) Training dataset, (b) Validation dataset.
The fit summary calculation was prematurely concluded based on settings in the Transform tab, where the maximum model order for process factors was limited to quadratic. The model selected on the model tab may either match the design model or be of a lower order. The model F-value of 101.97 indicates that the model is significant, with only a 0.01% chance of such a high F-value arising from noise (see Tables 3 and 4). P-values below 0.0500 identify significant model terms, which in this case include B, C, D, E, AD, BC, BD, BE, CD, CE, DE, A², B², C², D², and E². Conversely, P-values exceeding 0.1000 suggest insignificant terms. Reducing the model by removing insignificant terms (while maintaining hierarchical integrity) may enhance its performance. The Lack of Fit F-value of 3.35 suggests that the Lack of Fit is significant, with a 0.01% probability of such a result arising from noise. The predicted R² of 0.9717 aligns reasonably well with the adjusted R² of 0.9009, as the difference is below 0.2. Adequate precision, which measures the signal-to-noise ratio, has a desirable value above 4. Here, the ratio is 79.693, indicating a strong signal. Figures 22–24 have presented the model graphs for the residuals and residuals versus predicted values of the axial capacity of short concrete columns of different shapes wrapped with FRP sheets, Cook’s distance and Box-Cox plot for power transform of the axial capacity of short concrete columns of different shapes wrapped with FRP sheets model, and the 3D optimized axial capacity of short concrete columns of different shapes wrapped with FRP sheets with the two most impactful parameters and the desirability of the optimized model with respect to the variables. This model is suitable for navigating the design space. The equation (Equation (11)), expressed in terms of actual factor levels, can be used to predict responses for specified factor levels in their original units. However, it should not be used to assess the relative influence of each factor, as the coefficients are scaled to reflect the units of the factors, and the intercept is not located at the center of the design space.
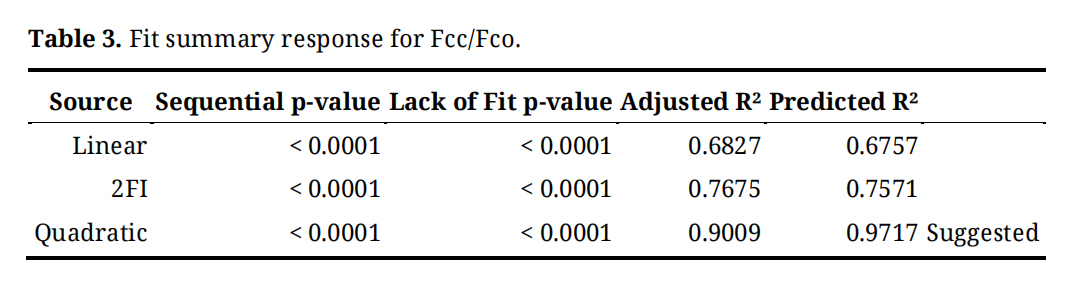 Table 3. Fit summary response for Fcc/Fco.
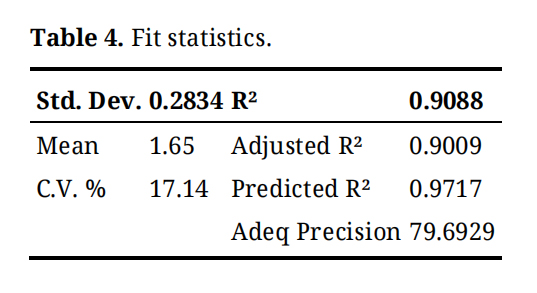 Table 4. Fit statistics.
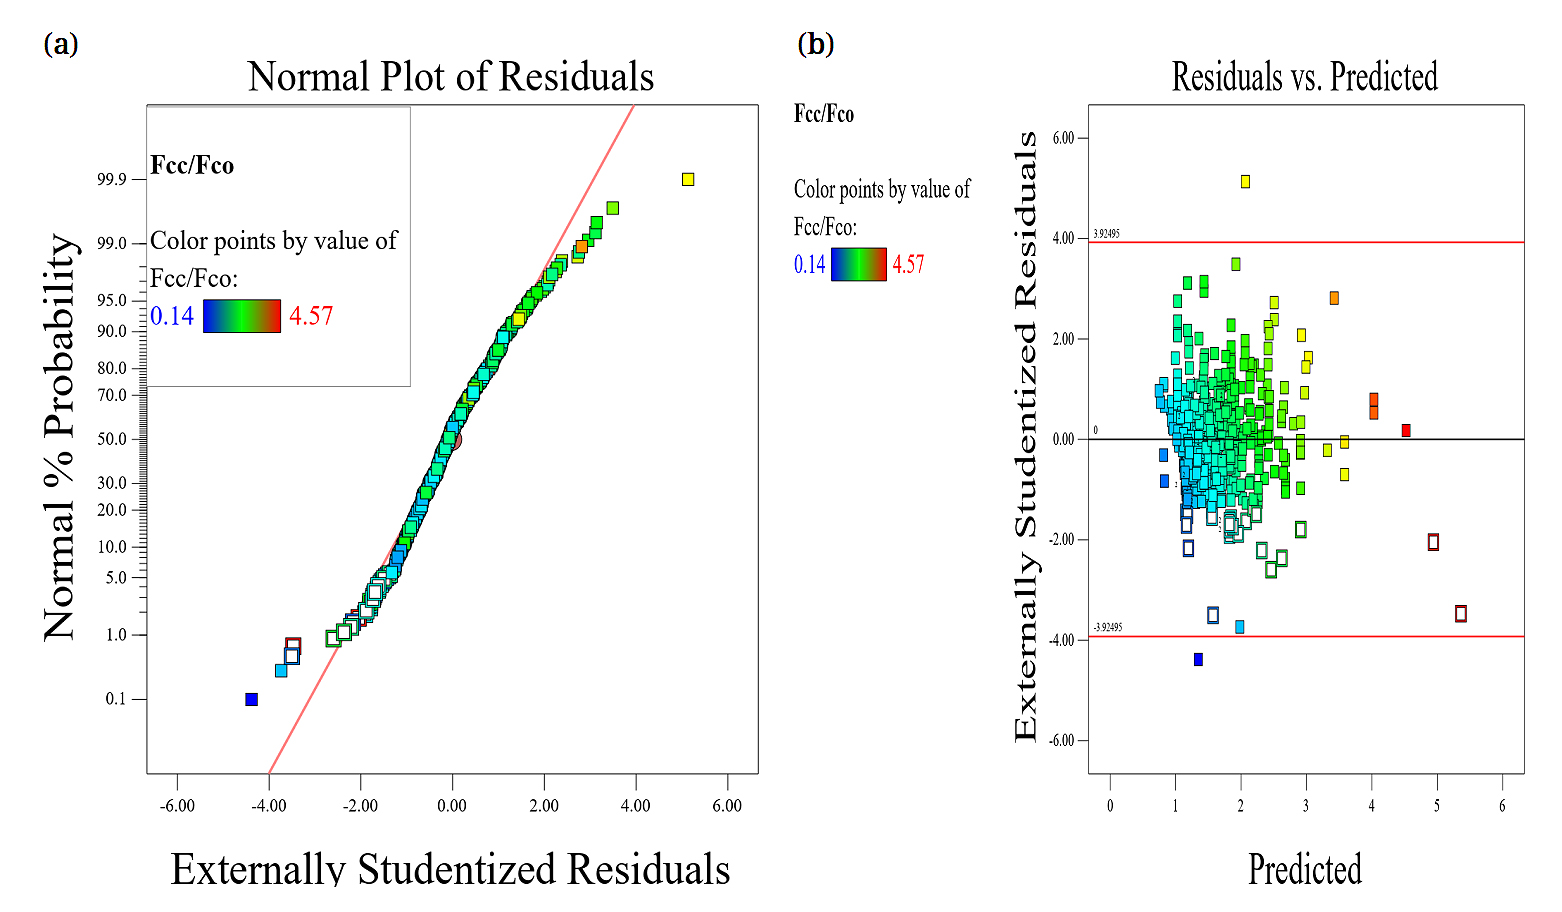 Figure 22. Plots of (a) residuals and (b) residuals versus predicted values of the axial capacity of short concrete columns of different shapes wrapped with FRP sheets.
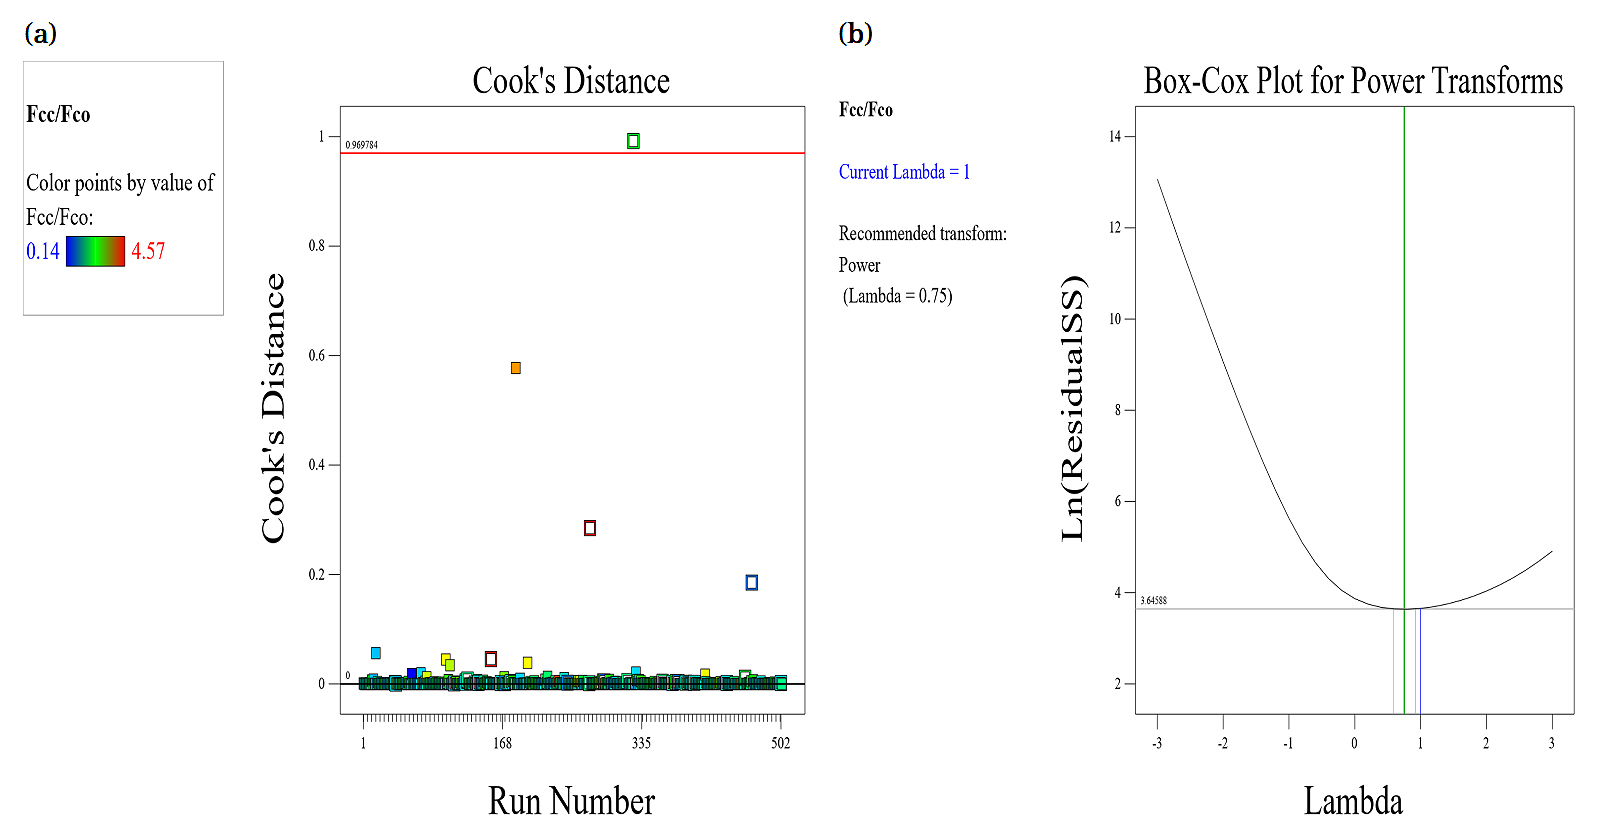 Figure 23. Plots of the (a) Cook’s distance and (b) Box-Cox plot for power transform ofthe axial capacity of short concrete columns of different shapes wrapped with FRP sheets model.
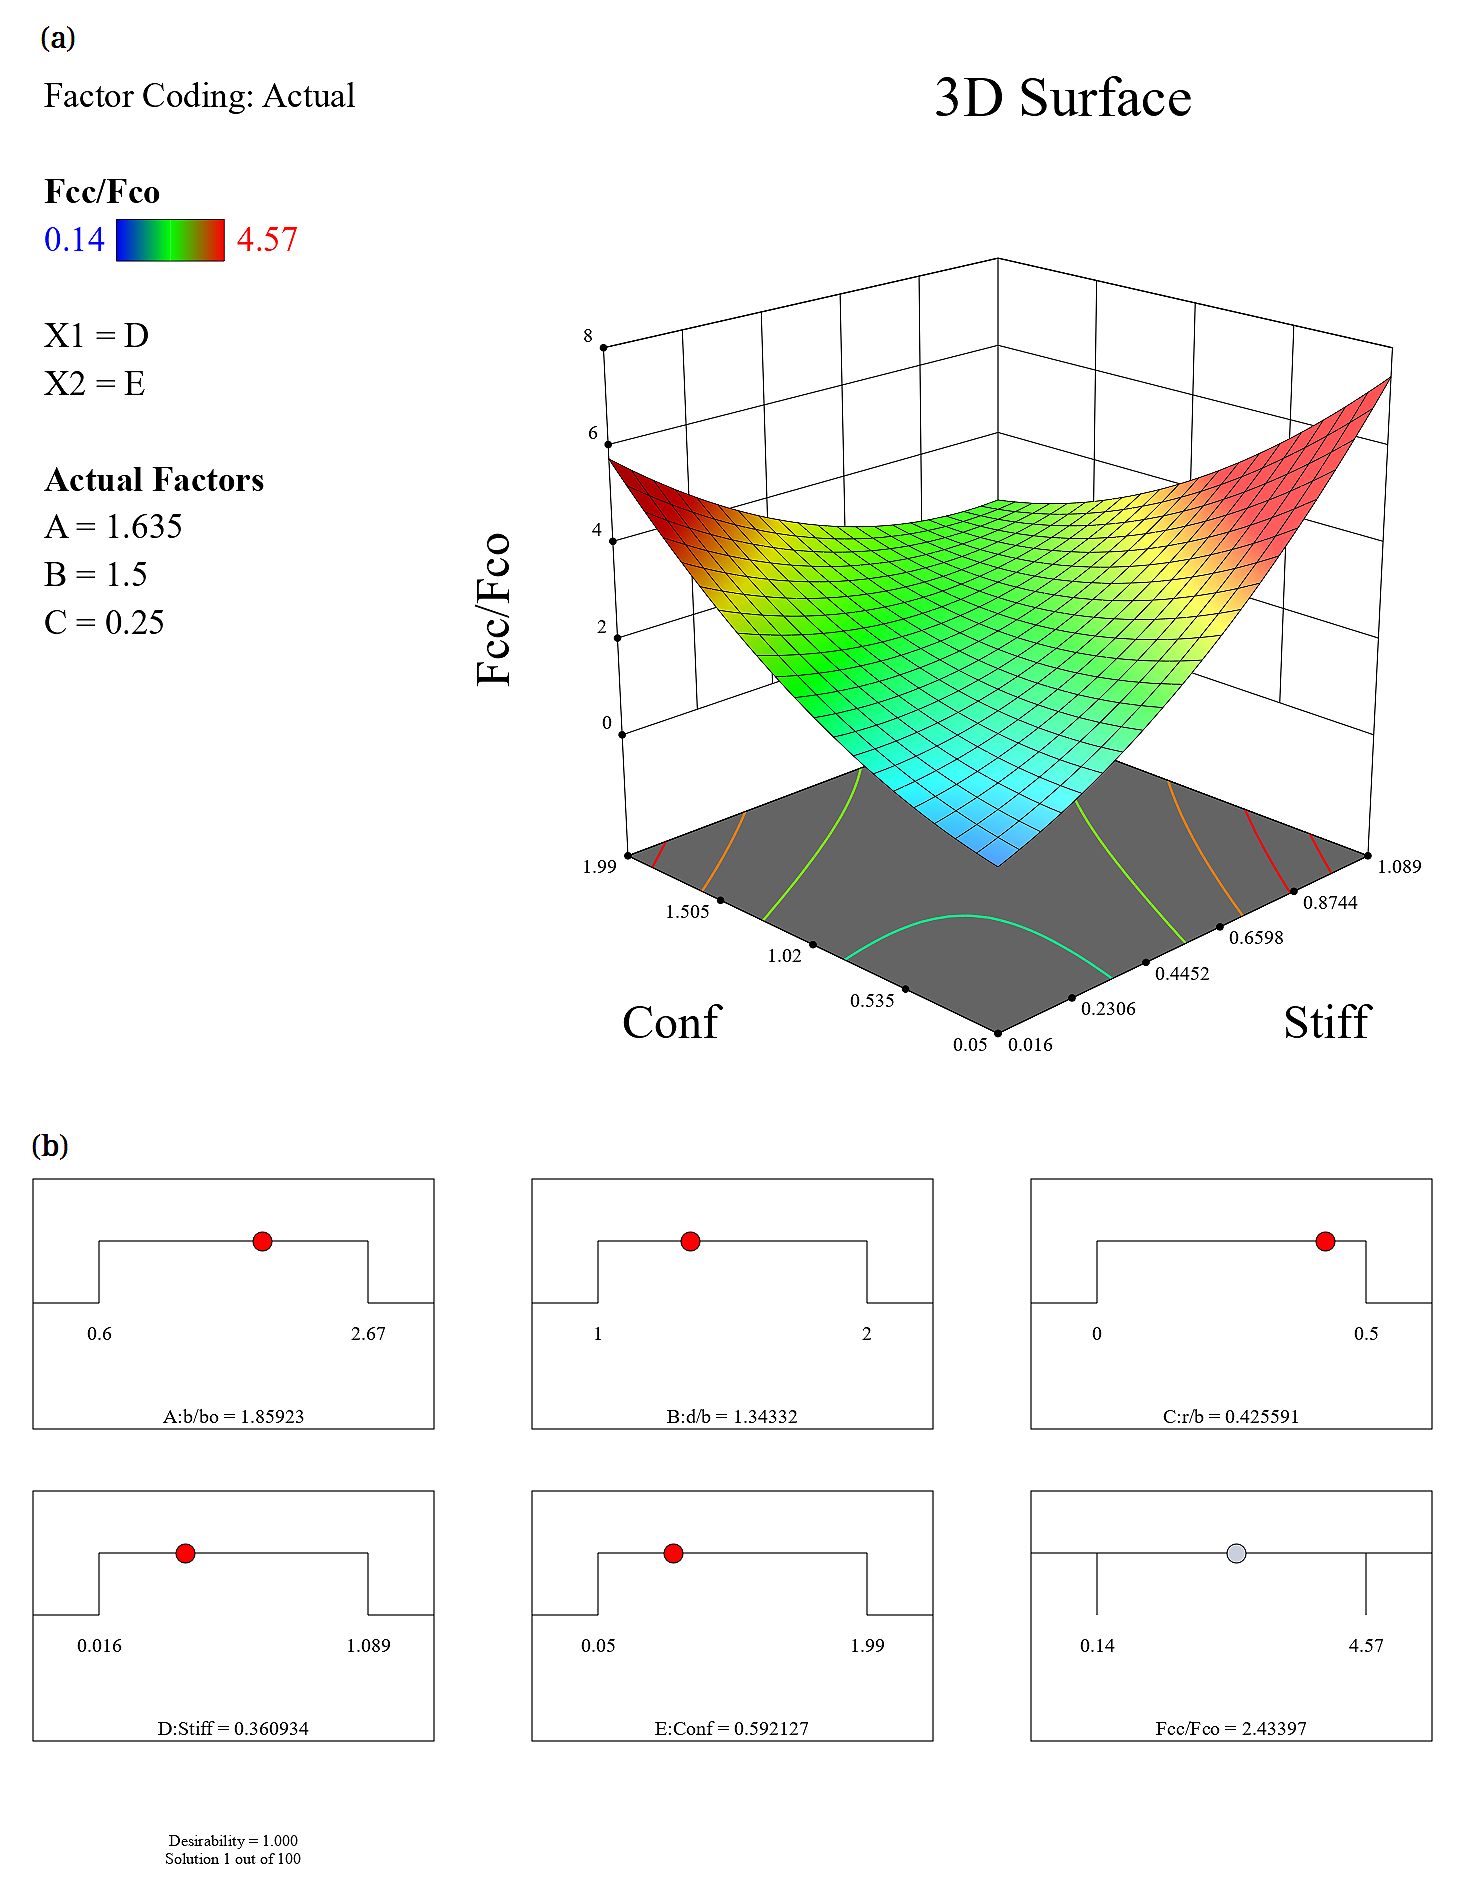 Figure 24. Plots of (a) the 3D optimized axial capacity of short concrete columns of different shapes wrapped with FRP sheets with the two most impactful parameters and (b) the desirability of the optimized model with respect to the variables.
This research presents a comparative study between eight ML classification and one symbolic model techniques namely GB, CN2, NB, SVM, SGD, KNN, Tree, RF, and RSM to estimate the enhancement in axial compressive strength of short concrete column with different cross section shape and wrapped with FRP(Fco/Fcc)considering size effect (b/bo), aspect ratio (d/b), corner rounding (r/b), wrapping stress (2.t.Ffrp/b.Fco) and wrapping stiffness (2.t.Efpr/.b.Ec).The outcomes of this study could be concluded as follows:
-
-
-
-
-
-
-
The practical application of this research lies in enhancing the structural design and assessment of FRP-wrapped concrete columns, leading to more efficient and reliable construction practices. By leveraging machine learning models to accurately predict the axial compressive strength of these columns, engineers can optimize material usage, reduce construction costs, and improve the safety and durability of infrastructure. In real-world scenarios, this research can be applied to retrofit and strengthen aging or damaged concrete structures, particularly in seismic zones where reinforced concrete columns need additional confinement to prevent catastrophic failure. The developed models can assist engineers in selecting the appropriate FRP wrapping thickness, stiffness, and shape modifications to achieve the desired load-bearing capacity. Additionally, the closed-form equation generated by the RSM model offers a user-friendly approach that allows practitioners to make quick and reliable strength estimations without requiring complex computational tools. This can be particularly beneficial for structural engineers, contractors, and policymakers involved in infrastructure rehabilitation, bridge retrofitting, and high-rise building construction. Overall, the integration of these predictive models into structural design guidelines can contribute to the development of sustainable, cost-effective, and resilient concrete structures, ultimately improving the longevity and performance of modern civil engineering projects.
The outcomes of this study have a substantial impact on the state of practice in structural engineering by providing reliable, data-driven tools for predicting the axial compressive strength of FRP-confined concrete columns, which can enhance both design efficiency and structural safety. The integration of machine learning models with sensitivity analysis enables engineers to identify the most critical factors influencing column performance, allowing for more informed decisions in material selection, geometry optimization, and FRP confinement strategies. Furthermore, the provision of a practical RSM-based closed-form equation facilitates direct application in design practice, reducing dependence on extensive experimental testing while supporting the adoption of FRP retrofitting solutions for both circular and rectangular columns. Overall, this research advances current engineering practice by combining predictive accuracy, computational efficiency, and interpretability, promoting safer, more cost-effective, and resilient reinforced concrete structures.
Recommendation for Future ResearchFuture research should focus on expanding the dataset to include a broader range of concrete strengths, FRP types, and column geometries to enhance the generalizability of the developed models. Incorporating additional machine learning techniques, such as deep learning and hybrid models, could further improve prediction accuracy and robustness. Investigating the long-term performance of FRP-wrapped concrete columns under various environmental conditions, including temperature fluctuations, moisture exposure, and freeze-thaw cycles, would provide valuable insights into their durability and aging characteristics. Experimental validation of the models with real-world structural tests would strengthen their reliability and applicability in practical engineering scenarios. Additionally, developing user-friendly software or mobile applications based on the best-performing models could facilitate real-time decision-making for engineers and designers. Integrating these predictive tools into building codes and design guidelines would ensure standardized and efficient implementation in construction projects. Further exploration of the interaction between FRP confinement and other strengthening techniques, such as internal steel reinforcement or fiber additives, could lead to more comprehensive strengthening strategies. Lastly, investigating the economic and environmental impacts of FRP wrapping in comparison to traditional reinforcement methods would support the advancement of sustainable construction practices.
The datasets supporting this research paper will be made available on reasonable request from the corresponding author.
Conceptualization, N.U., E.N and M.M.C.; methodology, N.U.; software, P.P.A.; validation, N.U., E.N. and M.M.C.; formal analysis, N.U., E.N. and P.P.A.; investigation, All authors; resources, N.U.; data curation, N.U., E.N. and M.M.C.; writing—original draft preparation, N.U., E.N., P.P.A and M.M.C.; writing—review and editing, N.U., E.N. and P.P.A.; visualization, N.U. and E.N.; supervision, N.U.; project administration, N.U. All authors have read and agreed to the published version of the manuscript.
The authors have no conflicting interests to declare in this manuscript.
None.
None.
1.
2.
3.
4.
5.
6.
7.
8.
9.
10.
11.
12.
13.
14.
15.
16.
17.
18.
19.
20.
21.
22.
23.
24.
25.
Ulloa N, Naranjo E, Arcos PP, Castillo MM. Developing a Data-Powered Framework for the Capacity of Concrete Columns Wrapped with Fiber-Reinforced Polymers. J Sustain Res. 2026;8(1):e260010. https://doi.org/10.20900/jsr20260010.

Copyright © Hapres Co., Ltd. Privacy Policy | Terms and Conditions


