Location: Home >> Detail
J Sustain Res. 2026;8(2):e260031. https://doi.org/10.20900/jsr20260031
 ,
Vesarach Aumeboonsuke 1 ,
Jiafu Su 2,*
,
Vesarach Aumeboonsuke 1 ,
Jiafu Su 2,*
1 International College, National Institute of Development Administration, Bangkok 10240, Thailand
2 International College, Krirk University, Bangkok 10220, Thailand
* Correspondence: Jiafu Su
This paper takes coverage extent of digital finance, depth of digital finance, degree of digitalization in digital finance as independent variables, green technology innovation as the mediating variable, traditional financial support as the moderating variable, and carbon emission intensity as the dependent variable. It explores the relationships among coverage extent of digital finance, depth of digital finance, degree of digitalization in digital finance and green technology innovation. The research indicates that the breadth of coverage directly reduces carbon emissions and is the most important approach. The use of depth indirectly promotes the application of green technologies, while the level of digitalization, due to the energy consumption limitations during the initial stage of technology application, has a relatively weaker impact on reducing emissions. The research results of this paper help to promote the realization of the carbon neutrality goal, empower global climate governance, regional balanced development, and corporate green transformation, and achieve sustainable win-win outcomes for the economy, environment and society.
In the global carbon emission landscape, developing countries have seen a significant rise in energy demand and carbon emissions due to rapid industrialization and urbanization [1]. Notably, China and India stand out, with China becoming the world’s largest carbon emitter. Although developed countries’ total emissions have declined, their cumulative historical emissions remain high, presenting a structural challenge. International climate governance frameworks like the Paris Agreement and the UNFCCC require countries to set carbon peak and neutrality targets. Under this framework, China demonstrates proactive leadership by committing to peak carbon emissions by 2030 and achieve carbon neutrality by 2060, showcasing its firm resolve and crucial role in global emission reduction. Carbon emission intensity [2], as a core indicator of reduction efficiency, serves as an important basis for policy formulation, progress assessment, and outcome verification in China, providing a key reference for global goals. Meanwhile, the rise of digital finance opens new pathways for optimizing carbon intensity [3], extending its influence beyond the technical and economic realm into social sustainability. Through theoretical modeling, empirical analysis, and interdisciplinary research, the precise mechanisms by which digital finance affects carbon intensity can be further revealed. Driven by the information technology revolution, digitalization is reshaping global economic activities. Reports from the International Monetary Fund and the World Bank indicate that fintech, through mobile payments, big data, blockchain and artificial intelligence, has enhanced the efficiency of capital flows, while addressing the inefficiencies, information asymmetry and improper resource allocation issues prevalent in traditional finance [4,5]. In the process of globalization, the resource allocation function of China’s financial development and the innovation ability of human capital are working together, profoundly shaping the adaptation pattern of renewable energy and significantly optimizing its positive impact on environmental quality. Within the 2030 Sustainable Development Agenda [6], goals such as climate action, clean energy, and responsible consumption require substantial financial support and efficient resource allocation. Digital finance promotes sustainable development across multiple dimensions, serving as a key link between economic growth and environmental sustainability.
Therefore, this study integrates sustainable development theory with carbon emission trading theory to construct a comprehensive analytical framework. It examines how the coverage breadth, usage depth, and digitization level of digital finance influence green technology and, consequently, carbon emission intensity. The research also explores the moderating role of traditional financial support on these three key dimensions, while revealing the dynamic interrelationships among them. This integrated framework enhances our understanding of the mechanisms affecting carbon emission intensity within a digital finance context, providing both robust theoretical support and practical insights for guiding enterprises toward sustainable development. This study has constructed a comprehensive quantitative framework, which not only examines the overall level of digital finance but also analyzes its three key dimensions: the breadth of coverage, the depth of usage, and the degree of digitization. Compared with previous studies that only measured digital finance from a single or a few dimensions, this framework significantly enriches the measurement system of digital finance. By constructing a strict model of digital finance and carbon emission intensity, it clearly demonstrates the complex influence mechanism of various factors of digital finance on carbon emission intensity. This provides a new quantitative research paradigm and ideas for subsequent related studies, fills the gap in multi-dimensional quantitative analysis and model construction of digital finance, and effectively promotes the refined development of interdisciplinary research in the field of digital finance and the environment.
The subsequent research in this paper will be carried out in order: Section (Literature Review and Hypotheses Development) will comprehensively review the existing literature and propose a hypothesis model based on this to explore the potential relationship between the variables; Section (Research Methods) will introduce the research methods in detail, including data collection sources, measurement methods of variables, etc., to ensure the scientific and accurate research; In Section (Result Analysis), detailed results of data analysis will be presented to verify the validity of the hypothetical model. Finally, Section (Conclusion) will summarize the research findings, based on the insights of the data analysis, propose targeted strategies to guide practice and advance the development of related fields.
Digital finance improves resource allocation efficiency, lowers financial access barriers, alleviates financing constraints, and expands financial services to underserved regions through digital technologies, thereby promoting financial inclusion and broadening service coverage [7]. By overcoming spatial and temporal constraints, digital finance enables firms to obtain and process market information more efficiently, reduces transaction and information costs, and enhances operational efficiency, which can contribute to lower carbon emissions [8]. Moreover, improved access to financial resources allows firms to upgrade industrial structures and invest in technological innovation, further facilitating carbon reduction.
Coverage breadth refers to the expansion of financial services to previously underserved groups, and it embodies the inclusive nature of digital finance. By broadening market participation, it mobilizes funds from a larger investor base and channels them toward green and low-carbon industries, facilitating industrial upgrading and reducing carbon emission intensity [9]. It can also alleviate credit constraints faced by private enterprises, supporting investment in cleaner technologies. However, expanded coverage may simultaneously stimulate higher household consumption and accelerate economic scale expansion, which can increase energy demand and offset part of the emission reduction effects [10].
Usage depth reflects the extent to which users utilize diverse digital financial services, including credit, insurance, and investment. Greater usage depth accelerates capital circulation and promotes new financial service models. This can stimulate production expansion and consumption growth, thereby increasing energy demand and carbon emissions [11]. However, as usage deepens further, improved access to financing enables firms to alleviate funding constraints and invest more in green technology R&D, contributing to emission reduction [12].
The degree of digitalization reflects the mobility and convenience of digital financial services. Higher digitalization accelerates capital circulation, lowers transaction costs, and improves resource allocation efficiency, thereby reducing factor misallocation and resource waste [13]. By leveraging technologies such as big data, cloud computing and blockchain, digital finance has enhanced the efficiency of financial services and the utilization efficiency of funds. It guides funds towards high-value and green projects, alleviates financing difficulties, and promotes the innovation of low-carbon technologies and production transformation [14].
Based on this, the following hypotheses are proposed:
H1: Digital finance is negatively correlated with carbon emission intensity.
H1a: Coverage extent of digital finance is negatively correlated with carbon emission intensity.
H1b: Depth of digital finance is negatively correlated with carbon emission intensity.
H1c: Degree of digitalization in digital finance is negatively correlated with carbon emission intensity.
Mediating Effects of Green Technology InnovationGreen Technology Innovation (GTI) refers to the development and application of environmental protection technologies. It plays a significant role in reducing the carbon emission intensity (CEI). By advancing clean energy and energy-efficient solutions, GTI lowers emissions in production processes [15]. Moreover, green technology innovation generates economy-wide spillover effects as technological improvements diffuse across sectors, enabling broader adoption of low-emission alternatives [16]. This diffusion is reinforced by supportive policies and incentives that encourage firms to invest in green R&D and implement cleaner technologies [17]. As a result, GTI not only reduces the carbon footprint of innovating firms but also drives systemic emission reductions across supply chains and related industries [18].
Carbon emission efficiency is a key indicator for evaluating progress toward emission reduction targets [19]. However, the relationship between green technology innovation and carbon emission efficiency remains insufficiently explored, particularly regarding its transmission mechanisms. Existing studies suggest that economic development and urbanization act as intermediaries linking green technological progress to improvements in carbon efficiency, while financial development can moderate this relationship by influencing how effectively innovation translates into environmental performance [20,21]. These findings provide a theoretical basis for designing policies that support carbon neutrality goals [22].
Financial digitalization fosters economic advancement and significantly contributes to energy saving and pollution reduction. Digital finance development can diminish carbon emission intensity (CEI) by approximately 0.14% [23]. Moreover, digital finance influences CEI via production technology innovation (PTI) and green technology innovation (GTI). PTI exerts a beneficial influence on CEI, whereas GTI imposes a detrimental effect on CEI. Furthermore, a chain mediation effect exists between PTI and GTI along the baseline path. The influence of digital finance on CEI exhibits significant regional variability [23].
Carbon emission efficiency is an important indicator for evaluating emission reduction performance and sustainable economic development [24]. It is strongly influenced by green technological innovation, while digital finance enhances this effect by improving information availability and strengthening financial support for green innovation [25]. Moreover, the interaction between digital finance and green technology innovation improves local carbon efficiency but may generate competitive or crowding-out effects on surrounding regions. These findings suggest that coordinated development of digital finance and green innovation is essential for improving carbon efficiency and supporting long-term emission reduction strategies [26].
Based on the above content, the following hypotheses are proposed:
H2: Green technology innovation mediates between Digital finance and carbon emission intensity.
H2a: Green technology innovation mediates between coverage extent of digital finance and carbon emission intensity.
H2b: Green technology innovation plays a mediating role in depth of digital finance and carbon emission intensity.
H2c: Green technology innovation plays a mediating role in digital finance, degree of digitalization in digital finance and carbon emission intensity.
Moderating Effects of Traditional Financial SupportAgainst the backdrop of the global community’s active response to climate change and the strong promotion of sustainable development, traditional financial support plays an increasingly crucial role in the field of green projects [27]. Traditional financial institutions, particularly commercial banks, have increased credit investment in green projects. For instance, banks provide dedicated loans for clean energy projects, including wind and solar power, covering pre-construction, equipment procurement, and post-operation maintenance [28]. In some regions, low-interest loans support green agricultural initiatives, enabling enterprises and farmers to adopt environmentally friendly production technologies and reduce non-point source pollution. These green credits supply essential capital and guide social investment toward the green sector.
Beyond direct lending, traditional financial institutions actively participate in the green bond market. Acting as underwriters, they assist green enterprises in issuing bonds, thereby broadening financing channels and pooling capital from multiple investors to provide long-term, stable funding [29]. This approach addresses large capital requirements while lowering financing costs, enhancing project sustainability.
Traditional financial institutions also innovate in green finance products and services. For instance, some banks offer pledge loans based on carbon emission rights, encouraging firms to engage in carbon trading and enhance carbon management while opening new financing channels [30,31]. Additionally, financial products linked to environmental performance, such as benefit-linked loans, adjust interest rates according to the actual environmental outcomes of projects. Projects achieving significant energy savings or emission reductions receive more favorable rates, incentivizing firms to focus on the operational effectiveness of green initiatives [32].
Despite the benefits, traditional financial support for green projects faces challenges. Green projects often require large upfront investments and have long payback periods, which can conflict with the short-term liquidity preferences of financial institutions [33]. Additionally, inconsistent definitions and evaluation standards across regions and industries complicate project identification and screening, raising the risk of greenwashing [34]. To mitigate these challenges, regulatory authorities have introduced measures such as standardized green project definitions, enhanced disclosure requirements, and improved risk assessment frameworks to reduce financing costs and uncertainty [35,36].
Based on the above content, the following hypotheses are proposed:
H3: Traditional financial support moderates the relationship between digital finance and green technology innovation.
H3a: Traditional financial support moderates the relationship between coverage extent of digital financial and green technology innovation.
H3b: Traditional financial support moderates the relationship between depth of digital finance and green technology innovation.
H3c: Traditional financial support moderates the relationship between degree of digitalization in digital finance and green technology innovation.
The theoretical framework of this paper is as follows in Figure 1:
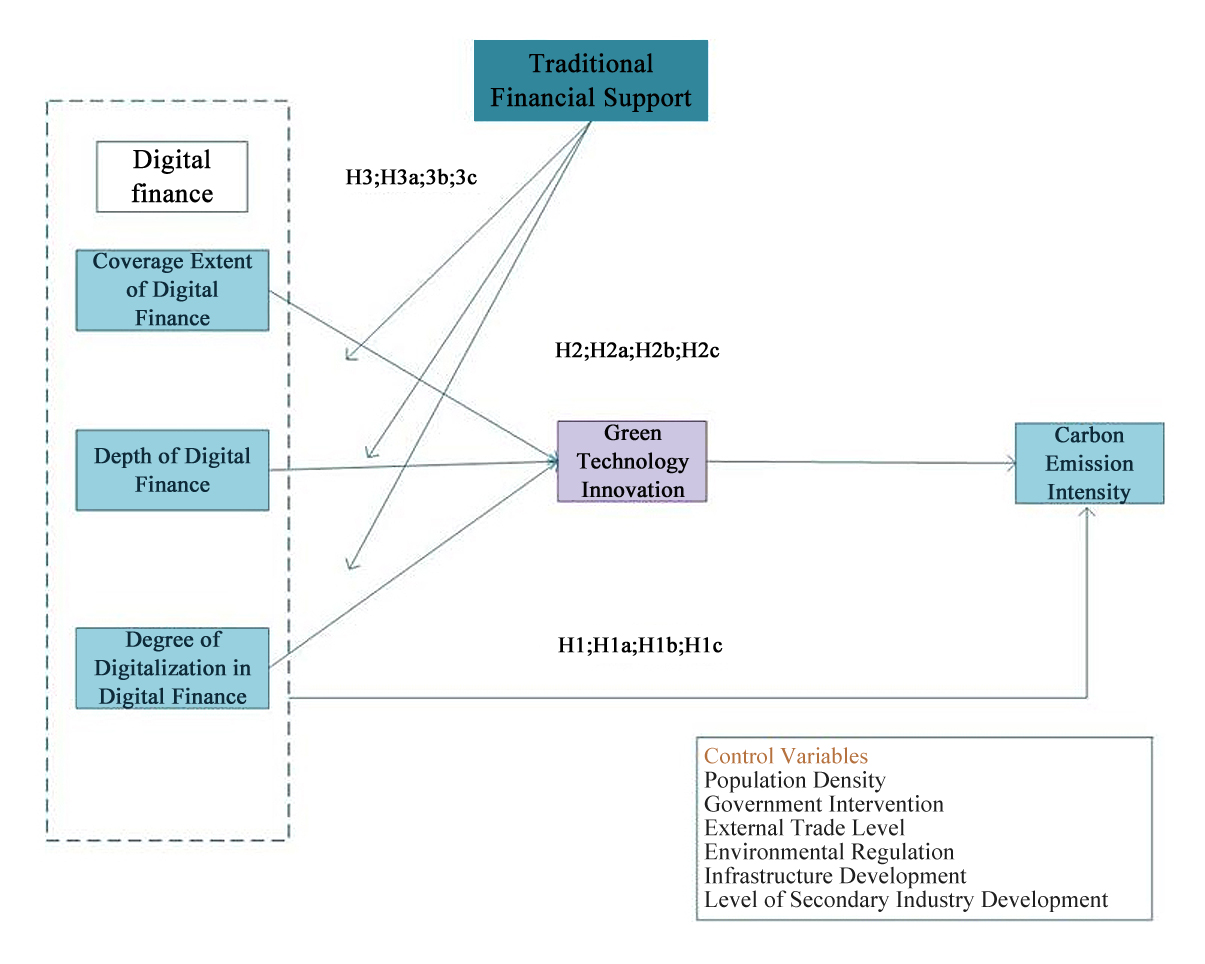 Figure 1. Hypothetical model.
In 2023, China accounted for 32% of global carbon dioxide emissions, making its emission control crucial not only for domestic sustainable development but also for global climate mitigation. As the largest developing country, China’s experience in carbon management can provide valuable lessons for other developing nations, advance the achievement of global sustainable development goals, and support the implementation of ESG principles [37].
First, there is the representativeness of the sample. As a vast country, China has significant regional economic disparities, with diverse industrial structures and resource endowments. By selecting these regions, this study can more accurately present the challenges and opportunities faced by regions at different development stages in promoting green technology innovation and implementing financial supervision.
Second, data integrity. Since 2011, China has strengthened carbon emission control and established a national monitoring system to track emissions, providing a reliable data foundation for reduction strategies [38]. The Peking University Digital Inclusive Finance Index integrates multidimensional financial information, enabling quantitative analyses of the finance–carbon relationship. Concurrently, policies promoting green technology innovation and green finance reform have generated rich datasets to capture dynamic institutional changes. Regions such as Hong Kong, Macau, Taiwan, and Tibet [39] are excluded due to differences in economic and financial systems or limited data availability, which could introduce bias [40].
Sampling Methods(1) Carbon Emission Intensity (CEI)
Carbon Emission Intensity (CEI) refers to the amount of carbon emissions per unit of gross domestic product (GDP) [41]. This metric is designed to illustrate the interaction between carbon emissions and economic growth, serving as an important tool for evaluating the degree of carbon peak achievement and the level of green economic development in a region. A lower value indicates less carbon emission per unit of economic output, reflecting greater economic efficiency and greener development.
The calculation formula for carbon emission intensity is as follows:
where: CEIi,t: Carbon emission intensity of province/region i in year t (unit: million tons per 100 million yuan). Ei,t: Total carbon emissions of province/region i in year t (unit: million tons). GDPi,t: Real GDP of province/region i in year t (unit: 100 million yuan, based on constant 2000 prices).
(2) Digital finance (DF)
Digital finance, represented by ln (DF), plays a significant role in promoting economic growth, optimizing resource allocation, and fostering social equity. This study adopts the “Peking University Digital Inclusive Finance Index” (2024 updated version), jointly developed by the Peking University Digital Finance Research Center and Ant Financial, as a proxy for regional digital financial development in China.
The index consists of the overall digital finance indicator (DF) and three core dimensions: coverage breadth (DFB), usage depth (DFU), and the degree of digitalization (DFD) [42], which capture accessibility, service utilization, and technological advancement of digital finance, respectively. Each dimension is constructed through a hierarchical system of secondary and tertiary indicators (see Table 1), enabling a comprehensive and comparable measurement of digital finance across regions.
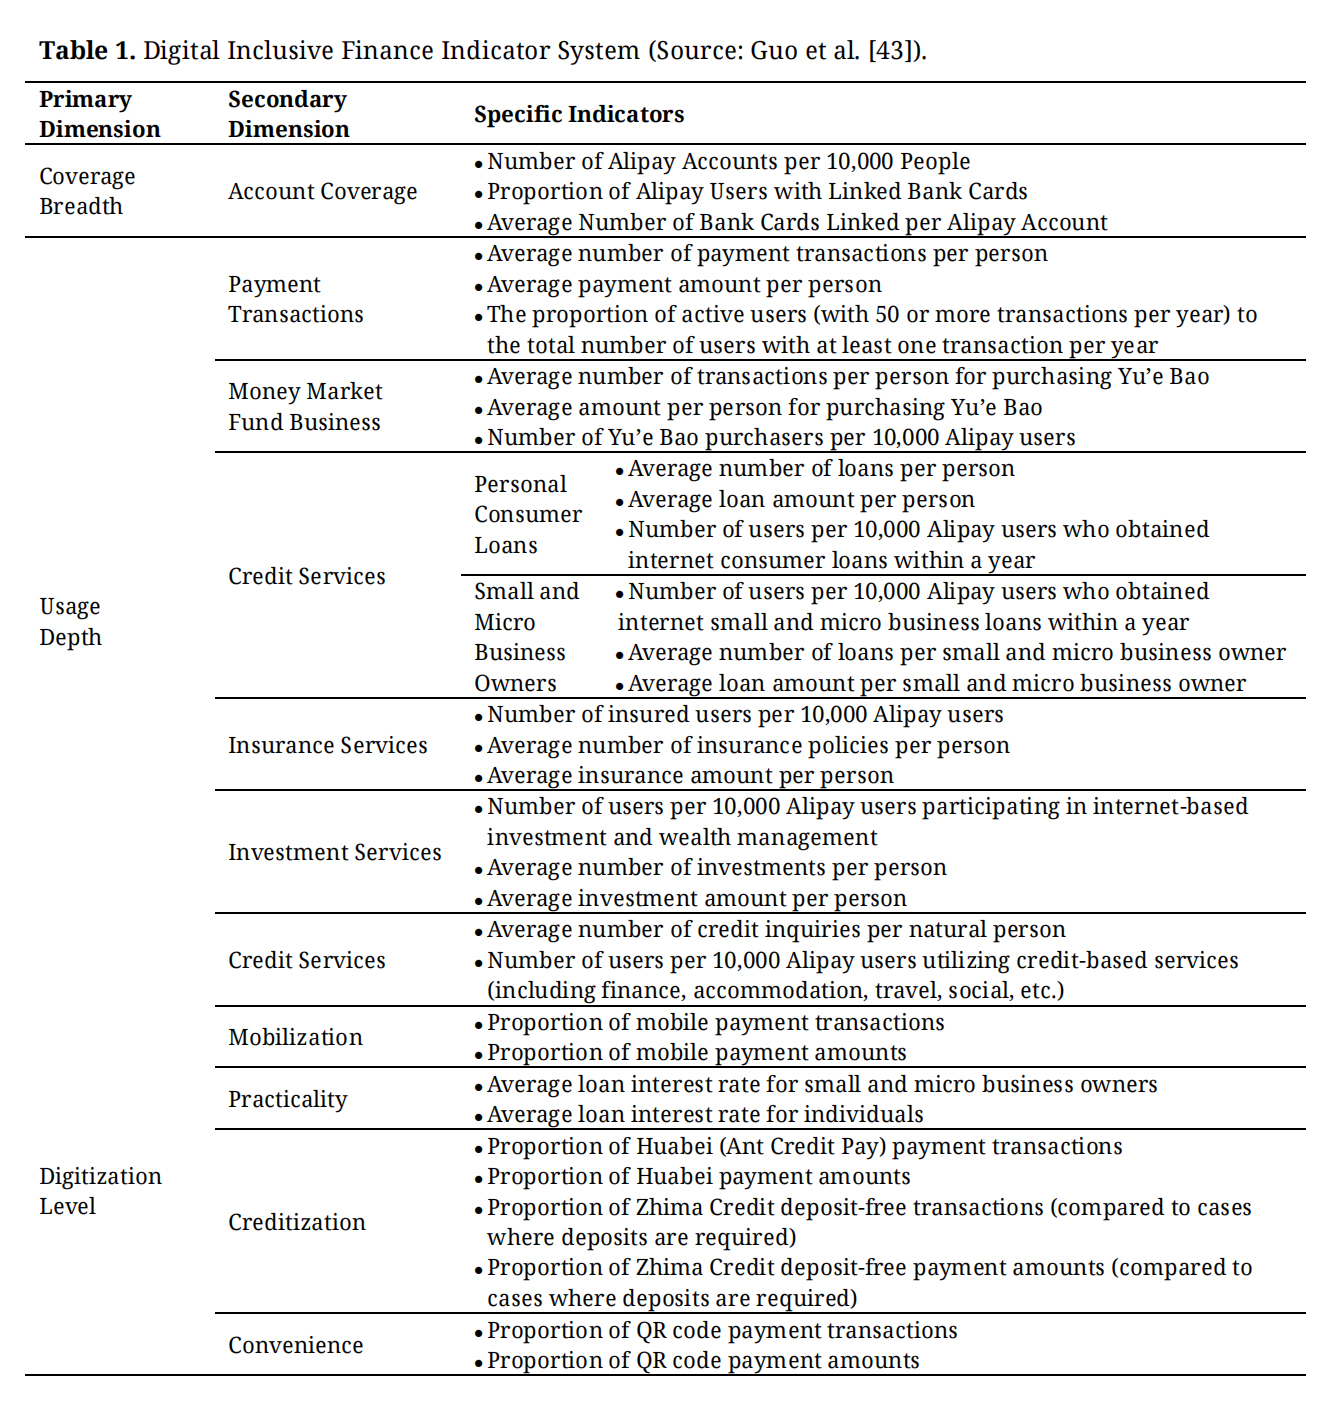 Table 1. Digital Inclusive Finance Indicator System (Source: Guo et al. [43]).
(3) Green technological innovation (GTI)
Existing studies often rely on surveys or proxy variables. Surveys are intuitive but may overlook technical details and suffer from reporting bias, reducing objectivity [44]. Therefore, many studies adopt proxy measures for green innovation [15]. In this study, green technological innovation serves as the mediating variable and is measured by the logarithm of green invention patent applications. Green patents include invention and utility model patents: invention patents, subject to stricter novelty and examination standards, indicate higher-quality innovation, while utility models reflect lower-quality innovation. Data collection involved identifying green patent categories and IPC codes from the WIPO (2010) Green List, followed by retrieval of firm-level patent data from China’s State Intellectual Property Office using IPC codes, firm identifiers, and application years as filters.
Since the original data may exhibit large dispersion and outliers, directly using raw values can adversely affect model estimation. Logarithmic transformation stabilizes the distribution and better satisfies model assumptions [45]. Accordingly, the numbers of green invention patent applications (Gip) and green utility model patent applications (Gup) are logarithmically transformed to reduce skewness and potential bias, thereby improving model stability and explanatory power.
where, i represents different observation units, such as enterprises, regions, etc., which specifically depends on the research object. t represents the time dimension, such as years, quarters, etc.
(4) Traditional financial support (TFS)
Traditional financial support (TFS), as a crucial moderating variable, has a profound impact on important areas such as green technology innovation and carbon emissions [46]. In view of this, this study uses the ratio of the support funds for green projects in the region to the regional Gross Domestic Product (GDP) to measure the level of Traditional Financial Support in promoting green development [47].
In this study, traditional financial support (TFS) is measured as the ratio of regional support funds for green projects (S) to regional gross domestic product (GDP, G), TFS = S/G. A higher value indicates stronger traditional financial support for green projects [48], which facilitates firms’ access to funding and promotes green technological innovation [49]. This indicator captures the extent to which local financial resources are allocated to the green sector and reflects how the regional market environment influences firms’ incentives to engage in green projects [50]. Therefore, TFS serves as a key moderating variable in this study.
where, Green projecti is the total loan support for green projects in the region i. Regional GDPi is the GDP of region i.
Control Variables(1) Population Density. Population density affects carbon intensity through its influence on lifestyles and environmental awareness [51]. Higher density can generate scale and agglomeration effects that improve production efficiency and reduce energy intensity, though excessive concentration may impose infrastructure pressure. However, the diffusion of environmental awareness and green concepts may further strengthen the restraining effect of population density on carbon intensity [52]. Population density is measured as total population divided by urban area (10,000 persons per square kilometer).
(2) Government Intervention: The government possesses the main resources supporting regional economic activities [53]. It not only directly participates in the production of the social “pie” but also in its distribution, thus having a direct or indirect impact on carbon emissions. This paper measures the level of government intervention by the ratio of fiscal expenditure to regional GDP in each province or city [54].
(3) External Trade Level: High-quality economic development requires external economic exchanges. By collaborating with foreign enterprises and learning advanced production and management technologies, domestic enterprises can improve their total factor productivity [55]. Therefore, this paper uses the ratio of the total import and export value of goods to regional GDP in each province or city as the proxy variable for external trade level.
(4) Environmental Regulation: Environmental regulation affects carbon intensity by raising external costs, prompting firms to increase investment in technological innovation and transform production methods. The level of regional greening can partly reflect regulatory stringency. Following prior study [56], this paper measures environmental regulation by the greening coverage ratio in urban districts (%).
(5) Infrastructure Development: Infrastructure development not only affects the efficiency of economic activities but also results in significant carbon emissions during its construction [57]. This paper measures the level of infrastructure development using the ratio of urban road area to the total urban area [58].
(6) Level of Secondary Industry Development: Carbon emissions are not solely an environmental issue but are also influenced by economic, social, and cultural factors [59]. Industrial development leads to environmental pollution and increased carbon emissions. To account for this, the level of industrial development at the provincial level is controlled in this study. The ratio of the added value of the secondary industry to GDP is used as a proxy variable for the development level of the secondary industry [60].
Estimation MethodThis study employs panel data regression models to examine the relationships among carbon emission intensity (CEI), digital finance (DF), green technology innovation (GTI), traditional financial support (TFS), and control variables. Model selection is determined using the Hausman test. Fixed effects are applied when regressors correlate with error terms; otherwise, random effects are used. The fixed-effects model controls for unobserved regional and temporal heterogeneity.
Prior to estimation, data were standardized and descriptive statistics were calculated to examine distributional characteristics. Panel stationarity was tested using both ADF and KPSS tests. Non-stationary variables were transformed through first-order differencing, logarithmic transformation, or detrending when necessary.
In the regression framework, CEI is the dependent variable, DF is the core explanatory variable, GTI is the mediating variable, and TFS is the moderating variable. Control variables include population density, government intervention, foreign trade, environmental regulation, infrastructure development, and secondary industry development. The estimation proceeds stepwise, beginning with a baseline model without controls and then progressively adding control variables to examine the robustness of the effects on CEI.
To examine the moderating role of Traditional Financial Support (TFS), an interaction term (DF × TFS) is introduced to test whether TFS moderates the effect of Digital Finance on Green Technology Innovation (GTI). Robust standard errors are applied to address heteroscedasticity. Robustness checks are conducted using alternative samples and proxy variables [52].
Model SettingBenchmark regression model: This paper builds a dynamic GMM panel model to examine the nonlinear relationship between digital finance and carbon emission intensity. The specific model is as follows:
where, CEIit is the explained variable, representing the carbon emission intensity of region i in year t; CEIit−1 is the carbon emission intensity of the lagging phase; DFit is the explanatory variable, representing the digital financial level of region i in year t including the overall digital finance index(DF) and 3 dimensions: coverage breadth (Cover), depth of use (Use), digitalization degree (Dig); Zit represents the control variable; α0 represents the constant item; and εit represents the error item.
This paper adds models (2) and (3) based on model (1) to form the mediation effect model as follows, to test the mediation transmission role of green technology innovation between all dimensions of digital finance and carbon emission intensity:
where, GTIit is the intermediary variable, representing the level of green technology innovation of region i in year t; the other variables are consistent with the model (1).
This paper constructs the following model to test the support role of traditional finance on the relationship between each dimension of digital finance and green technology innovation. The specific model is as follows:
where TFSit is the moderator variable, representing the traditional financial support level of region i in year t; TFSit×DFit is the interaction item between traditional finance support and digital finance; TFSit×DFit2 is the square term of traditional finance support and digital finance; the remaining variables are consistent with model (2) and (3).
This study constructs a multidimensional indicator system (Table 2), incorporating core explanatory variables, control variables, and moderating variables. Carbon emission intensity (CE) is selected as the dependent variable, measured by unit GDP carbon dioxide emissions (tons per 10,000 yuan), with data sourced from the China Energy Statistical Yearbookand provincial statistical yearbooks. The core explanatory variable, digital finance (DF), adopts the Peking University Digital Inclusive Finance Index, encompassing the overall digital finance index (DF) and three dimensions: coverage breadth (Cover), usage depth (Use), and digitization level (Dig). This index demonstrates strong temporal continuity and regional comparability.
Overall, the standard deviations of all variables are generally greater than 0.05 (and some even exceed 0.1), and the range of extreme values is significant (such as infra covering negative to positive values, and the difference in dig’s extreme values exceeding 6), indicating that the variables have “sufficient variation”—this not only avoids the problem of “multicollinearity suppressing explanatory power” in regression analysis but also provides a realistic basis for advanced analyses such as “grouped regression, heterogeneity tests, and mechanism decomposition”. For instance, the high volatility of core explanatory variables can support research on the “non-linear impact of digitalization on carbon emissions”, and the regional differentiation of control variables creates conditions for “spatial heterogeneity analysis of policy effects”. In short, the descriptive statistical results not only verify the “research applicability” of the sample but also provide clues for the “direction of mechanism exploration” in subsequent empirical analysis.
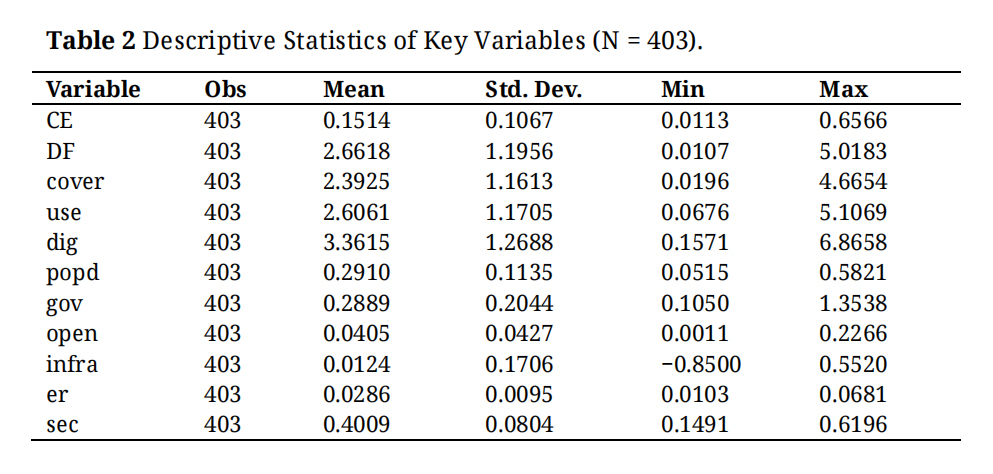 Table 2. Descriptive Statistics of Key Variables (N = 403).
This study systematically examined the multicollinearity problem among variables in the multiple regression model by combining the Pearson correlation coefficient matrix with the variance inflation factor (VIF) analysis. The results are as follows:
Firstly, from the correlation coefficient matrix (Table 3), it can be seen that carbon emission intensity (CE) has statistically significant linear correlations with most of the core variables. Specifically, the three core dimensions of digital finance (DF, r = −0.472): coverage breadth (cover, r = −0.376), usage depth (use, r = −0.348), and digitalization degree (dig, r = −0.194), as well as population density (popd, r = −0.130), the level of foreign trade (open, r = −0.378), and the level of infrastructure (infra, r = −0.105) are all significantly negatively correlated with CE at the 1% or 5% level. Among them, the level of foreign trade (open) has the strongest negative correlation with CE (r = −0.378), directly confirming the theoretical expectation that “opening up to the outside world can suppress carbon emissions through technology spillovers and industrial structure upgrading”; while the strong negative correlation of digital finance coverage breadth suggests that “improving the accessibility of digital services” may be a key approach to reducing carbon emissions − the popularization of digital technology can help underdeveloped regions introduce clean technologies and optimize energy structures. On the other hand, government intervention degree (gov, r = 0.201), environmental regulation (er, r = 0.262), and the proportion of the secondary industry (sec, r = 0.396) are significantly positively correlated with CE, with the proportion of the secondary industry (sec) having the highest positive correlation (r = 0.396), highlighting the structural contradiction of the industrial sector being “high energy−consuming and high−emitting”—the improvement of industrialization levels will directly increase carbon emission intensity. Overall, the correlation coefficient matrix clearly presents the systematic correlations among variables, providing an intuitive empirical basis for the subsequent model setting.
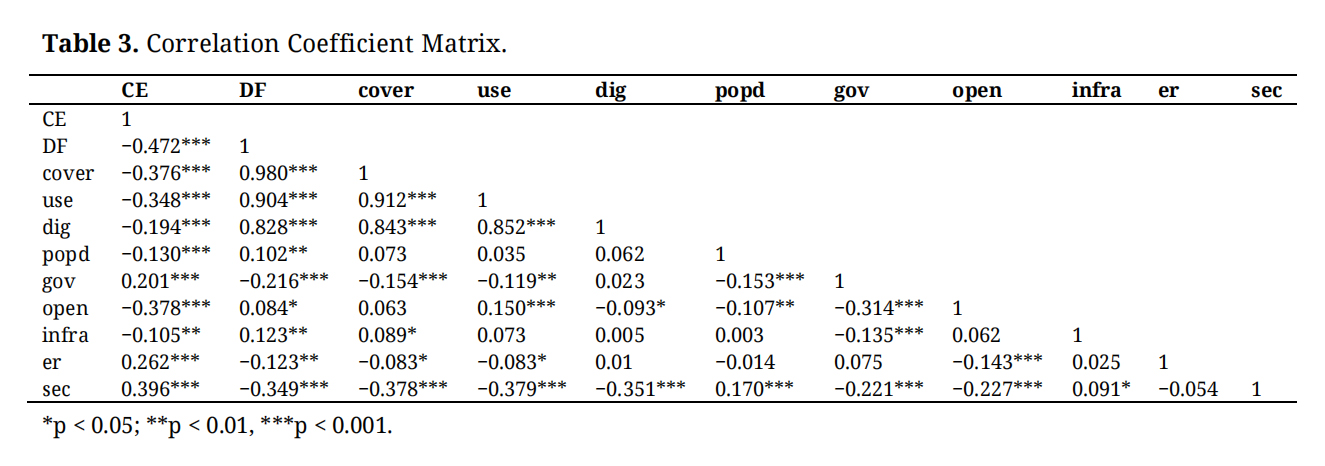 Table 3. Correlation Coefficient Matrix.
To further verify the risk of collinearity among the variables, this study calculated the variance inflation factor (VIF) for all explanatory variables (Table 4). The results show that the VIF values of all variables are far below the commonly used threshold of 10 (the maximum VIF is 1.54 for the proportion of the secondary industry sec, and the minimum is 1.04 for the infrastructure level infra), and the tolerance (1/VIF) of each variable is greater than 0.6 (for example, the tolerance of infra is 0.958, and that of sec is 0.650).
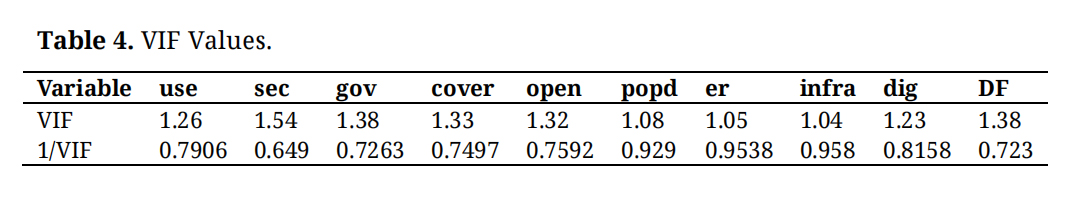 Table 4. VIF Values.
In conclusion, the correlation matrix and VIF test jointly indicate that the linear relationships among the variables are in line with theoretical logic and there is no serious multicollinearity interference. This not only lays a reliable data foundation for the subsequent regression analysis but also suggests that the model can effectively capture the core mechanism of “digital finance-carbon emissions”, while controlling the interference of other socio-economic factors.
Table 5 conducts Hausman tests for three types of models with “different dimensions of digital inclusive finance” as the core explanatory variables, and the results are as follows:
Model (1): With “the index of the coverage breadth of digital inclusive finance” as the core explanatory variable, the Hausman statistic is 13.76, and the corresponding P-value is 0.0177. Since 0.0177 < 5%, the null hypothesis that the random effects model is more reasonable is strongly rejected statistically, and thus the fixed effects model is chosen.
Model (1): With “Digital Finance Total Index” as the core explanatory variable, the Hausman statistic is 946.43, and the corresponding P-value is 0.000. Since 0.000 < 5%, the null hypothesis that “the random effects model is more reasonable” is strongly rejected statistically, so the fixed effects model is selected.
Model (2): With “the index of the coverage breadth of Digital finance” as the core explanatory variable, the Hausman statistic is 13.76, and the corresponding P-value is 0.0177. Since 0.0177 < 5%, the null hypothesis that the random effects model is more reasonable is strongly rejected statistically, and thus the fixed effects model is chosen.
Model (3): With “the depth of use of Digital finance” as the core explanatory variable, the Hausman statistic increases to 103.81, and the corresponding P-value drops to 0.003. Under the significance level of 5%, the rejection of the null hypothesis is further strengthened, and the fixed effects model is also chosen.
Model (4): (Based on the research logic, it is speculated that it still focuses on other dimensions of Digital finance) The Hausman statistic is as high as 135.059, and the corresponding P-value is 0.000 (which can be understood as “almost 0”). The extremely small P-value indicates that the statistical significance is at an extremely high level, completely rejecting the null hypothesis, and ultimately choosing the fixed effects model.
All four models reject the null hypothesis that the random effects model is more reasonable and consistently choose the fixed effects model. The reason is that the fixed effects model can accurately capture the “heterogeneity at the individual level that does not change over time” (such as regional institutional differences, resource endowment differences, etc.), avoiding estimation bias caused by ignoring such heterogeneity; while the random effects model assumes that “individual heterogeneity is not related to the explanatory variables”, and this assumption is refuted by the statistical evidence in this study, so the fixed effects model is a more reliable choice.
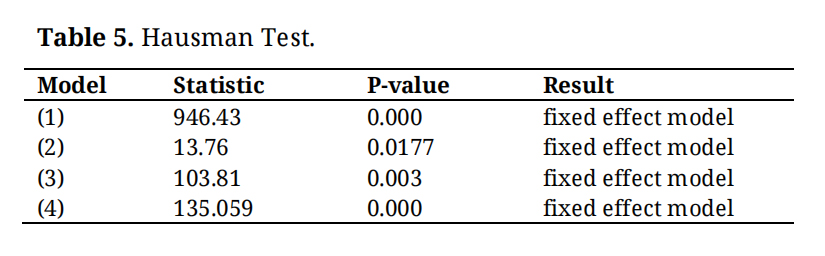 Table 5. Hausman Test.
This study employs a fixed-effects model to empirically examine the impact of the overall development level of Digital finance and its different dimensions on carbon emission intensity (CE). Specifically, the overall Digital finance index (DF) and its three core dimensions—coverage breadth (cover), usage depth (use), and degree of digitalization (dig)—are incorporated into the regression framework, yielding four benchmark regression models. The corresponding estimation results are reported in Columns (1)–(4) of Table 6. All models simultaneously control for regional fixed effects and year fixed effects, thereby effectively eliminating the influence of time-invariant regional heterogeneity (such as resource endowments and industrial foundations) as well as common macro-level shocks (such as economic cycle fluctuations and policy changes). In addition, a set of control variables—including population density (popd), government intervention (gov), economic openness (open), infrastructure level (infra), environmental regulation (er), and industrial structure (sec)—is included to comprehensively capture the socio-economic factors that may affect carbon emission intensity.
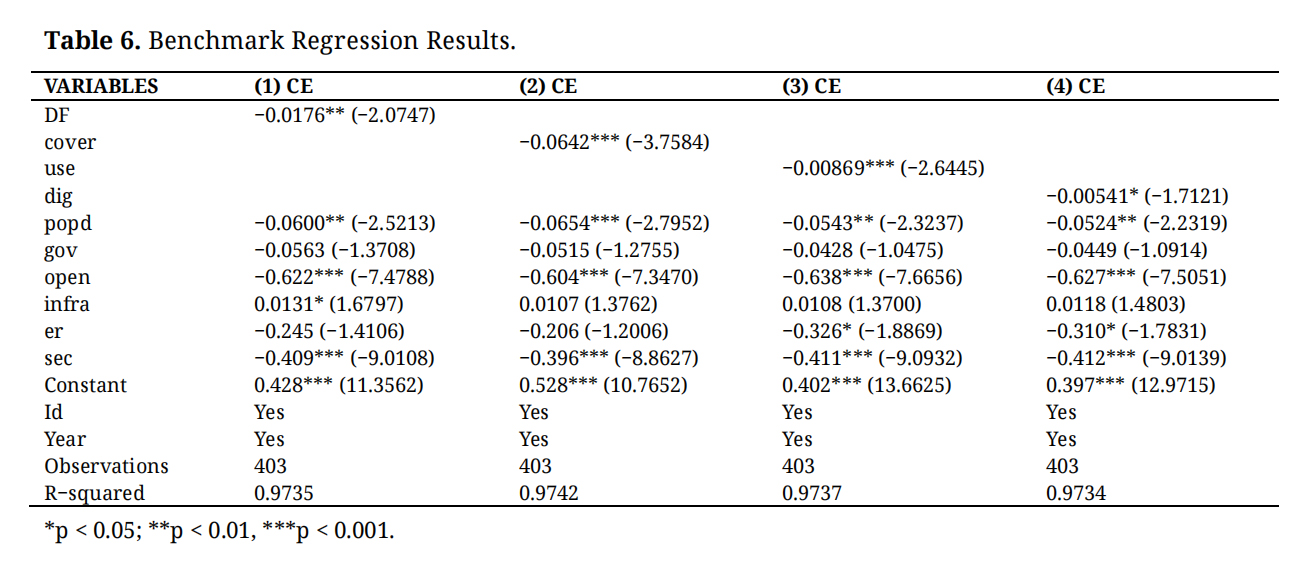 Table 6. Benchmark Regression Results.
The regression results in columns (1) to (4) of Table 7 show that after excluding the central municipalities, the regression coefficients of the total index of Digital finance and its various dimension variables remain negative, and the significance levels are basically consistent with the benchmark regression results, with only slight adjustments in the coefficient magnitudes, indicating that the benchmark conclusion has not been systematically disturbed by the samples of special regions.
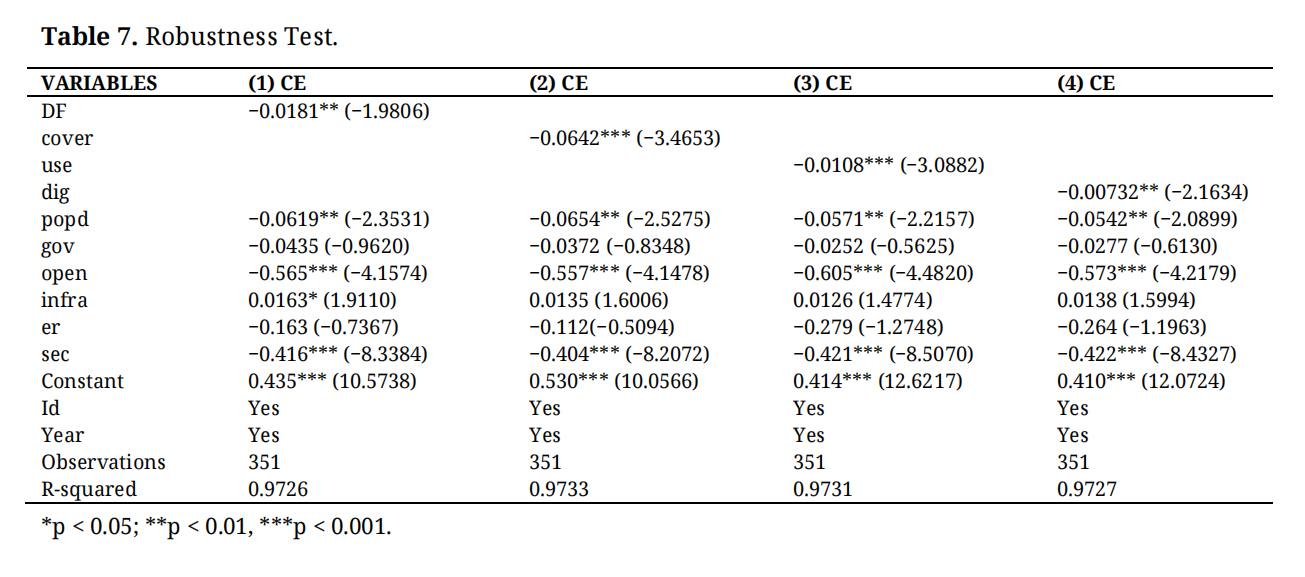 Table 7. Robustness Test.
The regression results are reported in Table 8. The estimates indicate that, after excluding post-2020 observations, the effects of Digital finance and its sub-dimensions on carbon emission intensity remain highly robust. In particular, the coefficient of the Digital finance Index (DF) is −0.0208 and statistically significant at the 5% level, suggesting that the overall development of Digital finance continues to exert a significant carbon-reducing effect, with a larger magnitude than that observed in the baseline regression.
By introducing the square term of the digital finance index (DF2) based on the baseline model, we aim to test whether there is a nonlinear impact of digital finance on carbon emission intensity. The estimation results including the DF2 term are reported in the second column of Table 9. The coefficient of DF2 is −0.000, the t−statistic is −0.77, and the p−value is 0.448. At the 10% significance level, it is not significant. Therefore, within the sample range of this study, the impact of digital finance on carbon emission intensity is mainly linear, and there is no statistically supported inverted U−shaped nonlinear effect. Thus, the final model does not include the DF2 term. The DF2 term in the original model equation has been deleted to maintain the consistency between the model setting and the empirical results.
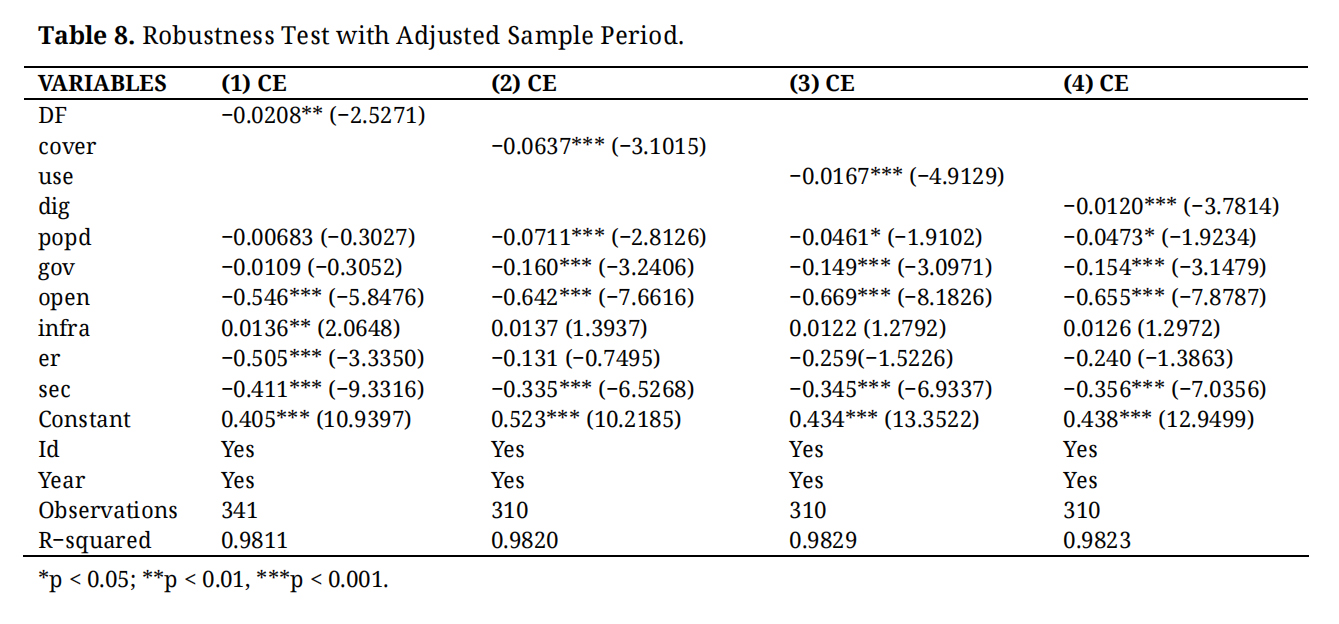 Table 8. Robustness Test with Adjusted Sample Period.
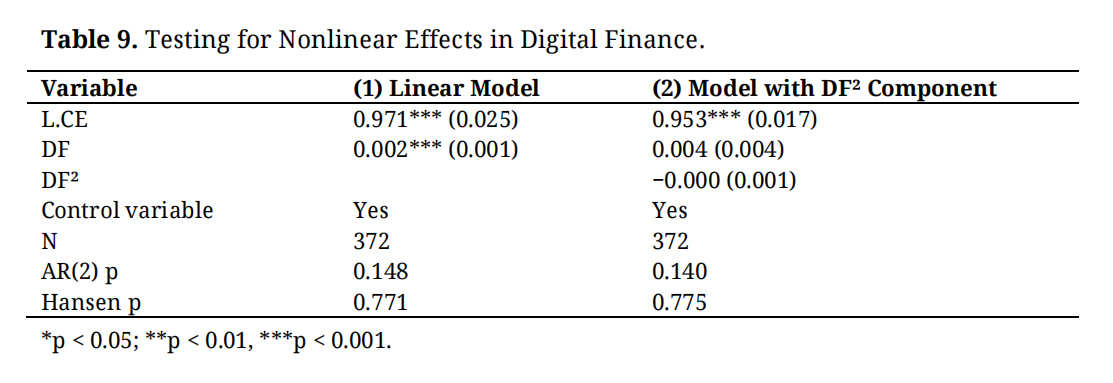 Table 9. Testing for Nonlinear Effects in Digital Finance.
The two-step system GMM method was adopted for estimation, and Windmeijer [61] finite sample correction was applied. The 2nd to 4th lag values of the explained variable carbon emission intensity (CE) were used as GMM-style instrumental variables, and the digital financial index and each control variable were used as exogenous IV-style instrumental variables. Table 10 reports three key diagnostic statistics. The Arellano-Bond serial correlation test results show that the AR(1) statistic is significant in all models (p < 0.05), which is in line with theoretical expectations; the AR(2) statistic is not significant (p values range from 0.120 to 0.173, all greater than 0.1), indicating that there is no second-order serial correlation in the difference residuals, and the validity of the instrumental variables is guaranteed. The p-values of the Hansen overidentification test range from 0.741 to 0.772, all significantly greater than 0.1, proving that the instrumental variables are overall effective and there is no overidentification problem. Based on the above diagnostics, the dynamic GMM estimation results of this paper are consistent.
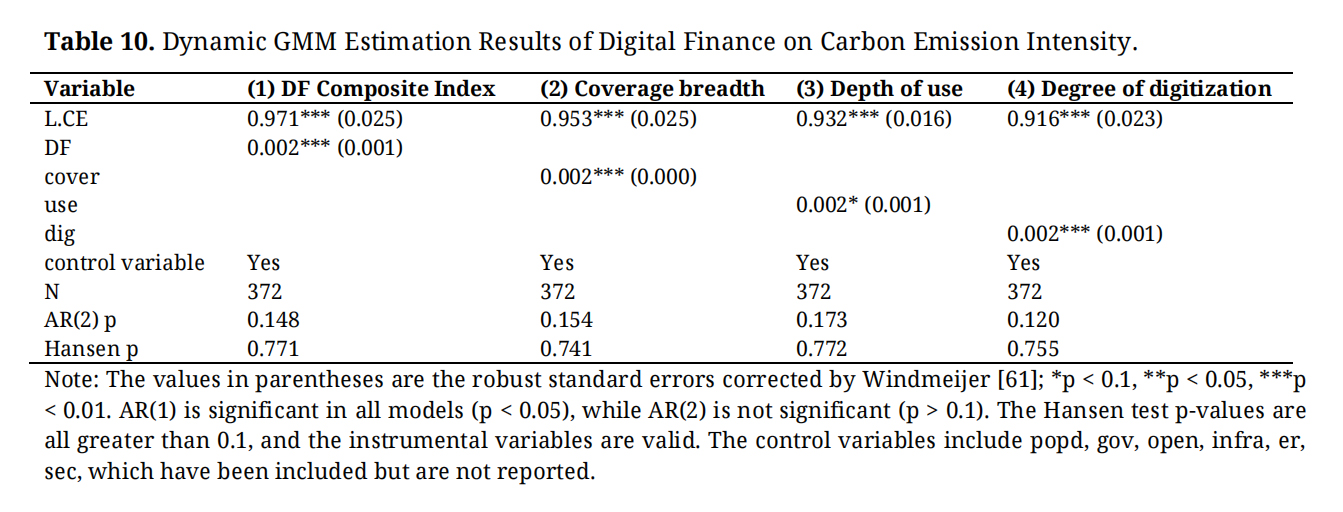 Table 10. Dynamic GMM Estimation Results of Digital Finance on Carbon Emission Intensity.
Table 11 reports the 2SLS estimation results, including both the first-stage and second-stage regressions. The first-stage results indicate that the instrumental variable is highly and positively correlated with Digital finance and its sub-dimensions. The coefficients of the instrument are all statistically significant at the 1% level, and the Kleibergen–Paaprk Wald F statistics are well above the conventional threshold of 10, suggesting that the instrument is sufficiently strong and that weak instrument concerns are unlikely to bias the estimation results.
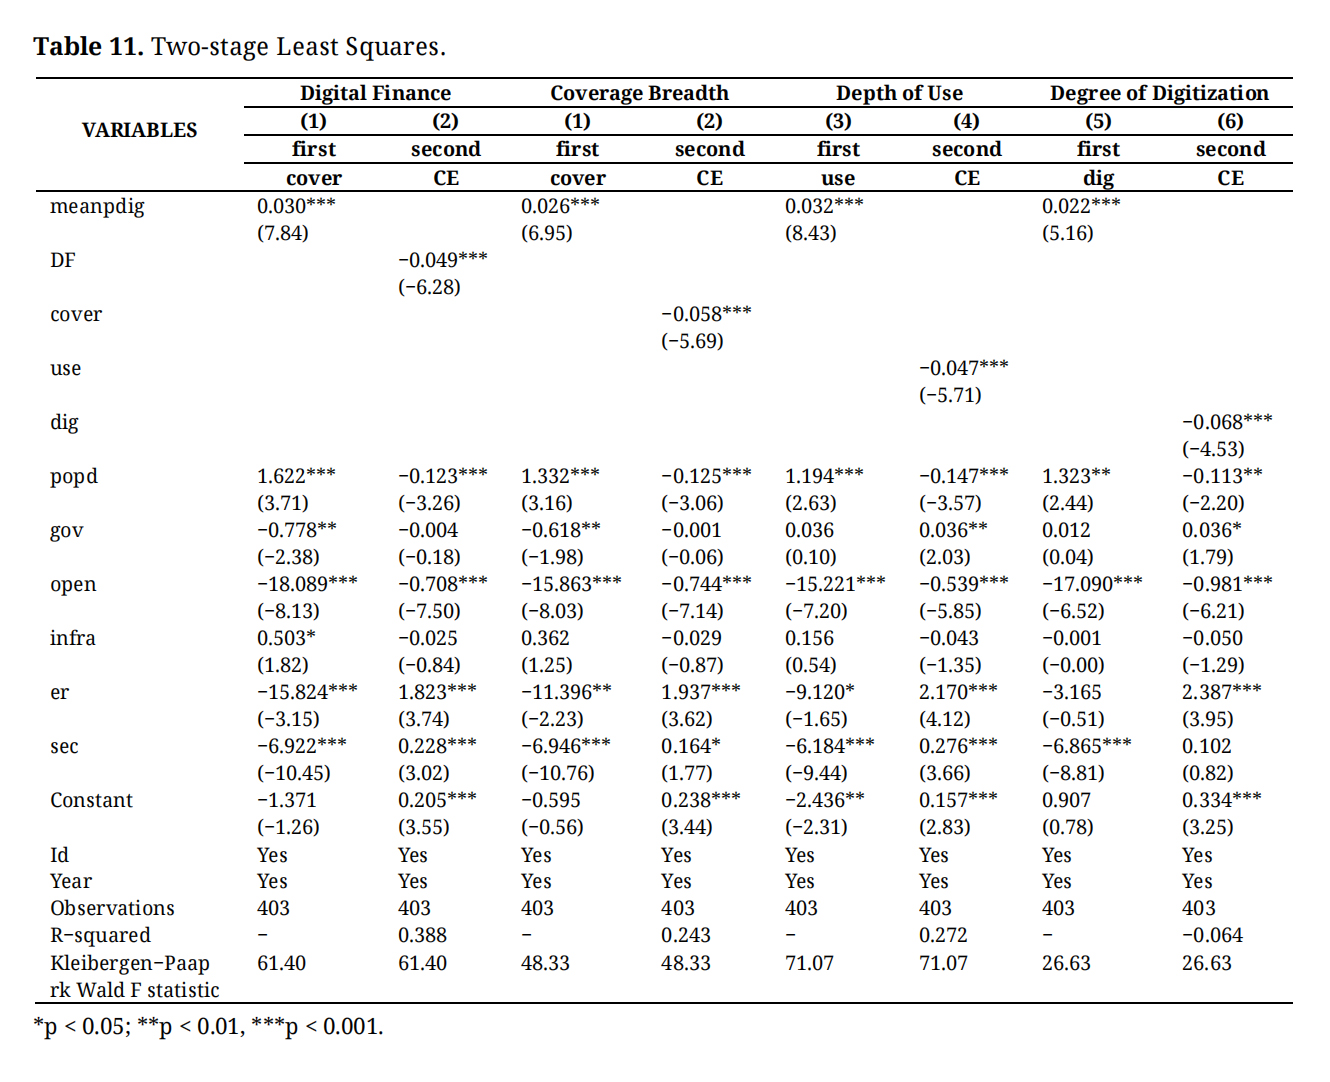 Table 11. Two-stage Least Squares.
To explore the underlying mechanisms of digital financial (DF) influencing carbon emission intensity (CE), this study constructs a mediation model to examine whether green innovation (gi) mediates this relationship. Regression results in Table 12 show that in Column (1), the estimated coefficient of digital financial (DF) on green innovation (gi) is 0.326, significant at the 1% level, indicating that the development of digital financial inclusion effectively promotes green innovation. In Column (2), after controlling green innovation (gi), the coefficient of green innovation on carbon emission intensity (CE) is −0.0171, significantly negative at the 1% level, demonstrating that green innovation has a significant carbon reduction effect. Meanwhile, the coefficient of digital financial (DF) remains significantly negative (−0.0293, 1% level), but its absolute value exceeds the direct effect without the mediation variable (see baseline regression), while the coefficient of green innovation is also significant. According to the mediation test procedure, these results indicate that green innovation partially mediates the impact of digital financial inclusion on carbon emission intensity. Hypothesis H2 is thus verified.
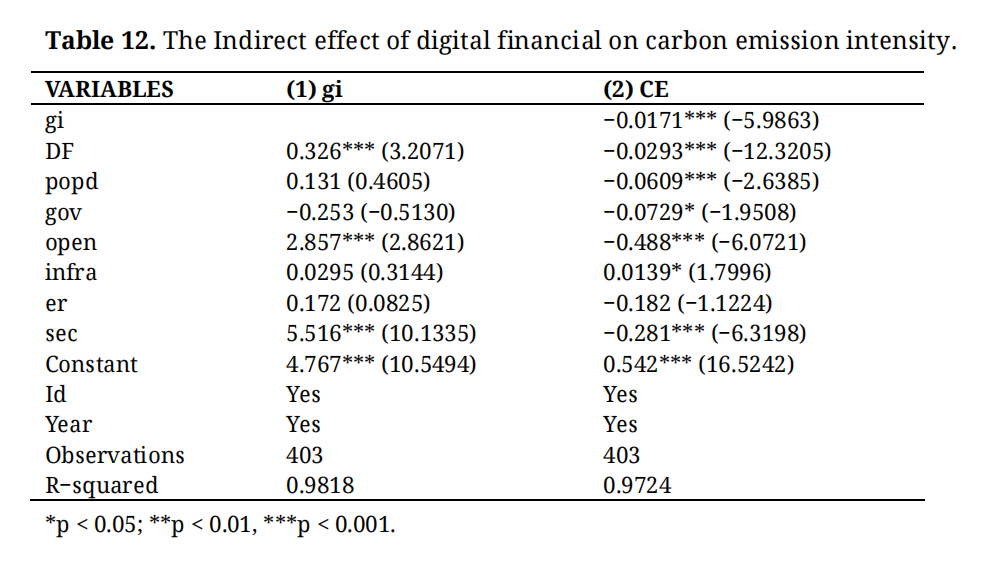 Table 12. The Indirect effect of digital financial on carbon emission intensity.
To deeply explore the indirect influence mechanism of the coverage breadth of Digital finance on carbon emission intensity (CE), this study adopts a mediation effect model and focuses on green technological innovation (gi) as a key mediating variable for testing. The regression results in Table 13 clearly present the chain of effects: “coverage breadth-green technological innovation-carbon emission intensity”. In the regression with green technological innovation as the dependent variable (Model 1), the regression coefficient of coverage breadth reaches 0.614 and is highly significant at the 1% statistical level (t = 2.9474), indicating that the expansion of the coverage of Digital finance can significantly stimulate green technology research and innovation. In the regression with carbon emission intensity as the dependent variable (Model 2), the regression coefficient of green technological innovation is −0.0140 (t = −3.2486), confirming that green technological innovation has a direct inhibitory effect on carbon emission intensity. When the mediating variable is included simultaneously, the direct effect of coverage breadth on carbon emission intensity remains significantly negative (−0.0556, t = −3.2594), but it is significantly lower than the total effect without introducing the mediating variable. This indicates that green technological innovation plays a partial mediating role between coverage breadth and carbon emission intensity. Coverage breadth can not only directly reduce carbon emission intensity through means such as optimizing resource allocation but also achieve emission reduction through the indirect path of “stimulating green technological innovation”. Hypothesis H2a is thus verified.
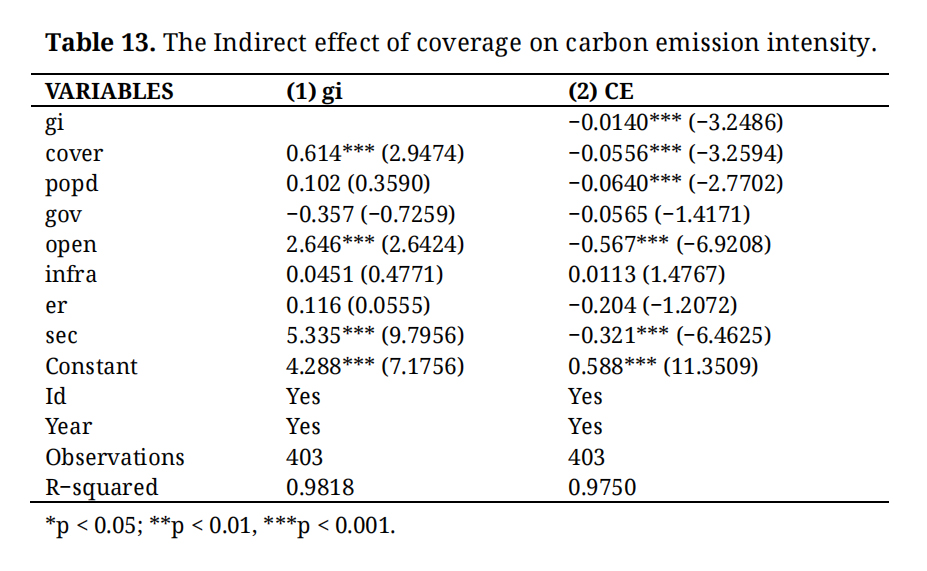 Table 13. The Indirect effect of coverage on carbon emission intensity.
Table 14 shows the mechanism by which the depth of digital finance use reduces carbon emission intensity through the green technology innovation part as an intermediary. The depth of digital finance significantly promotes green technology innovation (coefficient 0.0827, 5% significant), which provides financing support by expanding service coverage and integrating scenarios; green technology innovation significantly inhibits carbon emission intensity (coefficient −0.0151, 1% significant), achieving this through improving energy efficiency and optimizing the energy structure, etc.; the depth of use has a direct negative effect on carbon emission intensity (coefficient −0.00745, 5% significant) and an indirect effect, forming a partial intermediary path, ultimately confirming hypothesis H2b.
This study verified the mechanism through which the degree of digitalization (dig) reduces carbon emission intensity (CE) via green technological innovation (gi) using the mediation effect model(from Table 15): The first regression showed that dig significantly promoted gi (coefficient 0.379, 1% significant); the second regression showed that gi significantly inhibited CE (coefficient −0.0163, 1% significant); after adding gi in the third step, the direct effect of dig on CE weakened (coefficient −0.00563, 10% significant), which conforms to the logic of the mediation effect—gi plays a partial mediating role between dig and CE, that is, digital development mainly achieves carbon emission reduction indirectly by promoting green technological innovation, verifying Hypothesis H2c.
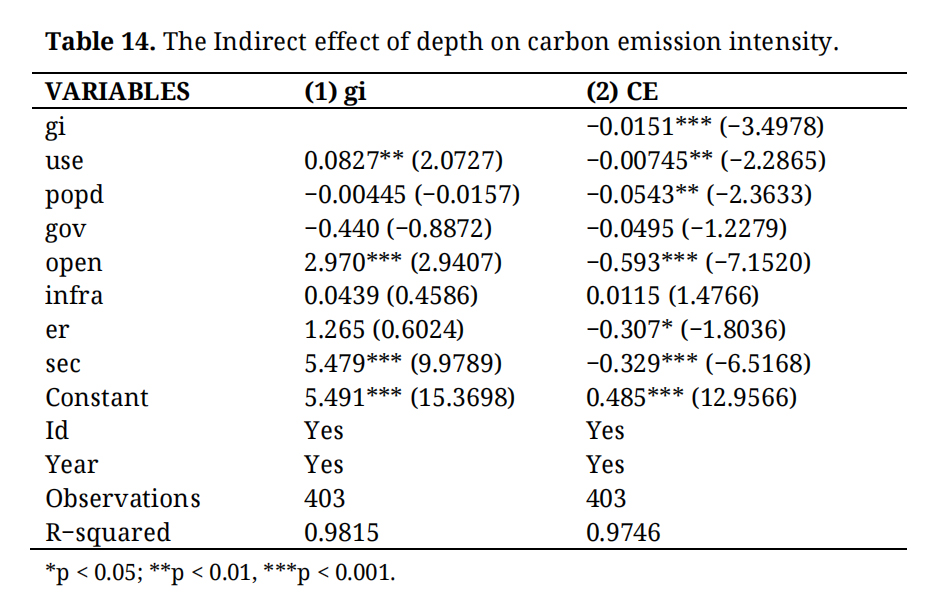 Table 14. The Indirect effect of depth on carbon emission intensity.
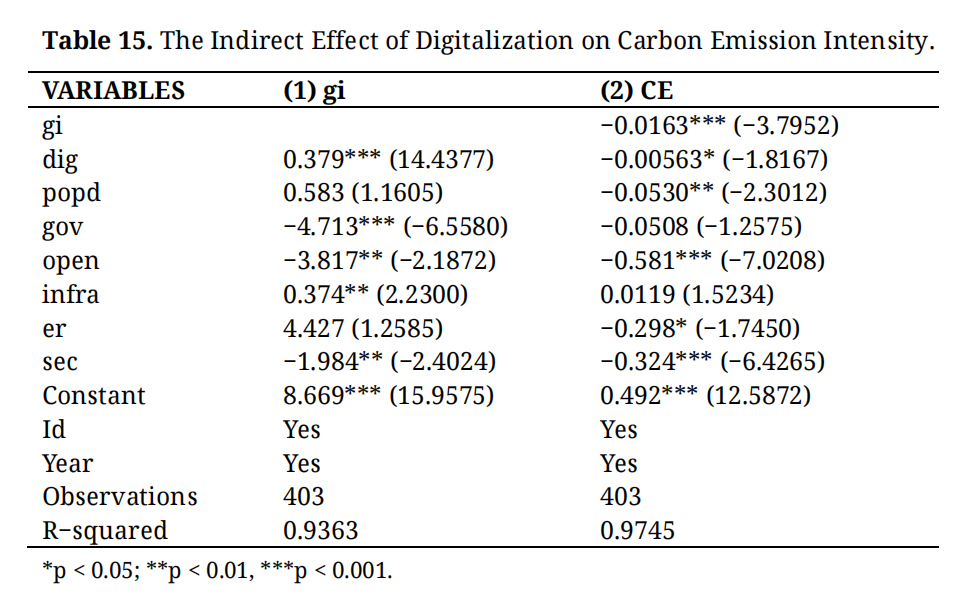 Table 15. The Indirect Effect of Digitalization on Carbon Emission Intensity.
The moderating effect analysis consistently demonstrates that traditional financial development plays a significant positive moderating role in the relationship between Digital finance and carbon emission intensity (Table 16). Whether at the aggregate level or across the sub-dimensions of coverage breadth, usage depth, and digitalization degree, traditional finance and Digital finance exhibit strong complementarities. Their coordinated development contributes to the construction of a more multi-layered and efficient green financial system, thereby effectively promoting sustained reductions in carbon emission intensity.
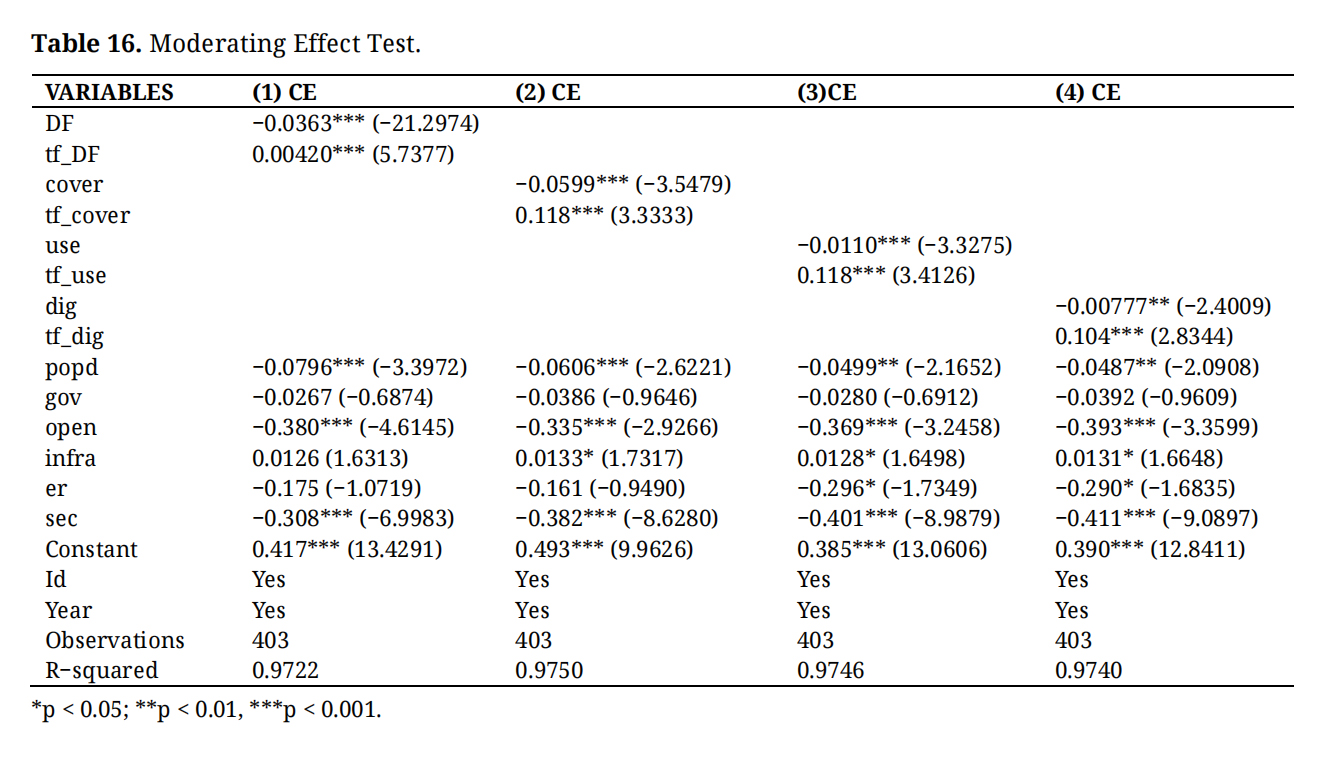 Table 16. Moderating Effect Test.
Considering the significant differences in economic development levels, digital infrastructure completeness, and industrial structure among the eastern, central, and western regions of China, according to the regional classification standards of the National Bureau of Statistics, the entire sample was divided into three sub-samples: the eastern region (11 provinces and municipalities), the central region (8 provinces), and the western region (12 provinces and autonomous regions). Fixed effect regressions were conducted separately for each region, and the results are reported in Table 17.
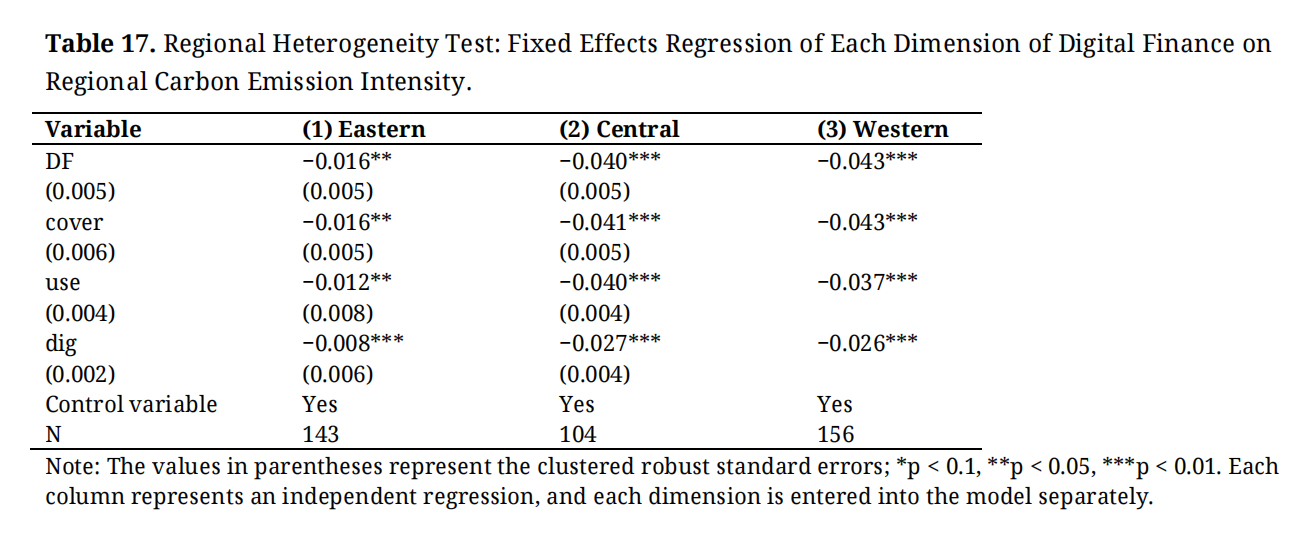 Table 17. Regional Heterogeneity Test: Fixed Effects Regression of Each Dimension of Digital Finance on Regional Carbon Emission Intensity.
Regarding the eastern region, the estimated coefficient of DF is −0.016, which is significant at the 5% level, indicating that the development of digital finance significantly reduces the carbon emission intensity in the eastern region, but the effect is relatively weak. The DF coefficient in the central region is −0.040, and that in the western region is −0.043, both highly significant at the 1% level, and the absolute values are significantly larger than those in the eastern region. This indicates that the enabling effect of digital finance on carbon emission reduction in the central and western regions is more prominent. This is consistent with the theoretical logic that the central and western regions are in the critical stage of industrial transformation and the penetration of digital finance brings a stronger marginal emission reduction effect.
To formally verify the statistical significance of the regional differences, this paper further constructs the interaction term of DF and regional dummy variables and conducts the Chow test. The results are shown in Table 18. The difference test of DF coefficients between the eastern and western regions has F(1, 30) = 8.83 (p = 0.006), the difference test of DF coefficients between the central and western regions has F(1, 30) = 3.20 (p = 0.084), and the joint difference test of the three regions has F(2, 30) = 4.94 (p = 0.014), all of which reject the null hypothesis of equal coefficients at the 10% significance level, and the regional heterogeneity conclusion is empirically supported.
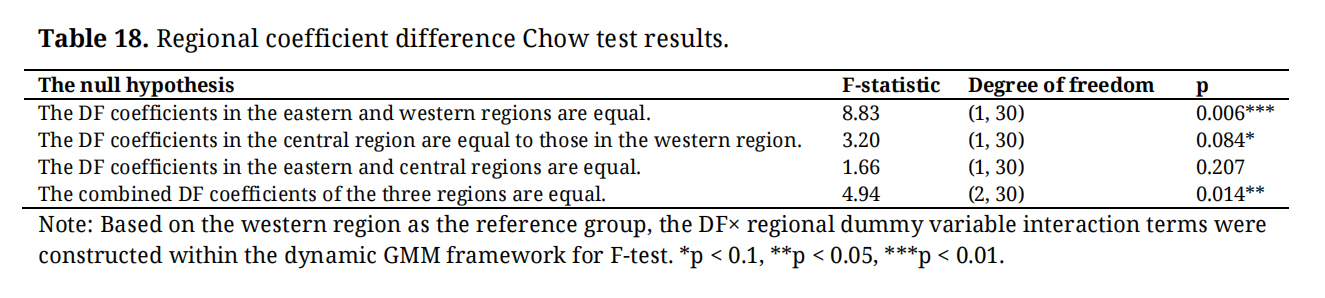 Table 18. Regional coefficient difference Chow test results.
This study finds that digital finance significantly reduces carbon emission intensity, with heterogeneous effects across its dimensions. Expanding financial coverage plays the most prominent role, followed by usage depth, whereas the effect of digitalization remains comparatively limited. These results suggest that improving financial accessibility and utilization efficiency is more critical for emission reduction than technological digitalization alone.
The mechanism analysis indicates that digital finance mainly promotes carbon reduction by facilitating green technological innovation, thereby establishing the transmission path from financial development to environmental improvement. Furthermore, traditional financial development strengthens this effect, highlighting the complementary relationship between digital and conventional financial systems in supporting low-carbon transformation.
The emission reduction effects of digital finance also exhibit clear regional heterogeneity. The impacts are stronger in the central and western regions, where financial accessibility is relatively constrained, but weaker in the eastern region with more mature financial markets and cleaner industrial structures. This pattern underscores the conditional nature of digital finance’s environmental benefits.
Overall, this study contributes to the literature by clarifying the multidimensional environmental effects of digital finance and identifying its underlying transmission mechanisms and regional contingencies. The findings provide important policy implications for designing differentiated financial strategies that leverage digital financial innovation to accelerate the low-carbon transition.
Policy Recommendations National Governance and Institutional FrameworkTo fully unlock the carbon reduction potential of digital finance, a comprehensive national-level governance framework should be established. Firstly, top-level policy design should be strengthened, and targeted guidelines should be issued to link the development of digital finance with the goal of carbon neutrality. Diversified fiscal and financial incentives should be provided to support digital infrastructure and green innovation. Second, regulatory and institutional systems should be improved through unified environmental disclosure standards, mandatory reporting of green loan proportions and emission reduction performance, and real-time monitoring mechanisms for carbon impacts to enhance policy transparency and effectiveness. Third, technological and regulatory coordination should be advanced by promoting green digital infrastructure such as 5G networks, data centers, and optimized computing resources, while establishing regulatory sandboxes to pilot emerging technologies including blockchain-based carbon tracking. Finally, international engagement should be strengthened by participating in global green finance governance, promoting cross-border green finance certification, and facilitating international capital flows into low-carbon sectors through instruments such as green bonds and climate investment funds.
Regionally Differentiated StrategiesGiven substantial regional heterogeneity, digital finance policies should be tailored to local development conditions. In central and western regions, priority should be given to strengthening digital financial infrastructure through expanded mobile payment coverage, smart service outlets, and regional green innovation funds that support commercialization of clean energy and energy-saving technologies. In eastern regions, policy emphasis should shift toward structural optimization and risk management, including the use of big data and artificial intelligence to enhance green credit assessment and the establishment of early-warning systems to prevent carbon lock-in in high-emission industries. For resource-dependent cities, policy efforts should focus on industrial transformation through digital empowerment, promoting intelligent energy-efficiency monitoring, upgrading high-energy-consumption industries, and integrating digital tools with agriculture and tourism to cultivate diversified low-carbon industrial ecosystems. Such region-specific strategies can ensure that digital finance contributes effectively to balanced and inclusive green transformation.
Financial Institutions and Market-Level ActionsAt the micro level, financial institutions should play a central role in translating policy goals into practical outcomes. They should develop differentiated digital financial products tailored to the needs of firms and households, such as green inclusive loans that incorporate carbon emission intensity into interest rate pricing and digital “carbon accounts” that reward low-carbon consumption behaviors. Support for green technology innovation should be strengthened through collaborations among financial institutions, universities, and research centers, using mechanisms such as intellectual property pledge financing, specialized green venture funds, and technology incubators. In addition, diversified green financial instruments—including green bonds and carbon-neutral themed wealth management products—should be expanded to attract private capital into sustainable sectors. To safeguard financial stability, institutions should establish integrated green risk management systems that incorporate environmental indicators into credit assessment and apply AI-based monitoring tools to dynamically adjust credit exposure according to firms’ emission performance.
The carbon emission reduction potential of digital finance can be maximized through a coordinated three-tier policy framework. At the macro level, strengthening national governance and institutional design is essential to provide unified standards, regulatory support, and strategic guidance. At the regional level, differentiated policies tailored to local resource endowments and development stages are needed to ensure balanced and effective green transformation. At the micro level, financial institutions should enhance product innovation, risk management, and technology application to translate policy goals into practical outcomes. Future policy design should therefore integrate top-down institutional coordination with bottom-up market implementation, leverage the complementary strengths of traditional and digital finance, and ultimately achieve the dual objective of economic growth and carbon emission reduction.
The dataset generated and analyzed during this study is available upon reasonable request.
Conceptualization, BZ, VA and JS; Methodology, BZ; Formal Analysis, BZ, VA and JS; Investigation, BZ, VA and JS; Writing—Original Draft Preparation, NMH; Writing—Review & Editing, VA and JS.
The authors declare that there is no conflict of interest.
This research has no funding.
1.
2.
3.
4.
5.
6.
7.
8.
9.
10.
11.
12.
13.
14.
15.
16.
17.
18.
19.
20.
21.
22.
23.
24.
25.
26.
27.
28.
29.
30.
31.
32.
33.
34.
35.
36.
37.
38.
39.
40.
41.
42.
43.
44.
45.
46.
47.
48.
49.
50.
51.
52.
53.
54.
55.
56.
57.
58.
59.
60.
61.
Zhao B, Aumeboonsuke V, Su J. Digitalization for Sustainability: Unpacking the Mechanisms of Digital Finance in Reducing Carbon Emission. J Sustain Res. 2026;8(2):e260031. https://doi.org/10.20900/jsr20260031.

Copyright © Hapres Co., Ltd. Privacy Policy | Terms and Conditions


