Location: Home >> Detail
J Sustain Res. 2019;1:e190016. https://doi.org/10.20900/jsr20190016
 ,
Steve MacFeely 1,3,
Anu Peltola 1,*
,
Steve MacFeely 1,3,
Anu Peltola 1,*
1 United Nations Conference on Trade and Development, Geneva, CH-1211, Switzerland
2 ThÉMA, L'École Supérieure de Commerce de Tunis, Manouba University, Tunis, 2010, Tunisia
3 Centre for Policy Studies, University College Cork, Cork, T12 XF62, Ireland
* Correspondence: Nour Barnat, Tel.: +41-229177919; Anu Peltola, Tel.: +41-229174113.
This article belongs to the Virtual Special Issue "The Sustainable Development Goals (SDGs): Underpinning and Contributing to Sustainability Research"
Economic empowerment is a relative latecomer to the gender equality discussion, and to the global development agenda. This paper presents a comparative study of selected global gender inequality indices: The Global Gender Gap Index (GGI); the Gender Inequality Index (GII); and the Social Institutions and Gender Index (SIGI). The purpose of the study is to analyse the proportion of variation explained by economic conditions in these gender equality indices. A Principal Component Analysis approach is used to identify the most important factors or dimensions, such as, health, social conditions and education, economic and labour participation and political empowerment that impact on gender and drive gender inequality. These factors are compared with the Sustainable Development Goal targets to assess how well they align. The findings show that while economic participation and empowerment are significant factors of gender equality, they are not yet fully considered by gender equality indices which mainly focus on labour force participation. In this context, the paper also discusses the absence of international trade, a key driver of economic development, from the gender equality measures and makes some tentative recommendations for how this lacuna might be addressed in existing or future composite indices.
AAAA, Addis Ababa Action Agenda; EIU, Economist Intelligence Unit; GII, Gender Inequality Index; GGI, Global Gender Gap Index; KMO, Kaiser-Meyer-Oklin; MDGs, Millennium Development Goals; OECD, Organization for Economic Cooperation and Development; PCA, Principal Component Analysis; PC1, Principal Component 1: Education and Social Conditions; PC2, Principal Component 2: Economic and Labour Participation; PC3, Principal Component 3: Political Empowerment; PC4, Principal Component 4: Health; SDGs, Sustainable Development Goals; SIGI, Social Institutions and Gender Index; UN, United Nations; UNCTAD, United Nations Conference on Trade and Development; UNDP, United Nations Development Programme; WBLI, Women, Business and the Law Index; WEOI, Women’s Economic Opportunity Index; WEF, World Economic Forum
Gender equality can be said to have been achieved when women and men enjoy the same rights and opportunities across all aspects of life, including social interactions, economic participation and decision-making, and when the different behaviours, aspirations and needs of women and men are equally valued and favoured. A range of composite indices have been developed by various organisations in an attempt to measure and quantify these complex issues. Furthermore, the 2030 Agenda for Sustainable Development (hereafter the 2030 Agenda) contains over 80 gender-relevant indicators including a specific goal on gender equality.
This paper presents a comparative study of three global gender inequality indices: The Global Gender Gap Index (GGI); the Gender Inequality Index (GII); and the Social Institutions and Gender Index (SIGI). The purpose is to analyse the proportion of variation explained by economic aspects in these gender equality indices. A Principal Component Analysis (PCA) approach is used to identify the most important factors or dimensions, such as, health, social conditions and education, economic and labour participation and political empowerment that impact on gender and drive gender inequality.
Following this introduction, the paper provides some background on the emergence and evolution of gender equality as an issue in the Millennium Development Goals (MDGs, http://www.un.org/millenniumgoals), the Addis Ababa Action Agenda and the Sustainable Development Goals (SDGs). Section “GENDER EQUALITY AND ECONOMY” anchors the discussion on academic research that has analysed the interactions of gender equality and the economy. Section “DATA AND SELECTED GENDER EQUALITY INDICES” details the three composite indices analysed in this paper, mentions some others that are not and presents the data used as a basis of the analysis. Section “GENDER EQUALITY BY REGION” presents the descriptive results of the gender equality indices by region. Sections “METHODOLOGY” and “PRINCIPAL COMPONENTS OF GENDER EQUALITY INDICES” explain the methodology and the Principle Component Analysis (PCA) results, respectively.
The paper closes by a discussion and conclusions. The discussion highlights some important findings and implications from the statistical analyses, and especially considers the absence of international trade from the gender debate, and in particular, from all three global indices, despite their inclusion of economic participation. Some conceptual work prepared by the United Nations Conference on Trade and Development (UNCTAD) is summarised and used as the basis to make some tentative recommendations for possible indicators that could be used to fill this omission in existing or future composite indices. Some additional details of the underlying variables of the composite indices are provided in Appendix A1.
Article 1 of the 1948 Universal Declaration of Human Rights [1] states “All human beings are born free and equal in dignity and rights”. Thus, gender equality is a basic human right. In 1979, the United Nations General Assembly adopted the Convention on the Elimination of All Forms of Discrimination against Women [2]. Adopting such a women-specific treaty was considered necessary because, notwithstanding the existence of general human-rights treaties, as the preamble points out, extensive discrimination against women continues to exist.
Gender refers to the roles, behaviours, activities, and attributes that a given society at a given time considers appropriate for women and men (UN Women, Gender Equality Glossary). The United Nations has set gender equality rather than gender equity as a goal. Gender equity denotes an element of interpretation of social justice, usually based on tradition, custom, religion or culture, which is most often to the detriment to women. In other words, gender equity “is the process of being fair to women and men” [3]. Gender equality is a broader concept that includes the empowerment of women. It cannot exist without gender equity.
There are many definitions of gender equality. UN Women defines equality between women and men (gender equality) as: the equal rights, responsibilities and opportunities of women and men and girls and boys. Gender equality implies that the interests, needs and priorities of both women and men are taken into consideration, recognising the diversity of different groups of women and men [4]. The International Labour Organization [5] defines gender equality to mean that women and men have equal conditions for realising their full human rights and for contributing to, and benefiting from, economic, social, cultural and political development. It is based on women and men being equal in their home, their community and their society.
Recently, recognition of the importance of women’s economic empowerment has grown notably, so that it is now acknowledged on the global development agenda, including the Addis Ababa Action Agenda and the 2030 Agenda.
Gender equality is a precondition for development and poverty reduction. Empowered women contribute to the health and productivity of families, communities and nations. In 1995, the Beijing Declaration and Platform for Action noted that “insufficient attention to gender analysis has meant that women’s contributions and concerns remain too often ignored in economic structures, such as financial markets and institutions, labour markets...” and “as a result, many policies and programmes may continue to contribute to inequalities between women and men” ([6], para. 155). The Platform for Action called for statistics “on the full contribution of women and men to the economy, including their participation in the informal sectors” ([6], para. 206).
Goal 3 of the MDGs had the broad aim of promoting gender equality and empowering women. The MDG progress report [7] noted improvements in achieving gender parity for education as well as other aspects of gender equality beyond the formal target, such as, improvements in women’s access to paid employment and political representation. Despite these improvements, the report noted that women continue to experience significant gaps in terms of poverty, labour market participation, wage parity, as well as participation in private and public decision-making [8].
In 2015, the Addis Ababa Action Agenda strengthened the focus on women’s economic empowerment by stating that “evidence shows that gender equality, women’s empowerment and women’s full and equal participation and leadership in the economy are vital to achieve sustainable development and significantly enhance economic growth and productivity” ([9], para. 21). It also recognised “the critical role of women as producers and traders” ([9], para. 90) and the importance of facilitating “women’s equal and active participation in domestic, regional and international trade”.
The 2030 Agenda [10] took a broader view of gender equality than the MDGs, and it aimed to end all forms of discrimination and violence against women and girls everywhere. The SDGs (http://www.un.org/sustainable development/sustainable-development-goals/) also aim to eliminate harmful practices such as forced marriages and genital mutilation and ensure universal access to sexual and reproductive health services. The new wider agenda also sought recognition of the contribution and value of unpaid and domestic work, and to ensure that women can fully participate in economic, political, social and public life at all levels, including access to economic, financial and technological resources (https://unstats.un.org/sdgs/metadata/).
Extensive research has been carried out to analyse the interactions of gender equality and the economy. UNCTAD [11] identified a two-way causality between gender equality and economic growth: Economic growth affects gender equality in many ways, but gender biases also influence macroeconomic outcomes, such as growth, trade, imbalances and inflation.
Several researchers found that economic growth benefits from improved gender equality, for instance in education, employment and access to finance [12,13]. However, this may sometimes go in the opposite direction. Businesses producing certain labour-intensive goods may base their comparative advantage on women’s lower wages. An analysis of 92 countries [14] found that countries with a larger gender wage gap had higher exports of labour-intensive goods. At the same time, gender inequality in labour force activity rates and educational attainment rates was negatively linked with the comparative advantage of labour-intensive industries. To understand these dynamics, one at least needs to take into consideration the gender aspects of pay gaps, labour force participation and educational attainment.
These opposite effects illustrate the complex interrelation of gender equality and the economy. The picture is also further complicated by international trade that reflects the different roles and comparative advantages of countries in the global economy. It has long been recognised by development economists that international trade has an impact on development. Whether one subscribes to the Ricardian orthodoxy that free trade is key [15,16] or veer towards a more heterodox view that, depending on a variety of circumstances, trade creates winners and losers [17–20]; either way, it is accepted that trade plays an important role in development. The importance of that role in the development process is widely accepted today—see Monterrey Consensus [21]. In fact, reviewing the progress made by development economics, the eminent economist Sir Arthur Lewis (quoted in Yergin and Stanislaw, 1998 [22]) identified the underestimation of the power of international trade to propel growth as a fundamental and costly error.
A number of academic studies also look at the dynamics of gender equality and trade. High gender equality is not necessarily a guarantee of equality in trade. Kucera and Milberg [23] found that the expansion of trade between OECD countries and developing economies between 1978 and 1995 resulted in disproportionate job losses for women in OECD countries, as most workers were women in import-competing industries, such as textiles, footwear and leather. The same finding was made for agricultural economies, where women are concentrated in import-competing sectors such as food crop production [24], and in Africa, where Seguino and Grown [25] found that tariff reductions on labour-intensive imports resulted in higher job losses for women than for men.
A recent study by Statistics Finland [26] found that the benefits from international trade were not distributed equally between women and men in Finland. In 2016, 18 per cent of entrepreneurs in exporting firms were women, and women accounted for 27 per cent of the labour input of exporting firms on a full-time equivalent basis. While trading enterprises were, on average, more productive and generally paid higher salaries compared to other firms in Finland, they employed less women and had a higher gender wage gap. The results also showed that female business owners hired more women and more highly skilled women than male business owners. This suggested that lower participation of women in international trade may also exacerbate differences in capital and salary incomes between women and men.
UNCTAD [27] studied the impacts of trade liberalisation and noted that it may strengthen financial independence and agency of women at the household level in addition to providing income and employment opportunities. However, increased international competition can also push wages down, especially for employees in low-skilled jobs without strong bargaining power. Trade may affect women and men positively or negatively depending on the sector; whether the sector expands or contracts in production; and depending on how international competition affects the local labour market.
Some of the gendered outcomes of trade relate to the differences in how women and men participate in trade. According to OECD’s analysis [28] of gender in global value chains, men’s share of jobs at exporting firms was relatively high, while women were more often employed by suppliers of the exporting firms. Women’s jobs were also much more often in the service sector, rather than in manufacturing [11]. This implies that in addition to participation rates, gender equality outcomes depend on the sector, status in employment and types of jobs held by women and men.
The above snapshot of research shows that the interaction between gender equality, the economy and trade vary by sector, country and the specific conditions in each economy. Trade as a driver of economic development can either exaggerate existing inequalities, create new inequalities or contribute to more equal engagement of women and men. The absence of the trade story in any discussion is therefore a significant lacuna.
To provide a good general overview of the global situation, three different gender indices are presented and contrasted in this paper: (a) the Global Gender Gap Index (GGI), (b) the Gender Inequality Index (GII) and (c) the Social Institutions and Gender Index (SIGI). These indices have been selected for three reasons: (1) they have the widest country coverage; (2) they are constructed as composite indicators suitable for the PCA method; and (3) they are regularly updated and so the data are reasonably fresh. A brief summary of each of the indices is provided below:
1.
2.
3.
There are other composite indicators measuring gender equality. For instance, the World Bank compiled a gender equality index, the Women, Business and the Law Index (WBLI) for 187 countries. This index is structured around eight sub-indicators that cover different stages of a woman’s working life and have significance for the economic standing of women [32]. The sub-indices are highly correlated, as they all focus on legal aspects, and as a consequence the analysis methods used in this paper cannot be applied to this index.
The Women's Economic Opportunity Index (WEOI), compiled by the Economist Intelligence Unit (EIU) looked beyond gender disparities to the underlying factors affecting women’s access to economic opportunity in the formal economy [33]. The index was first published in 2010 by EIU in cooperation with the World Bank. The index looked at: labour policy and practice; access to finance; education and training; women’s legal & social status; and the general business environment. Ideally this index would have been incorporated into this study, however it has not been updated since 2012, and therefore could not be used.
New gender equality indicators continue to emerge at regional, national and international levels. New global gender indices are also being developed. In June 2019, the Equal Measures 2030 published a new SDG Gender Index aligned to 14 of the 17 SDGs in 129 countries and covering 51 issues ranging from health, gender-based violence, climate change, decent work and others. The index includes indicators on SDG 8, many of which related to economic aspects of gender equality, such as wage equality, vulnerable work, bargaining rights in law, workplace equality and ownership of bank accounts. This would be an interesting index to include in future analyses, but for the moment, while the data are publicly available, they are not available in a downloadable file, this index has been excluded.
The European Gender Equality Index, developed by the European Institute for Gender Equality, assesses gender equality across European Union member states (https://eige.europa.eu/gender-equality-index/2015), and the African Gender Equality Index, developed by the African Development Bank, combines gender-differentiated outcomes and data on social institutions that influence the gender gap (www.afdb.org/en/topics-and-sectors/topics/quality-assurance-results/gender-equality-index/). These indices were not used as their coverage is regional only.
 Table 1. Summary of gender inequality sub-indices used in the analysis.
The three gender equality indices combine 15 sub-indices used as their inputs. Table 1 provides a description of all variables and sources. The gender equality indices collectively covered 194 countries (observations). Individually, the GII had data for 159 countries (at the aggregate level); the SIGI for 107 countries; and the GGI for 149 countries. These of course varied, indicator by indicator. For the 15 sub-indices of interest, data were only available for 114 countries. Therefore, the PCA was conducted only for these 114 countries. It should be noted that this sample nevertheless represents 87 per cent of the world’s population (in 2018).
Despite some differences in the source data and methodologies, a comparison of the selected gender composite indices at regional level reveals similar results (see Table 2). The table compares the gender equality ranking of regions according to four gender indices: SIGI, GII and the GGI.
 Table 2. Comparison of rankings provided by Gender Equality Indices by Development Status and Geographic Region (latest year available).
In order to compare ordinal rankings at regional level, the compositions of the geographic regions had to be standardised across the indices, as they do not use the same nomenclature or definitions. Across the three indices, there is a very high consistency at a regional level. Two of the three indices (GGI and SIGI) rank all of the development status and regions in the same order. It is only the GII that has a different ranking, but it should be noted that the GII has quite a low representation for Latin America and the Caribbean countries. All three indices rank developed countries as first. If the remaining “developing” regions are distilled into top half (ranked 2–4) and bottom half (ranked 5–7) performers, we see that all indices place Europe & Central Asia, Latin America & the Caribbean and East Asia & Pacific in the top half. As noted already, the GGI and SIGI have exactly the same order, whereas the GII has a different ranking with the two halves. What is clear, is that all indices judge women in sub-Saharan Africa, the Middle East and North and South Asia to experience the most gender inequality.
There is, however, much more variation in the scores for the different indices at country level. This should not be surprising as it would be extremely difficult for an individual country to score consistently well or poorly across the wide variety of sub-indicators employed by the various indices. Nevertheless, although individual rankings may differ, some countries appear in the top 10 rankings for several of the indices. For example, in Table 3, Switzerland is ranked first by the SIGI and GII, but does not even appear among top 5 in the GGI. In contrast, Belgium was only ranked third by the GII, fifth by the SIGI and didn’t even feature in the top 10 for the GGI (Belgium was ranked 28th).
Sweden, for instance, is ranked second by GII and GGI and third by the SIGI. Several countries (Belgium, Denmark, Finland, Norway and Switzerland) all appear in the top 10 of at least two of the three indices. Apart from Sweden, Slovenia is the only other country that is ranked in the top 10 across all three indices. Van Staveren [34] who conducted a comparative of five country composite gender indices, including the GII, GGI and the SIGI found the same result.
 Table 3. Comparison of country rankings according to Gender Equality Indices.
A similar pattern is also evident at the other end of the scale. Here also a surprisingly high degree of consistency is evident. Yemen is ranked as having the highest gender inequality by the three indices (SIGI, GII and GGI). Pakistan also appears in the very bottom of two indices; ranked as having the second highest inequality by the GGI and SIGI. Chad also appears at the bottom end of two of the three indices, identifying it as among the countries with some of the worst gender equality.
The indices, thus, reflect the diverse realities of gender inequality at country level that largely overlap but do not exactly match. They indeed rely on different methodologies, weightings and most notably, input variables, accounting for disparities across the respective country rankings.
A dimensionality reduction technique is required to interpret such high-dimensional datasets. Whatever technique is selected must ensure that as much of the information (variability) as possible in the data is safeguarded. Several techniques have been developed to achieve this objective. Principal Component Analysis (PCA) is the most common multivariate statistical method used traditionally for this purpose. Other techniques include factor analysis [35,36]; the unobserved components or multiple-indicator model [37]; the Cronbach coefficient alpha [38] or other methods of regression analysis. Each of these approaches has advantages and disadvantages and several studies discuss these techniques and their development (see [39–41]). For our purposes, that of reducing the dimensionality for a set of continuous variables while preserving as much information from the original variables as possible, PCA is the most suitable methodology, as it optimises the dual challenge of reducing the linear dimensions and also minimising the mean-square error [42,43]. Consequently, in this study, we use PCA to identify the most important factors or dimensions underlying the selected gender equality indices. PCA is a multivariate statistical technique that reduces the observed variables to orthogonal principal components that explain as much of the variance in the data as possible (see Jolliffe, 2002 [44] for more information).
PCA helps to emphasise patterns among multivariable data. It uses orthogonal linear transformation to identify a vector in N-dimensional space. This first principal component (PC1) accounts for the maximum amount of the total variability in a set of N variables, where the total variability within the data is the sum of the variances of the observed variables, when each variable has been standardised (to have a mean of 0 and a standard deviation of 1). A second vector (PC2), orthogonal to the first, accounts for the maximum of the remaining variability in the original variables. Each succeeding PC is linearly uncorrelated to the others and accounts for the maximum of the remaining variability [44].
PCA can, therefore, be used as descriptive, statistical approach to data transformation to overcome variable incommensurability. The ranking of the principal components in order of their significance is denoted by the eigenvalues related to the vector for each PC. This type of analysis is well suited for assessing whether there is an economic component to the gender indices, and if so, how large part of the variance it explains as compared to other components.
We conceptualise the PC scores associated with the multiple variables of inequality. As none of the 15 inequality sub-indices were highly correlated, all 15 were retained in the PCA analysis. By retaining only those PCs that account for a substantial proportion of the variability in the original data, a smaller number of independent indices of gender inequality can be generated.
Before undertaking any analyses, the original variables had to be transformed and standardised, in order to make them comparable (as they were measured using a variety of different units and scales). Furthermore, the variables were normalised, meaning they have: (i) a standard deviation equal to one; and (ii) a mean equal to zero. Transformation was achieved by subtracting for each observation, the variable’s mean and dividing by the variable’s standard deviation. Normalisation was done to avoid large differences in scale or variance between variables. Some of the sub-indices also had to be inverted to facilitate interpretation of the PCA results. This was achieved by deducting the original figure from the theoretical maximum value of the sub-index. The actual maximum value was used in the absence of a clear theoretical maximum. Following transformation, all sub-indices demonstrated improved behavior.
The results presented here correspond to PCA with orthogonal rotation. We proceed to orthogonal rotation to maximise the variance of coefficients. We increase the explained variance of the sample by the components and reduce the unexplained variance. The rotation also increases the specificity of each component which allows a more precise component analysis. Furthermore, to compare ordinal rankings at regional level, the compositions of the geographic regions had to be standardised across the indices, as they do not use the same nomenclature or definitions.
We test the appropriateness of using PCA by reviewing the correlation of variables. The correlation between variables is high, which confirms that the PCA analysis is appropriate for these data (see Table 4).
In addition, The Kaisere-Mayere-Olkin (KMO) sampling adequacy test values were >0.5 (Health and Female Labour participation > 0.4), and the overall value was close to 1, suggesting that the variables were suitable for PCA analysis [45]. Also, the inter-variable correlation (correlation matrix) contains several small-moderated sized correlations (>0.3) (see Table 5).
 Table 4. Correlation matrix.
 Table 5. Kaiser-Meyer-Oklin (KMO) test.
The study uses a graphical method, known as the Catell’s scree test [46] (Figure 1). These are plots of each of the eigenvalues of the factors (see Table 6). One can inspect the plot to find the place where the smooth decrease of eigenvalues appears to level off. To the right of this point, only ‘factorial scree’ is found. After examining the scree plot, four factors were extracted for analysis. Only components for which the value (proper values) is greater than 1 (Kaiser rule) are retained and used, i.e., only components which have minimum explanatory power.
 Figure 1. Scree plot of eigenvalues of factors after PCA.
 Table 6. Unrotated coefficients of the four principal components.
This analysis is not motivated by a criticism of gender composite indices nor is it intended to compile further country rankings, but rather to understand the underlying key messages of the indices. One disadvantage of composite indices is that they can be difficult to interpret from a policy perspective, especially if they comprise many sub-indices in one measure. While the gender indices analysed in this paper are accompanied by detailed narrative that provide context and support interpretation, PCA allows further analysis of what explains the variation of the indices. Such analysis can help policy makers to understand in more broad or general terms, how their country is performing, i.e., in the context of gender equality, where they are doing well and what aspects or dimensions need improvement. In particular, it allows us to examine the significance of the economic dimension of gender equality as reflected by the source variables covered by the selected gender indices.
A PCA of 15 sub-indices is presented for the three gender indices described above: GGI, GII and SIGI. The PCA allows for a more synthetic overview of inequalities captured by the indices. The PCA technique aims to explore relationships between dependent variables and retain as much information as possible. The analysis not only identifies correlations between the different sets of input variables but also highlights similarities across countries in terms of their strengths or weaknesses in gender inequality.
Using PCA, we identify four principal components of gender equality. After an analysis of the sub-indices covered in each component, we name the four principal components as follows: Education and Social Conditions (PC1); Economic and Labour Participation (PC2); Political Empowerment (PC3); and Health (PC4). PCA doesn’t interpret the results. It is necessary to analyse and find an appropriate appellation for each of the components or pillars. Together, these four principal components explain 72 per cent of the total variance in the 15 indices that comprise the GGI, GII and SIGI gender equality indices.
Table 7 presents the four components and their contribution to the overall explanatory power of the results. The contribution of each of the 15 indices to explaining the variance in the observed variables is also presented. For example, the first component, education & social conditions accounts for 35 per cent of total variance. The second component accounts for 16 per cent of the remaining variance. The third and fourth components explain more than 21 per cent of the remaining variance (It should be noted that each additional component has two important characteristics. First, it accounts for a maximal amount of variance in the data set that was not accounted for by the previous component and second, it is uncorrelated with all other components).
 Table 7. Retained Principal Components (eigenvectors).
Although our primary interest is in the economic dimension, PCA pillar results are traditionally juxtaposed with the first principal component (PC1), in this case, termed “Education & women’s social conditions” as this has the greatest explanatory power (Education and reproductive health are of crucial importance to gender equality. Investment in these areas will be important to ensuring female empowerment and gender equality, especially in developing countries. See https://www.un.org/youthenvoy/2016/03/education-reproductive-health-girls-key-sustainable-development/). The name given to the pillar indicates which indicators accounts for the most variability. PC1 accounts for 35 percent of the total variance (see Table 7). Education is identified as an important factor, both for male and female. Reproductive health also has a strong influence on the component. It should be noted that higher education levels for women and men appear to be linked to lower maternal mortality and adolescence at birth.
While the social component explains the largest share of variation, we identify a strong component linked to economic aspects of gender equality. The second component (PC2), “Women’s economic and labour market participation” is driven mainly by female participation in the labour market & economic participation (measured by salaries, participation and leadership) and discrimination within the family (child marriage, household responsibilities). The latter, discrimination in the household (loading is in the opposite direction), can influence women’s possibilities to participate in the economy.
The third component, “women’s political participation”, is measured by the female share of seats in parliament, political empowerment (both with positive loadings—the term Loading is used to express the strength of the correlation between variables and factors) and restricted civil liberties (with a negative loading). The last component is heavily defined by health.
In Figure 2, gender equality in education & social conditions (PC1) is represented by the x-axis and gender equality in economic and labour market participation (PC2) by the y-axis. The closer a country is to the top right-hand corner (H, H), the better it performs with regard to the two first components of gender equality. Figure 2 illustrates a clear distinction between developed and developing countries in gender equality in education & social conditions. Countries can be categorised into three broad groups with regard to gender equality in education & social conditions:
●
●
●
 Figure 2. Education & social conditions vs. economic and labour market participation. Each country has its own x-axis and y-axis coefficient, called scores. Principal component scores are synthetic variable values associated to each sub-indices (row) and each factor (column). To compute the score for a given country for a given factor, one takes the sub-indices’ standardised score on each country, multiplies by the corresponding factor loading (PC1 and PC2) of the variable for the given factor, and sums these products. Source: authors calculations based on data from OECD, WEF and UNDP.
There is less dispersion between developed country groups in gender equality in economic and labour market participation than between developing countries. Developed countries are ranked between Switzerland (high participation) and Italy (low participation). Belarus, Benin, Colombia and Ghana, for instance, have a relatively similar score with New Zealand and Sweden.
Developed countries rank comparatively well not only in the education & social conditions, but also for economic and labour participation as well as for health (Figures 2 and 4). It is interesting to note that in sub-Saharan African countries, gender equality in economic and labour participation is relatively high, even though the overall scores in the gender indices show that these economies are among the least gender equal countries. South Africa, on the other hand, is very close to the developed countries’ group.
When we examine the data from a regional perspective, some patterns become clear. For example, the cultural and geographic heterogeneity of Asia and Oceania is evident in Figure 2. Countries from the Middle East or Western Asia all rank low for economic and labour market participation but are very spread across education and social conditions. In contrast, most of the East Asian countries rank quite high for economic and labour market participation, but similarly have a large spread for education and social conditions. Equally, the developing economies of Africa, generally clustered quite high on the economic and labour market, experience very wide dispersion along the x-axis (education and social conditions). Considerable gender discrimination is observed in some domains, like for example, political empowerment. This varies quite considerably by country (Figure 3). For example, while Yemen, Burundi and Tanzania have similar scores for education & social conditions, women in Yemen appear to be much less politically empowered relative to men compared with women in Burundi or Tanzania (Figure 3).
 Figure 3. Education & social conditions VS political empowerment. Each country has its x-axis and y-axis coefficient, called scores. Principal component scores are synthetic variable values associated to each sub-indices (row) and each factor (column). To compute the score for a given country for a given factor, one takes the sub-indices’ standardised score on each country, multiplies by the corresponding factor loading (pc1 and pc3) of the variable for the given factor, and sums these products. Source: authors calculations based on data from OECD, WEF and UNDP.
This heterogeneity helps to explain why country rankings can vary across the different gender equality indices (as do the different sub-index composition and the varied application of weights). For example, women in Rwanda appear to be clearly disadvantaged in education & social conditions compared with developed countries, yet Rwanda has the highest score for women’s political empowerment (Figure 3). Likewise, there is significant variation in political empowerment even within the group of developed countries. Gender equality in education & social conditions is equally high in Croatia and Sweden, but for economic & labour participation, and political empowerment, gender equality is much higher in Sweden than for Croatia (Figures 2 and 3). In contrast, Sweden ranks below Croatia for gender equality in health, albeit only slightly (Figure 4).
For economic and labour conditions, transition countries are clustered quite closely with developed countries, meaning for these domains they have relatively similar gender equality scores. With a few exceptions, the same is true for health. However, for political empowerment the similarity is less evident, with women in transition countries experiencing more gender inequality.
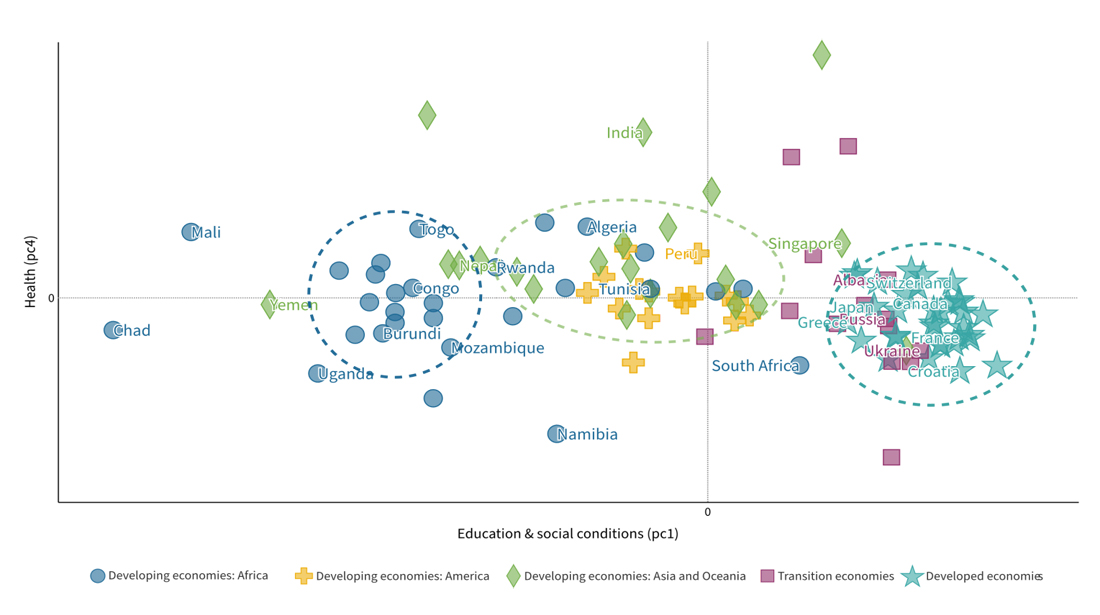 Figure 4. Education & social conditions VS health. Each country has an x-axis and a y-axis coefficient, called scores. Principal component scores are synthetic variable values associated with each sub-index (row) and each factor (column). To compute the score for a given country and for a given factor, the sub-index standardised score for each country is multiplied by the corresponding factor loading, in this case (PC1 and PC4), of the variable for a given factor, and the products are summed. Source: authors calculations based on data from OECD, WEF and UNDP.
There are likely to be multiple types of gender inequality occurring simultaneously within a country. Due to this complexity, it is difficult to design effective policy measures. It may help to distil the relevant information into clear messages that will facilitate a ‘focused’ policy response. The analysis presented in this paper is tailored to the second scenario, as it presents a synthesis of the multiple factors included in the selected gender equality indices. In doing so, it identifies the key components of gender equality—the factors that affect gender equality most. The analyses presented above highlights a number of issues. Firstly, it is clear that gender equality is a complex issue comprised of many moving parts. Consequently, there is probably no one set of policy prescriptions for a country to follow. Different countries will need to target or prioritise elements of health, or economic participation and so forth, depending on the local circumstances.
As noted above, one of the challenges or drawbacks with composite indices are the risks in interpreting them but can sometimes send misleading policy messages [47] and so caution is required [48]. To overcome this shortcoming composite indicators are often accompanied by a detailed narrative or a dashboard of sub-indices to support interpretation. Although this is the case for the analysed gender indices, key messages can still get lost within the forest of often contradictory sub-indices. Hence, the benefit of distilling the issues identified across several sub-indices, providing policy makers in countries with a set of metrics that allow them to understand trade-offs from a broader perspective, allowing them to prioritise their policy actions. For example, as Rwanda enjoys strong female political empowerment and economic participation, but weaker gender equality elsewhere, policy makers there might consider focusing their efforts on improving women’s education and social conditions.
The analyses presented in this paper suggests that inequality measured in the three composite indicators can be reduced to four main clusters that are of central importance to achieving gender equality, namely: PC1—Education & social conditions; PC2—Economic and labour market participation; PC3—Political empowerment; and PC4—Health. PC2 reflects the importance of female labour force participation and economic participation and economic opportunity. We argue however that the existing economic dimension has an important gap—international trade—and this gap narrows our understanding of the contribution of the economic dimension to gender equality. From a wider development perspective, the analyses suggest that in regard to acknowledging and addressing gender inequality comprehensively, the 2030 Agenda and the SDGs have made important strides in the right direction vis-à-vis the MDGs.
The MDGs had 21 targets, of which 13 could be considered gender related (Authors assessment: 1A, 1B, 1C, 2A, 3A, 4A, 5A, 5B, 6A, 6B, 6C, 7C and 7D). Mapping these targets to the four clusters identified above, we see they largely align with PC4 (Health) and PC1 (Education & social conditions). Only indicators 1A, 1B and 1C, which deal with improving income distributions, providing decent work and reducing hunger might be considered relevant to Economic & labour market participation (PC2). The MDGs did not address political empowerment (PC3) at all.
In contrast, of the 169 SDG targets and 232 SDG indicators, UN Women have identified 39 targets and 54 indicators as being gender related [49]. Currently, only 10 out of 54 gender-related indicators can be reliably monitored globally. Similar to many other SDG indicators, the gender indices suffer from problems of conceptual clarity (Established methodologies exist for 25 indicators but country coverage is insufficient to allow for global monitoring. The remaining 18 indicators still require some level of conceptual elaboration and/or methodological development before they can be used), data availability and data quality.
Mapping these indicators to the same four clusters, the greater recognition of Economic & labour market participation (14 targets and 17 indicators—targets 1.1, 1.2, 1.4, 2.3, 5.4, 5.5, 5.A, 8.3, 8.5, 8.7, 8.8, 8.9, 10.2 and 13.B) and Political empowerment (3 targets and 4 indicators—targets 5.5, 5.C and 16.7) is evident in the SDGs as compared to its predecessor, MDGs. For political empowerment, the SDG indicators represent the ambition of their corresponding targets reasonably well. That said, other choices, such as, the ratio of women to men in ministerial-level positions or the ratio of women to men in terms of years in executive office could also have been considered. Health (6 targets and 8 indicators—targets 3.1, 3.3, 3.7, 3.8, 4.2 and 8.8) and Education & Social conditions (18 targets and 24 indicators—targets 1.3, 1.B, 4.1, 4.2, 4.3, 4.5, 4.6, 4.7, 4.A, 5.1, 5.2, 5.3, 5.6, 5.B, 11.2, 11.7, 16.1 and 16.2) of course, remain important in the SDGs as was the case also in the MDGs (Astute readers will notice that the sum of targets by cluster (41) does not sum to 39. This is because 3 targets cannot be classified to a single cluster alone: 4.2 relates to both Health and Education & social conditions; 5.5 relates to both Political empowerment and Economic & labour market participation; and 8.8 relates to both Health and Economic & labour market participation). Gender equality is an important goal on the global development agenda. As discussed, the approach to gender equality on the global agenda has evolved and now considers the many aspects of gender equality. The focus on economic empowerment as a core element of gender equality has strengthened over the years. A review of the literature shows, however, that the interactions between gender equality and the economy are complex and may not be easily captured by using a few indicators. International trade, as a driver of economic development, is found to be a major factor influencing economic equality of women and men.
The Addis Ababa Action Agenda, in 2015, is the first to mention women’s equal participation in trade, and in December 2017 the significance of trade for gender equality was emphasised in the signing of the Buenos Aires Declaration on Trade and Women’s Economic Empowerment. To support governments’ rising policy commitment to developing trade policy as a tool for advancing women’s economic empowerment in trade, more evidence is needed.
Even without the inclusion of trade in the source variables, the economic dimension of the selected gender equality indices already explains a large share of their variation. It is the second most powerful component in explaining the gender equality indices after the education & social conditions component. The economic component of the selected gender indices comprises the female labour force participation rate (GII), economic participation & opportunity (GGI) and discrimination in family (SIGI). The economic participation & opportunity sub-index measures labour force participation rates, gender pay gap, the ratio of women to men among legislators, senior officials and managers and the ratio of women to men among technical and professional workers. It would be interesting to see what the inclusion of a couple of variables on gender equality in trade would do to the results.
Gender equality in trade may deviate from overall gender equality scores of countries. Finland, one of the countries with the highest scores in gender equality, finds notable gender inequality in trade participation and distribution of related benefits. While the spread in economic gender equality is highest for developing countries in Africa and Asia, countries with higher scores for the social component do not always receive highest scores for economic gender equality. In the economic dimension, country differences also seem to be relatively small between developed economies, while the research cited indicates that gendered outcomes of trade vary depending on the country’s economic structures, specialisation in the production of goods and roles in international trade.
Therefore, it is curious that across all three composite indices, there are no sub-indices on trade. Perhaps this reflects the complexity of gender-in-trade and the difficulties reflecting the gender dimension in trade statistics (see Figure 5).
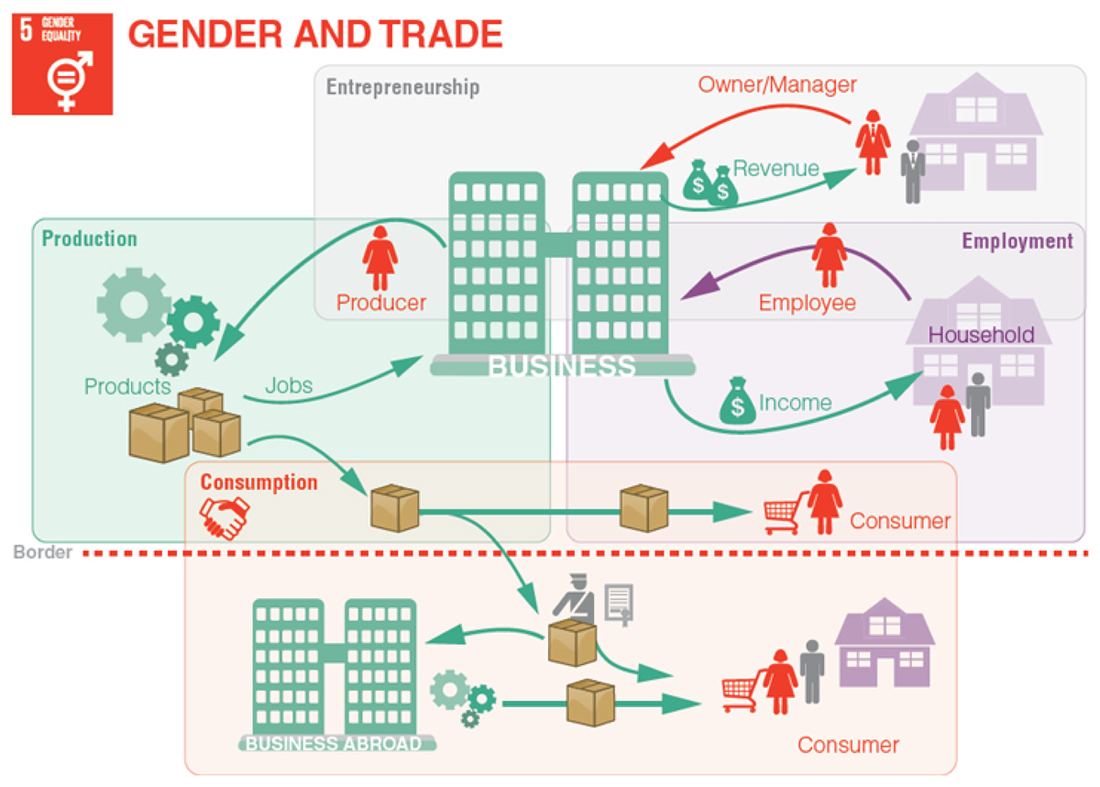 Figure 5. The roles of women and men in trade. Source: UNCTAD (2018, [50]).
Changes in trade impact the sectoral composition of the economy affecting job opportunities and the welfare of women and men. Trade and trade policies, therefore, can have important redistributive effects within an economy, which can magnify or reduce existing disparities, including gender inequality. The issue is that trade statistics cannot just be disaggregated by gender, since they do not collect information by sex. Such data needs to be linked across statistical domains or collected directly through additional surveys or survey modules. Klasen and Schüler (2009, [51]) highlight the challenges of using proxy indicators for identifying gender gaps. Nevertheless, that is the situation we may be faced with. They nevertheless suggest using achievements to circumvent problems of direct measurement. The analyses of women and men as traders could perhaps be measured by their roles in trade, including:
●
●
●
●
Our understanding of gender-in-trade would be greatly enhanced with the collection of data on the gender of entrepreneurs, self-employed and employees. That could facilitate comparisons with other indicators, such as, women’s and men’s employment and wages in exporting firms, female and male entrepreneurs’ trade participation, the profitability of their firms and the kinds of products they produce, etc.
Including indicators, such as: participation—women’s share of work input (FTE) in exporting and/or importing firms; income—women’s share of salaries paid by exporting and/or importing firms; entrepreneurship—share of female owned exporting and/or importing firms (only for businesses for which owners can be defined); management—share of female managed exporting and/or importing firms; and value added—share of female owned or managed enterprises in value added, in the GGI, GII or SIGI or in any of the regional or emerging global composite indices would represent progress, as it would begin to incorporate the complex but important gender-in-trade dimension of gender inequality. Ideally, these or other indicators would be compiled with an economic activity breakdown and would compare trading with non-trading firms (i.e., non-exporters non-importers). Until something along these lines happens, a major driver of development (whether positive or negative) is missing from these composite indices and from the wider gender debate.
Of course, more can be done. For countries with advanced statistical systems other more sophisticated indicators, such as, gender breakdown of management, or whether share of female entrepreneurs is higher among new exporting/importing firms could be delivered. Age and other relevant socio-demographic variables could also be linked to provide more in-depth analysis. This will entail linking business surveys with business registers or other files acquired from chambers of commerce or other organisations that keep registers of entrepreneurs. Indicators regarding the consumption of traded goods by gender is a trickier proposition. Household budget surveys are typically compiled at household level, making individual level data on consumption almost impossible to acquire. Some countries are experimenting with the use of data derived from retail loyalty programs, but these may not accurately describe individual consumption either.
Next year will mark the 25th anniversary of the Beijing Declaration and celebrate 25 years of championing women’s rights. It will also be the 5-year milestone for implementing the 2030 Agenda. To mark these milestones, and Buenos Aires Declaration on Women and Trade, the World Trade Organization has launched a series of discussions about the role of trade in gender equality and the urgent need for better data.
The retained principal components (eigenvectors) suggests that the economic dimension is an important explanatory pillar for gender inequality. But our review also shows that the trade and gender link has not been incorporated into any of the three main gender equality indices, although they all identify the importance of the economic dimension to gender equality. In the recent years, researchers and gender equality advocates have begun to pay increasing attention to economic empowerment, and this is reflected in the latest gender equality indices and the SDG indicator framework. However, current data limitations continue to limit the focus of economic empowerment on labour market and political participation. A number of suggestions have been presented for trade related indicators that could be incorporated into the mainstream gender indices. These are tentative and have not been tested and remain work for the future.
The absence of trade is a serious one, and one that limits the explanatory power of the existing indices with negative implications for policy makers who are using these indices to inform policy choices. As a consequence, government and trade policy makers, who are trying to incorporate a gender dimension into trade agreements (The 2017 Canadian–European Free Trade Agreement is a good example of this. In particular, it is implausible that gender gaps in earned incomes are very good proxies for gender gaps in consumption at the household level as resources are, at least to some extent, shared at the household level GDI with a simple gender gap index that would simply average the female-male gaps in human development achievements. In order to circumvent the problems with the earned income component, it was proposed to use a gender gap in labour force participation as the third indicator. Thus, the gender gap index would simply be the average of the ratios of female to male achievements in life expectancy), are now asking statisticians for better data in this area. The challenge for statisticians is to develop new statistical series that identify gender-in-trade and then have these indicators included in global gender equality indices.
The dataset compiled for this study are available from the authors on request.
All authors contributed to all aspects of the article, including selection of indices, data cleaning and preparation, statistical analyses, discussion of gender-in-trade concepts, and writing of the paper.
The authors declare that there is no conflict of interest.
The findings, interpretations and conclusions expressed in this paper are those of the authors and do not necessarily reflect the views of the United Nations, University College Cork or L'École Supérieure de Commerce de Tunis.
 Appendix A1. Source variables of the selected gender equality indices.
1.
2.
3.
4.
5.
6.
7.
8.
9.
10.
11.
12.
13.
14.
15.
16.
17.
18.
19.
20.
21.
22.
23.
24.
25.
26.
27.
28.
29.
30.
31.
32.
33.
34.
35.
36.
37.
38.
39.
40.
41.
42.
43.
44.
45.
46.
47.
48.
49.
50.
51.
Barnat N, MacFeely S, Peltola A. Comparing Global Gender Inequality Indices: How Well Do They Measure the Economic Dimension? J Sustain Res. 2019;1:e190016. https://doi.org/10.20900/jsr20190016

Copyright © 2020 Hapres Co., Ltd. Privacy Policy | Terms and Conditions


