Location: Home >> Detail
J Sustain Res. 2020;2(1):e200009. https://doi.org/10.20900/jsr20200009
 ,
Setu Pelz,
Òscar Monés-Pederzini,
Michele Andreottola,
Philipp Blechinger
,
Setu Pelz,
Òscar Monés-Pederzini,
Michele Andreottola,
Philipp Blechinger
Reiner Lemoine Institut, Rudower Chaussee 12, 12489 Berlin, Germany
* Correspondence: Martha M. Hoffmann, Tel.: +49-030-120-843-488.
This article belongs to the Virtual Special Issue "Sustainable Energy for Development"
Electrification efforts have long been a centralized, politicized and bureaucratic process heavily dependent on central grid extension. However, grid connection may not guarantee reliable supply and even grid-connected households can remain in lower tiers of electrification. By promoting the integration of solar home systems (SHS) in electrification plans, consumers could bridge blackout times and climb the ladder of electrification. To evaluate this potential, we perform a case study in Gauriganj district in Nepal based on primary survey data (2018), including real-time measurements of actual blackout occurrences. Offgridders, a self-coded open-source simulation tool based on the Open Energy Modelling Framework, is applied to determine the optimal grid-supporting capacities of multiple backup systems, including SHS and batteries. As a simplification, batteries are assumed to have a fixed lifetime of 5 years, while future fuel or electricity price changes are not considered. To compare the solutions, we propose the Effective Energy Supply Costs (EESC), calculated from the system’s annuity and supply reliability. For households of lower electricity demand (Tier 2) an SHS of approx. 10 Wp PV and 100 Wh battery powering a secondary DC circuit is the cheapest backup option at 21 €/a, supplying all daily demand not met by the grid. A household with higher electricity demand (Tier 4) is most cost-effectively served by a backup diesel generator, however the next cheapest solution is an SHS of approx. 40 Wp PV and 160 Wh battery, powering a secondary DC circuit during blackouts at 160 €/a. Encouraging investments in these decentralized renewable energy systems can support efforts towards achieving SDG7.
SHS, solar home systems; MTF, multi-tier framework of electrification
It is widely recognized that access to modern forms of energy is an essential prerequisite for overcoming poverty and promoting human development [1]. Improved living conditions by energy services are proven, but also social benefits and positive impacts on health and education can be observed [2–4]. Recognizing such benefits, the United Nations (UN) defined Sustainable Development Goal 7 (SDG7) [5], aiming at access to affordable, reliable, sustainable and modern energy for everyone by 2030.
Despite considerable progress in some regions, the goal of sustainable universal energy access is still far from being achieved. In fact the number of people without access to electricity was slightly below 1 billion (13% of the worldwide population) in 2017 [6,7]. Efforts to improve household access to modern energy supply have posed challenges to central grid infrastructure reliability. In regions with developing electrical infrastructure, the push for improving household access has been plagued by low quality electricity supply and blackouts [6,8]. For instance, according to [9] households connected to the grid in Uganda experience on average more than 100 hours of outages per month from an average of 10.7 outages per month, with mean outage duration of 10.1 h. Similarly, in Ethiopia, there are 8.2 electrical outages in a typical month with an average outage duration lasting 5.8 h [10]. In most sub-Saharan African countries, SHS can be a more reliable and more cost-effective solution for power supply compared to the central grid assuming future cost decreases of SHS [11].
While not the focus of this study, unreliable electricity supply also affects the operation of schools, hospitals and businesses negatively, and can potentially damage sensitive equipment [12]. Businesses specifically can experience power outages as limiting their economic growth. According to [13], electrical outages were perceived as constraining business growth in about 30% of developing countries in 2016, resulting in revenue losses of up to 2% of gross domestic product (GDP).
In the last decades, decentralized solutions such as mini-grids and solar home systems (SHS) have emerged as a viable complementary technology and are now included into electrification planning [14]. Independently of top-down electrification efforts, many consumers already pursue these solutions either to gain access for the first time or to increase supply reliability. Despite their role in providing access to rural households, decentralized renewable energy supply solutions are typically not counted in government electricity access statistics that instead focus on household connection to the national grid. To overcome the deficiency of binary electricity access measurement, the multi-tier framework (MTF) has been developed, measuring access to electricity according to seven attributes, namely peak available capacity, duration of service, affordability, legality, quality of voltage, reliability and health and safety [15]. The multi-dimensional measurement of electricity access enables the counting of household access to electricity from all sources, encouraging the inclusion of decentralized renewable energy technologies in planning efforts towards achieving SDG7.
With our paper we want to address several of the aforementioned issues in the provision of reliable energy supply. First, we see that often grid connected households have low power qualities and require backup solutions. Second, we see that the quality of supply should match the respective demand levels according to the MTF. There exist a research gap in assessing backup solutions or even off-grid SHS as viable options to improve household electricity supply levels based on the different levels of the MTF. We tackle this gap with a specific case study for Nepal.
Research ScopeNepal is a landlocked country at the foot of the Himalayas, between the People's Republic of China and India. It has a total population of 26.5 million [16] and is, based on the per capita gross domestic product, one of the least developed countries in South East Asia [17]. Around 81% of the total population live in rural areas, with only 72% of the people having access to electricity in these areas compared to 97% in the urban areas [18]. The national grid has a low supply reliability: On average 8.7 outages per month occur lasting about 3.6 h each (2013) [19]. As Nepal has abundant hydro-power and solar energy resources the government promotes programs for the electrification of rural areas based on renewable energies [20]. Both grid-strengthening and off-grid electrification with renewables is pursued, the latter mostly in the form of off-grid micro-hydro mini-grids and solar home systems (SHS). The location of our case study is the rural municipality of Gauriganj, in Province 1, far-eastern Nepal. It is characterized by a particularly high penetration of the grid (85% of households are estimated to be connected to the national grid [21]), while at the same time experiencing frequent grid outages.
Our work tackles the broad question of how to cost-effectively overcome grid outage issues from a bottom-up perspective in Gauriganj municipality. We use the MTF in order to define minimum electricity access requirements for two representative household demand profiles, classifying these as Tier 2 and Tier 4. We then define five different supply options, which are compared according to reliability and cost of supply: (1) Grid connection, (2) diesel backup, (3) battery backup, (4) solar home system backup, and (5) off-grid solar home system. In order to analyze and compare these options, we define the following research questions:
1.
2.
In order to address these questions, we use primary survey data and real-time grid availability measurements collected in Gauriganj in 2018 [21]. Applying Offgridders [22], a self-coded open-source simulation tool based on the Open Energy Modelling Framework [23], to the two representative household demand profiles, we determine optimal grid-supporting capacities of different backup solutions, namely SHS, batteries and diesel generators, and calculate the respective reliability and costs.
Real-time grid measurements were used to generate representative hourly grid availability profiles in the case study. Five Electricity Supply Monitoring Initiative (ESMI) data measurement devices [24] were installed across five locations in Gauriganj municipality. Specific locations were selected to represent peri-urban and rural areas of the municipality, as well as both central branches and fringes of the grid (see Figure 1). The installation took place in collaboration with the GIZ Nepal—Renewable Energy for Rural Areas Programme (GIZ-RERA). The measurement campaign was conducted for one full month, from 2018 Jul 1st until July 31st. The ESMI devices measured grid voltage at a household socket in 1-minute resolution.
For each ESMI sensor data time series, the 1-minute grid voltage data is converted into a binary grid availability variable. This is based on the assumption that electricity from the grid can be used to power appliances if the voltage stays between 180 and 240 V. Thus, voltage levels in that range indicate grid availability, voltages outside that range indicate blackouts or surges.
 Figure 1. ESMI sensor locations, in Gauriganj municipality, far eastern Nepal.
The hourly average of the binary grid availability variable is then calculated to reach the needed time scale of hourly profiles. Finally, the binary ESMI sensor datasets are merged, resulting in municipality-wide binary grid availability at 1-hour resolution for the month of July. From that, the likelihood of grid availability at each hour of a typical day is derived by grouping the resulting data set by hour of the day and taking the simple average. The resulting empirical grid reliability profile over a typical day, is visualized in Figure 2 (left). This typical daily profile is used as an input to generate a stochastic grid reliability profile for 365 days, resulting in a time series of Boolean values (1 = grid is available; 0 = grid is not available) for each hour of one reference year.
We compared the modelled annual grid reliability profile against the measured profile for the month of July 2018 using the root-mean-squared error (RMSE), mean absolute error (MAE), mean percentage error (MPE) and Theil’s U2 statistic [25], finding a reasonable fit (comp. Figure 2, right). Still, there are limitations to this methodology as the measurements only spread over a single month and seasonal or annual variations of blackout occurrences are not considered. Further, measurement errors might be included in the data series as households were told not to unplug the ESMI but still may have done so. This random effect is reduced by the fact that we use five sensors and aggregate the data across all of these.
 Figure 2. (A) Measured hourly grid reliability over a typical day. (B) Stochastic grid reliability model validation.
In early 2018, funded by GIZ Nepal under the RERA program in collaboration with the Alternative Energy Promotion Centre (AEPC), the Reiner Lemoine Institut (RLI) developed a detailed household energy access survey for application in rural Nepal, aligned with the MTF survey approach [21]. The main objective of the survey was the collection of primary data to support municipal energy planning through the assessment of current energy access, energy demand and household characteristics [21]. The survey was applied across 15 municipalities of Province 1 and Province 7 in rural Nepal between March and August 2018. As a result of the implemented sampling strategy, each sample of 400 households was representative at the municipal level [21]. This study focuses solely on the municipality of Gauriganj.
Demand Profile GenerationRepresentative basic and high demand household demand profiles were characterized based on the surveyed ownership rates of typical appliances. The basic demand profile includes all appliances owned by more than 50% of the respondents. The high demand profile includes all appliances that are owned by at least 15% of the respondents. In alignment with the energy access levels defined in the MTF these two profiles are labelled Tier 2 and Tier 4 in the following sections. The necessary assumptions regarding the appliances, including the quantity of a type owned by a household and AC as well as DC power ratings were defined based on a market study and literature review (Table 1).
All load profiles were generated with the aid of a stochastic load modelling function, written in R [21]. For each appliance the input consists of its availability window as well as the range of number of occurrences in the course of one day and each occurrence’s range of utilization duration. The parameters were defined based on a literature review on similar tools and appliance usages [26,35]. The stochastic load modelling function determines how often an appliance is used as well as the durations and starting time, from which it generates a 24-hour load profile. To account for high-power appliances being used for shorter periods, the profile is generated for 30-minute time steps and then averaged to hourly values. The flowchart in Figure 3 conveys the stochastic modelling process for a single appliance.
 Figure 3. Stochastic load modelling process flow chart for one appliance, source: [16].
The demand profile of a household results from the aggregation of the hourly load requirements of each appliance. To achieve an annual load profile this process is repeated automatically for each day in the year.
The generated profiles confirm the definition of basic and high demand households as Tier 2 and Tier 4 according to the MTF based on their daily average AC demand: The average consumption of the basic household amounts to 394 Wh AC/d (149 Wh DC/d), and the high demand profile amounts 3951 Wh AC/d (1377 Wh DC/d). Tier 2 is defined as consumption of around 200 Wh per day and Tier is defined as consumption of around 3400 Wh per day. The DC demand profiles generated are far lower than the AC profiles due to the assumed efficiency of DC appliances. Figure 4 shows an example DC demand profile of a Tier 2 household for a 3-day period in 30-minute time steps. The appliances are turned on stochastically in their assigned availability windows, generating a different load curve for each day.
 Figure 4. DC demand profile of Tier 2 in 30-minute time steps.
Nevertheless, the stochastic load modelling function has limitations in its methods and application. Firstly, an hourly demand profile relies on a simplification of high-power appliances’ power demand, either underestimating peak demand or overestimating consumption. Additionally, no seasonal variation has been included in the appliance usage parameters. Finally, while the availability windows and usage parameters are based on the survey data, it could be argued that there are still several levels of uncertainty regarding the accuracy of using survey data for demand assessment. This uncertainty is also subject of current research discussion. For example, [36] states that estimation based on survey data leads to an underestimation of the true electricity demand due to an unforeseen night base load and data gaps regarding morning peaks. On the other hand, [37] suggests that demand profiles based on survey data can overestimate true demand as users know the window of hours when appliances can be used, but not the actual average hours of utilization.
To determine the optimal backup capacities necessary to support an unreliable grid, the self-coded simulation tool Offgridders [22,38] is applied. It is based on the python-library Open Energy Modelling Framework (oemof) [23,39], which offers a platform to model various energy systems. oemof is a validated framework which has been applied for large system modelling of Europe [40] as well as for smaller case-studies [41]. Each model created with oemof builds up on basic components, consisting of sinks, sources, transformers and storages, all connected through unilateral (energy) flows with respective busses. Each component has several parameters describing its behavior and assigning costs or efficiencies to its flows. oemof transposes the model to a set of linear equations. The problem can then be optimized using different solvers resulting in the cost-optimal solution. For this paper, the cbc solver was used to solve the optimization problem.
The general energy system created with Offgridders is displayed in Figure 5. The components—grid connection, PV, battery, AC or DC demand, inverters and rectifiers—are included according to the respective scenario definition. An extended description of the linear equation system generated can be found in the Appendices.
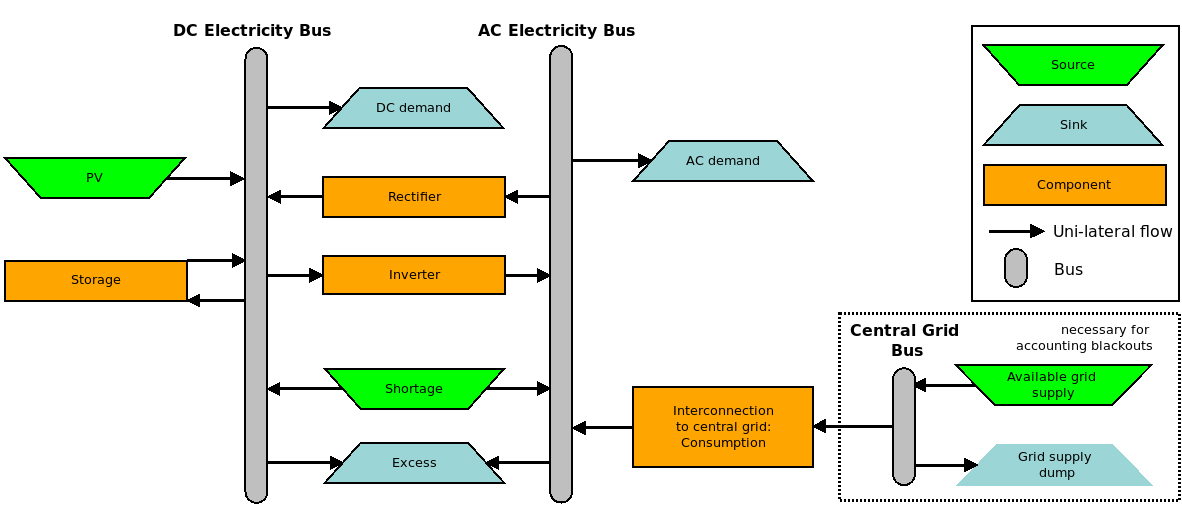 Figure 5. Energy system modelled with Offgridders. Components are (de-) activated depending on the scenario analyzed.
While the optimal capacities of the backup systems’ components are a direct simulation output, other indicators are calculated to ease scenario comparison. The equations are presented below. The supply reliability η is the ratio of annual electricity demand Edem to supplied electricity Espl:

The renewable factor RF is the ratio of electricity from renewable (PV) sources ERES and fossil (grid) consumption Efossil:

In addition to that, the levelized cost of electricity (LCOE) is calculated. It is based on the net present value (NPV) which monetizes all costs connected to the supply system, including the first-time investment costs C and all future cash flows CF composed of expenditures for operation, maintenance and fuel as well as asset replacement costs. The capital recovery factor CRF is used to determine the present value of a cash flow in year t and translates the NPV into an annuity, using discount factor d and project lifetime T.


It must be emphasized that the actual supplied electricity is used as the reference value, not the initially intended consumption. This implies an interdependence between system reliability factor and LCOE, but avoids that unreliable systems are assigned an unreasonable low LCOE due to high but potentially unsupplied demand in the denominator.
Scenario DevelopmentTo evaluate the potential of a number of system configurations that can provide backup to the unreliable national grid in Gauriganj, the following scenarios are evaluated:
1.
2.
3.
4.
a)
b)
5.
a)
a)
For Scenarios 4b and 5b we limit Tier 4 households to Tier 2 DC appliances as Tier 4 appliances are typically not available in the required DC form in Nepal. As a result, Tier 4 households are supplied less energy during blackout times in these scenarios (0.4 kWh/d DC), effectively experiencing supply shortage compared to their initial demand (1.4 kWh/d DC). All backup solutions are solely utilized to provide electricity to the consumers in case of a national grid blackout. Without a backup system (Scenario 1), the household’s electricity demand cannot be supplied during a blackout.
While electrification scenarios are typically compared based on their LCOE, we also compare these based on the system’s annuities, which are in form of annual payments for electricity supply. However, as in case of the national grid and in case of DC supply of T4 households, it is possible that an electricity supply solution cannot meet actual demand, which would not be considered in a comparison based on annuity alone. To overcome this shortcoming, we introduce the Effective Electricity Supply Costs (EESC) per year, which are calculated based on annuity A and the supply system’s reliability:

Two additional constraints were added into Offgridders prior to simulation (see supplementary materials). Firstly, the backup systems can only be used when the grid is experiencing a blackout, ensuring that the components are only used as backup devices but not as an electricity supply option equal to grid consumption. Secondly, a constraint for forced battery charge is introduced for the backup battery in “inverter” mode, avoiding oemof’s built-in dispatch optimization method, which uses perfect foresight.
The input for the simulation consists of the synthetic grid availability and demand profiles, a specific solar generation time series, system component costs (Table 2) as well as technical parameters (Table 3). The storage system represents a cheap lead-acid battery available at local markets. It has a constant throughput efficiency of 80%, and is operated with a DOD of 70%, resulting in a low lifetime of 5 years. Battery aging processes based on cycling are neglected. The PV system configuration was adapted to the Nepalese context and used to generate a specific generation profile from [42]. PV degradation is not considered.
 Table 2. System component costs, according to [43] and market study.
 Table 3. Technical input parameters.
A project duration of 20 years is assumed with a discount factor of 9%. For grid-connected Scenarios 1 to 4, it is assumed that the household’s grid interconnection has already taken place and possible connection costs are not included in the economic calculations. As the electricity tariff of the Nepalese national grid depends on the monthly consumption [44], an electricity price of 2.4 €ct/kWh is used for Tier 2 and of 7.9 €ct/kWh for Tier 4. In addition, the annual fixed connection fee of 2.8 € (T2) and 9.4 € (T4), respectively, are considered. For Scenario 4b additional DC devices for the secondary electricity circuit have to be bought. The costs are listed in Table 4, and sum up to a single investment of approximately 58 € for Tier 2 households and approximately 84 € for Tier 4 households. A diesel fuel price of 0.76 €/L is considered. Fuel and electricity tariff price changes are neglected as it is assumed that a decision regarding a backup system needed in the near future would be based on current energy costs.
 Table 4. Costs of DC appliances (limited to Tier 2 devices), based on local market research *.
We simulate the optimal (backup) system capacities, their reliability, LCOE and NPV using Offgridders. The detailed results are shown in Table 5 (Tier 2) and Table 6 (Tier 4). Supply solely through the main grid effects daily life heavily due to blackouts. The reliability of AC demand supply for Tier 2 consumers lies at 75%, while Tier 4 households have a slightly lower supply reliability of 72%. In terms of LCOE, a SHS with a secondary DC circuit (4b) appears to be the cheapest backup system for an unreliable national grid for a Tier 2 household. While this is also true for a Tier 4 household (5b), this configuration can by design cover only supply Tier 2 DC appliances during blackouts. The ranking of investment options however shifts, in case that system annuity or EESC are used for scenario comparison.
LCOEWhile supply through the national grid proves to be the cheapest solution for both households costing 5 and 9 €ct/kWh respectively, it cannot guarantee reliable supply and leaves about a quarter of demanded electricity unsupplied. Searching for solutions ensuring reliable supply is therefore important.
An autonomous off-grid SHS system would be the most expensive supply solution. For a Tier 2 consumer, AC supply could be realized at 52 €ct/kWh and DC supply at 41 €ct/kWh. A Tier 4 consumer could realize AC supply with an LCOE of 41 €ct/kWh, while supplying only DC demand is cheaper with 37 €ct/kWh. This, however, limits demand to Tier 2 appliances, effectively suppling 31% of the required services in terms of kWh. It is important to note that the increased costs per kWh of AC supply compared to kWh DC supply result from the discrepancy between AC and DC load profiles and the system’s configurations. As such, installing an AC system for a Tier 2 household has a three times as high NPV as installing a DC SHS delivering the same electricity-based services.
A battery backup system is less expensive than an off-grid SHS. Reliable supply can be reached with a battery capacity of 369 Wh for a Tier 2 consumer with an LCOE of 32 €ct/kWh and for a Tier 4 consumer with 2.6 Wh battery capacity at 29 €ct/kWh. Using a backup SHS to supply AC demand leads to an LCOE of 27 €ct/kWh for Tier 2 households at an optimal capacity of about 70 Wp PV and 216 Wh battery, resulting in a renewable share of 53%. A Tier 4 consumer can be lifted to reliable electricity access by installing 283 Wp PV and 2 kWh battery at 24 €ct/kWh with a renewable share of 30%. Compared to that, for both Tier 2 and Tier 4 households, a backup diesel generator has a lower LCOE of 18 and 19 €ct/kWh. The backup generators would have an optimal capacity of 160 W and 1.2 kW.
The cheapest solution to ensure that basic Tier 2 services are always supplied in blackout times is a SHS backup that supplies a secondary electricity circuit with DC appliances. The LCOE, even including the first-time investment costs into DC appliances, decreases to 17 €ct/kWh for Tier 2 and 11 €ct/kWh for Tier 4 households. An installation of 11 Wp PV and 101 Wh battery is required for a Tier 2 household, and for an Tier 4 household 38 Wp and 241 Wh battery. It is necessary to remark, however, that DC supply of a Tier 4 household can, due to the limited availability of DC devices, not power electricity-intensive Tier 4 appliances like fridges, rice cookers and water pumps. Therefore, although access to basic appliances is ensured, a large share of demand in kWh remains unsupplied (76%).
 Table 5. Optimized systems and their performance—Tier 2.
 Table 6. Optimized systems and their performance—Tier 4.
The system LCOE is a relative value based on the specific costs and electricity consumption in kWh per customer. This comparison can confound us if systems provide the same electricity service levels, i.e., power the same types of appliances, at different kWh consumption levels. This is especially important when comparing AC and DC systems. In contrast, an estimation of the annual costs of delivering electricity services, i.e., the system’s annuity, can ease communication and comparison of systems.
Based on their annuity, sole main grid supply continues to be by far the most cost-competitive option, resulting in annual electricity expenditures of 5 €/a (Tier 2) and the second best for Tier 4 at 90 €/a respectively. A backup SHS supplying DC in times of blackout (4b) is the best reliable option to ensure Tier 2 level of energy services, resulting in 21 €/a supply costs for a Tier 2 household and the backup diesel is the best reliable option for Tier 4. Off-grid SHS DC supply increases in importance and outruns a diesel backup system for Tier 2 households. For Tier 4 households, its annuity is significantly the lowest, while their electricity services provided would not satisfy the household’s initial demand. The backup battery performs worse when comparing the annual electricity expenditures and not the LCOE.
With blackouts occurring in the national grid and DC systems not properly supplying Tier 4 appliances, the different scenario’s annuities are not necessarily comparable. Therefore, the EESC is calculated, including the reliability of a supply system. The ranking of options is displayed in Figure 6. Looking at reliability adjusted annuity costs, the sole grid supply is the best solution at 7 €/a for Tier 2 and at 125 €/a for Tier 4 customers. In the Tier 4 case the advantages of DC based backup solutions are reduced by the EESC, as they are not 100% reliable as well.
 Figure 6. EESC ranking of (A) Tier 2 supply solutions (B) Tier 4 supply solutions.
This study presented and evaluated the potential of multiple supply configurations, with special focus on solar home systems (SHS), to meet the reliability issues of the Nepalese national grid in the municipality of Gauriganj from a bottom-up perspective. We used real-time grid reliability measurements to emulate blackout occurrences and survey data to define the two representative household electricity demand profiles. According to the used appliances and the energy consumption, these two households can be categorized as Tier 2 and Tier 4 consumers according to the multi-tier framework for measuring electricity access. The demand profiles were used to evaluate possible backup supply scenarios improving electricity supply reliability.
While the status-quo sole national grid supply is by far the cheapest option for electricity supply in terms of LCOE, it does not provide reliable supply for rural households and leaves about a quarter of the intended demand unsupplied. Off-grid SHS cannot compete on cost because the electricity from the grid is cheap and the analysis does not consider the capital cost of grid extension. To improve supply reliability from the bottom-up, consumers can acquire backup systems to bridge blackout times. As the backup solutions consider both AC and DC supply during blackout times, their LCOE relative to the energy demand in kilowatt-hours is not well-comparable. Additionally, the LCOE can be less intuitive than communicating the annual electricity supply costs, i.e., the system annuity. To consider the supply reliability of a solution as well, the Effective Electricity Supply Costs (EESC) are introduced.
Installing a backup battery, as it is common practice, helps to ensure reliability but is comparably expensive in terms of LCOE and annual expenditures, with annual costs of 46 €/a (Tier 2) and 420 €/a (Tier 4). A backup diesel generator outperforms a backup SHS supplying AC demand with an EESC of 25 €/a (Tier 2) and 271 €/a (Tier 4), while the SHS supplying AC electricity has an EESC of 39 €/a (Tier 2) and 350 €/a (Tier 4). A backup SHS supplying a secondary DC electricity circuit and only covering Tier 2 services is the cheapest supply option for both Tier 2 and Tier 4 households. With an SHS consisting of a 10 Wp PV panel and 100 Wh battery, a Tier 2 household can ensure supply of all currently unmet energy demand at 21 €/a. If the Tier 4 household accepts not using the fridge, water pump and rice cooker at blackout times, it can power basic Tier 2 appliances during blackout times using an SHS with a 40 Wp PV panel and a 240 Wh battery at an EESC of 161 €/a. All scenarios considering batteries could profit strongly from potential improvements and cost decreases of lithium-ion batteries in the near future [45,46].
By including the reliability, the EESC increases the annual costs of the sole main grid as well as the annual costs of the off-grid SHS with DC supply of a Tier 4 household substantially. Thus, the relative differences change comparing the unreliable grid with other, 100% reliable, options: For Tier 2 customers, the LCOE of a 100% reliable DC off-grid SHS is eight times higher than the national grid’s LCOE. Its annuity, in comparison, is only four times higher, while the EESC is only three times higher than the cost of national grid supply. This underlines the importance of the right formula to fairly compare different energy supply options considering different service levels, AC and DC differences, and different reliabilities. Taking the EESC for comparative purposes, the sole main grid supply is the cost optimal solution for both Tier 2 and Tier 4 customers. If households would weight reliability with higher value than we did in the EESC equation, the 100% reliable backup or off-grid options would become more attractive. As this parameter enables an assessment of annual electricity costs while taking into account reliability issues, it should be further developed in future studies.
Our study has shown the associated costs of bottom-up approaches to bridge the reliability gap of the central system via diesel generators, SHS or backup batteries. Compared to the electricity tariff of the national grid, however, the costs of reliable supply with decentralized renewable technologies might outweigh the perceived benefit for some consumers. Longer-term financing schemes for SHS could make these more cost-competitive and reduce economic barriers hindering consumers from self-reliantly improving their supply. This will most certainly require the support of policies incentivizing investment in decentralized renewable energy technology distribution and market development. Examples from neighboring Bangladesh include the development of technical standards and quality requirements linked to results-based-finance for technology providers.
The challenge of unreliable grid supply is common across many developing economies. While our study focusses on a specific municipality in rural Nepal, it highlights the potential for decentralized renewable energy supply as a complementary solution to the central grid-based supply in other country contexts with similar challenges. Encouraging bottom-up investment in decentralized renewable energy technologies to satisfy growing energy demand is linked to development outcomes beyond SDG7 [47,48]. For example, the development of a renewable energy private sector can bring investment and employment into rural areas and increase the local accountability of public utilities by providing the population with a viable alternative. Furthermore, although we do not consider rural enterprise energy needs, the motivation and direct economic returns of improving supply for enterprises using decentralized renewable energy supply technologies may well outweigh those for rural households. Reliable electricity supply is crucial for many businesses which would often use expensive and polluting backup generators. Moving beyond the on/off-grid dichotomy is necessary to take advantage of technological innovation and deliver added value complimenting governmental electrification plans. Our contribution describes a first techno-economic analysis of integrating SHS to reach higher tiers of electrification and close in on SDG7 faster than waiting on national grid expansion alone.
The the optimization of the supply scenarios can be described as a minimization problem based on a linear equation system. Offgridders automatizes the parameterization of this linear equations system and generates it using the python library oemof. The optimal solution is determined using the cbc solver, resulting in optimal capacities of the optimized assets as well as their optimal dispatch. The equations describing the optimization problem are presented below.
The objective value that is to be minimized are the annual electricity supply costs A:

With CAPi
Ei(t)
i
t
For each optimization asset i, both capacity and dispatch in each time step are optimization variables which have a limited solution space:
CAPi ≥ 0
Ei(t) ≥ 0
Considered AssetsThe considered assets i for this case study are listed below:
PV
Gen
Batt
Inv
Rec
Grid
Supply through those assets can have both specific capital and operational costs:
a
cvar
The specific annual costs are calculated in a pre-processing step within Offgridders, and include both replacement as well as operation and management costs over the whole project lifetime T and the residual value of the asset after project end.


With capex
n
ta
CRF(t)
cres
opex
d
T
The number of replacements is calculated with:

The residual value of the asset after project end is calculated and later on deducted from the investment costs over the project lifetime. It considers linear depreciation of the investment value.

The assets have to be dispatched in a way that both AC and DC electricity bus are balanced in each time step:


With Ei
ED,ac
ED,ac
Eshort
Eex
EBatt,out
EBatt,in
η
As PV generation is not dispatchable, it is determined by the optimized capacity of the PV system and not a decision variable:
Epv(t) = CAPPV · epv(t)
With epv Specific PV generation per installed capacity PV [kWh/kWp]
Battery ModelThe electricity that can be stored in the battery is limited with a minimal and maximal storage level:
CAPBatt, kWh · SOCmin ≤ Ebatt, stored(t) ≤ CAPBatt, kWh · SOCmax ∀ t
The electricity stored in the battery changes with battery charge and discharge as well as self-discharge losses:

With ∈sd
ηin
ηout
Charge as well as discharge of the battery are limited with a C-rate and the optimized charge and discharge power of the battery. Note that, for the case study, battery power is not connected to any costs.
EBatt, in(t) ≤ CAPBatt, kWh · Cratein ∧ EBatt, in(t) ≤ CAPBatt, kW, in ∀ t
EBatt, out(t) ≤ CAPBatt, kWh · Crateout ∧ EBatt, out(t) ≤ CAPBatt, kW, out ∀ t
The electricity stored in the battery in the first and last time step are defined to be equal:
EBatt, stored(0) = EBatt, stored(T)
Constraints Specific to the Presented Case Study BlackoutsDue to blackouts, consumption from the national grid through the transformer station is limited to its hours of availability. This constraint has to be added for all scenarios that include a connection to the national grid, i.e., Scenarios 1 to 4.
EGrid(t) ≤ CAPGrid · av(t)
With av Timeseries of national grid availability, with 1 indicating availability and 0 indicating a blackout.
Backup supply from battery and PV systemFor Scenario 3, which includes a backup battery, and Scenario 4, which additionally includes a PV panel, a constraint is added to ensure that AC electricity demand is only met by battery discharge or PV generation when the national grid experiences a blackout. This is ensured by prohibiting an energy flow through the inverter when the grid is available.
Einv (t) ≤ CAPinv · (1 − av(t))
Forced battery chargeIn Scenario 3, the battery is charged from the national grid to provide backup supply at blackout times. To circumvent the effect of perfect foresight, a constraint is introduced to force battery charge. As such, in reality, the battery should charge as much as possible in each time step. The enforced battery charge Eforced would be a step-wise defined function:
Eforced(SOC(t)) = Cratein ∀ SOC ∈ [SOCmin, 1 - Cratein]

To introduce this operational constraint to the oemof model, this problem has to be linearized. For this, following two boundaries are defined:
Eforced (CAPBatt, kWh · SOCmin) = Cratein · CAPBatt, kWh
Eforced(CAPBatt, kWh · SOCmax) = 0
Resulting in following linearization of forced battery charge:
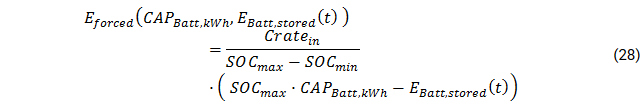
The full constraint therefore reads as follows:
EBatt, charge(t) ≥ av(t) · Eforced(CAPBatt, kWh, EBatt, stored(t)) ∀ t
After optimization, the constraint’s effect on the battery’s charging behaviour was validated (see Figure A1).
 Figure A1. Effect of criterion introducing forced battery charge (Scenario 3, T4 household with AC demand).
The simulation tool Offgridders is available online [22]. Requests regarding the voltage measurement data as well as household survey data set can be forwarded to Setu Pelz.
The study was designed by MH and SP. MH developed the simulation tool Offgridders, conducted all simulation and scenario analysis, provided the overarching structure and posed as the editor/corresponding author of the study. SP developed the initial concept, and provided the survey data, grid voltage measurement data, evaluation and discussion. ÒM-P developed the stochastic load modelling function together with SP, and simulated, evaluated and described the households’ electricity demands. MA wrote most of the introduction and the section describing the household surveys. PB worked with the authors on the scenarios definition, contextualization and discussion of the respective sections.
The authors declare that there is no conflict of interest.
The household survey was funded by GIZ Nepal under the RERA program. Renewable Energy for Rural Areas (RERA) is a German-Nepali technical cooperation programme to improve the access of rural households to renewable energy in the country. The German contribution to RERA is provided by the Federal Ministry for Economic Cooperation and Development (BMZ). RERA is jointly implemented by the Alternative Energy Promotion Center (AEPC), Government of Nepal, and Deutsche Gesellschaft für Internationale Zusammenarbeit (GIZ) GmbH. We thank the Reiner Lemoine Foundation (RLS) for providing Setu Pelz with a PhD scholarship, during which the household survey was designed and implemented and grid availability data was collected.
The subject of this paper was first presented under the title “Overcoming the bottleneck of weak grids: Reaching higher tiers of electrification with Solar Home Systems for increased supply reliability” at the international conference “Energising the SDGs through appropriate technology and governance”, organized by the Institute of Energy and Sustainable Development, De Montfort University. The conference took place in Leicester, UK from 2019 Jul 4–5. We thank the organizers of the conference and all the participants for the opportunity to present and for the feedback helping us to improve the study.
1.
2.
3.
4.
5.
6.
7.
8.
9.
10.
11.
12.
13.
14.
15.
16.
17.
18.
19.
20.
21.
22.
23.
24.
25.
26.
27.
28.
29.
30.
31.
32.
33.
34.
35.
36.
37.
38.
39.
40.
41.
42.
43.
44.
45.
46.
47.
48.
Hoffmann MM, Pelz S, Monés-Pederzini Ò, Andreottola M, Blechinger P. Overcoming the Bottleneck of Unreliable Grids: Increasing Reliability of Household Supply with Decentralized Backup Systems. J Sustain Res. 2020;2(1):e200009. https://doi.org/10.20900/jsr20200009

Copyright © 2020 Hapres Co., Ltd. Privacy Policy | Terms and Conditions


