Location: Home >> Detail
J Sustain Res. 2020;2(2):e200020. https://doi.org/10.20900/jsr20200020

Cass Business School, University of London, 106 Bunhill Row, London EC1Y 8TZ, UK
* Correspondence: ManMohan S. Sodhi, Tel.: +44-20-7040-0276.
This article belongs to the Virtual Special Issue "Corporate Sustainability"
Background: There are already many indices such as Bloomberg’s environmental-and-social governance (ESG) ratings and the Dow Jones Sustainability Indices (DSJI), which use proprietary methods to rate companies using private and publicly available information processed with proprietary methods. This paper seeks to develop a formative index for researchers and practitioners using only publicly available sustainability reports with a transparent procedure.
Methods: Thirty-two indicators, obtained in an earlier study from the literature, GRI, and other sources, were adopted. The sustainability report of each of 331 companies was then scored on a discrete 0–3 scale for each indicator as regards disclosure. The index for the company then is simply a summation of the indicator scores. Tests were conducted to see if the index can be (a) used for companies with different revenues and from different sectors and (b) tested for explaining DJSI or ESG ratings.
Results: The index can be used for companies with a wide range of revenues and from different sectors. Despite its simplicity, the disclosure index significantly explains the DJSI and ESG.
Conclusions: A disclosure index for companies has been developed here using only their publicly available sustainability reports, unlike existing indices like the DJSI that use public and private information and proprietary methods. Researchers and financial institutions can use this index or develop their own indices by refining the methodology presented here.
Companies need to meet requirements for transparency on their sustainability efforts [1–3]. Financial institutions use various private and public data from companies to rate these companies’ level of disclosure as a proxy for their sustainability efforts. Examples are Bloomberg’s environmental-and-social governance (ESG) ratings and the Dow Jones Sustainability Indices (DSJI). Many researchers use these indices as measures of companies’ performance although the ratings are obtained using proprietary methods. This paper seeks to develop such a disclosure index transparently and using only publicly available sustainability reports, and to check its usefulness for companies of different sizes and from different sectors.
As investors, particularly institutional investors, start using sustainability practices a criterion for investment, indices have emerged to rate companies. The motivation behind the indices is that sustainability practices constitute a potential element for long-term value creation from which shareholders will benefit [4].
However, sustainability indices have not received high level of academic attention. We focus on 32 sustainability indicators obtained by Papoutsi and Sodhi (2020, [5]) from the literature, GRI, UN Global Compact, and other sources. Any company can then be scored for its disclosure by first scoring its sustainability reports for these indicators and then simply summing up the indicators. We apply this to a sample of 331 companies by using their sustainability reports and then check the usefulness of the index to rate companies across a range of revenues and industry sectors as covered in this sample.
The contribution of this study to the literature is that we show how to create a sustainability disclosure index from publicly available information from companies. Our approach is not purely based on GRI reporting guidelines [6–9]. The index is constructed based using the text of companies’ disclosures in their sustainability reports, and not simply on counting words or sentences [10–12]. Finally, the index here is simple to construct and easy to replicate.
The results of the study also have managerial and research implications. Portfolio managers can use sustainability reports by using such an index to compare companies’ disclosures. Researchers can develop their own indices based on sustainability reports to use the indicators presented in this paper to analyze sustainability reports or other public information for disclosure and even sustainability performance. We also believe that our proposed index can serve as the basis for creating indices for specific aspects of sustainability, or for specific sectors.
The rest of the paper is structured as follows. Section “THEORETICAL BACKGROUND” provides some theoretical background and Section “MATERIALS AND METHODS” describes the materials and methods used in this study, followed by the Sections “RESULTS” and “CONCLUSIONS”.
Sustainability indices seek to capture both environmental and social dimensions of sustainability. Current methods of sustainability measurement include single or focused indicators (GHG emissions, water consumption, waste recycling) as well as composite indices, such as the DJSI. Various approaches have been used in constructing the indices. A common approach is to exclude companies that operates in industries that are considered to be unethical such as tobacco, alcohol, and nuclear energy. This approach is used in Calvert Social Index, Domini 400 Social Index and FTSE4Good index, whereas DJSI, Ethibel, and Vigeo indices use an approach that focus on positive screening. Some indices, such as the DJSI, adopt the policy of including the best companies from all industrial sectors. This policy reflects a policy of aiming to achieve an industry weighting that approximates the weighting of the relevant benchmark index [13].
A commonly used aggregation technique—used in this paper as well—is using the Equally Weighted Average (EWA) method, whereby various chosen indicators are equally averaged to construct a sustainability index. EWA has been applied to numerous sustainability indices such as Human Development Index and Environmental Sustainability Index [14].
Composite indices are based on the idea of indicator-based indices. The main assumption is that when a broader variety of indicators are aggregated into an index, the final figure shows a “simplified, coherent, multidimensional view of the system” [15]. Composite indices are widely used in environmental management and decision making at all levels [15]. An example of such an index is the Environmental sustainability index (ESI), which comprises 21 underlying indicators that are categorized and aggregated into five components and the Environmental performance index.
We adopt the 32 sustainability indicators obtained by Papoutsi and Sodhi (2020, [5]) from the literature, GRI, UN Global Compact, and other sources. We refer the reader to Papoutsi and Sodhi (2020, [5]) to see the details of the methodology used for indicator development.
Using the Sustainability Disclosure Database, we obtained 331 sustainability reports from 2013–14: 117 were American or Canadian and 214 were European. These regions were chosen based on their common policies and practices [16], and only reports written in English were retrieved to allow straightforward content analysis. The sample covered a wide variety of sectors, with stratified sampling aimed across 18 sectors that were determined through aggregating the 38 industries into which the Sustainability Disclosure Database classifies companies.
For each of these sustainability reports, all the 32 indicators were scored as follows:
-
-
-
-
 Table 1. The 32 indicators used for N = 331 companies’ sustainability reports (Source: Papoutsi and Sodhi, 2020, [5]).
This scoring system is similar to that used by Wiseman [10] and other researchers using GRI indicators, although sometimes (albeit rarely), a 0–4 scoring system has been used [6,8,9,17–20]. To ensure reliability in the coding, the same text was coded twice, the second time 12-months later to avoid coding errors. Two coders scored the reports both times to ensure inter-rater reliability. Furthermore, for correlation analysis between total disclosure score for sample data (2013–14) and that from a later year, 2015–16, both Pearson (0.87, p < 0.01) and Spearman (0.87, p < 0.01) coefficients indicate that scoring from the two different years is similar. This consistency across years also alleviates concerns about the subjectivity of the scoring methodology.
The 32 indicators that predominate in companies’ sustainability reports are listed in Table 1. For more information on the indicator refinement process, please refer to Papoutsi and Sodhi (2020, [5]). These indicators are not only reported by the majority of the companies, but also achieve high scores, implying that companies are implementing the particular indicators at a high level. Hence, an important finding is that we can obtain rankings for the indicators that incorporate both disclosure of information and the level of effort in one and rank companies based on their total disclosure score.
Using this data, we wish to see how potentially useful an index—we call it total disclosure score—that is simply an equally-weighted average of these 32 indicator values is:
1.
2.
3.
As a first step, total disclosure is calculated by summing up each company’s score in the 32 indicators, using equal weights of one.
To examine whether sustainability disclosure follows similar trend across all sectors or is specific to each sector, an ANOVA test was conducted to examine whether industry classification differentiates total disclosure. We found a statistically significant difference in total disclosure score between the different industrial sectors (p = 0.001). Tukey post hoc test is run next to determine which industrial sectors differ from each other. Broadly, with 18 sectors, there were very few sectors that were different from others. There are statistically significant differences in total disclosure score between six industrial groups: between (1) automotive and commercial services (p = 0.013); (2) automotive and computers (p = 0.022); (3) automotive and finance (p = 0.015); (4) aviation and commercial services (p = 0.032); (5) aviation and computers (p = 0.032); and (6) aviation and finance (p = 0.037). This differentiation makes sense as aviation and automotive have the highest environmental effect compared to the rest of the industries, and as such these industries disclose more on (environmental) sustainability [28].
Given that our sample comprises a wide variety of 18 industrial sectors, we therefore argue that industrial sector does not appear to matter as regards the total disclosure score being used to measure disclosure of a company. It is readily seen that average disclosure score is evenly distributed among the industrial sectors. Yet, automotive and aviation achieve the highest disclosure score and computers industry has the lowest disclosure score (Figure 1).
 Figure 1. Average disclosure for a company in each sector.
The ANOVA test (Table 2) for each of the four selected sectors shows that size (revenues) does not matter as regards total disclosure score. Specifically,
-
-
-
-
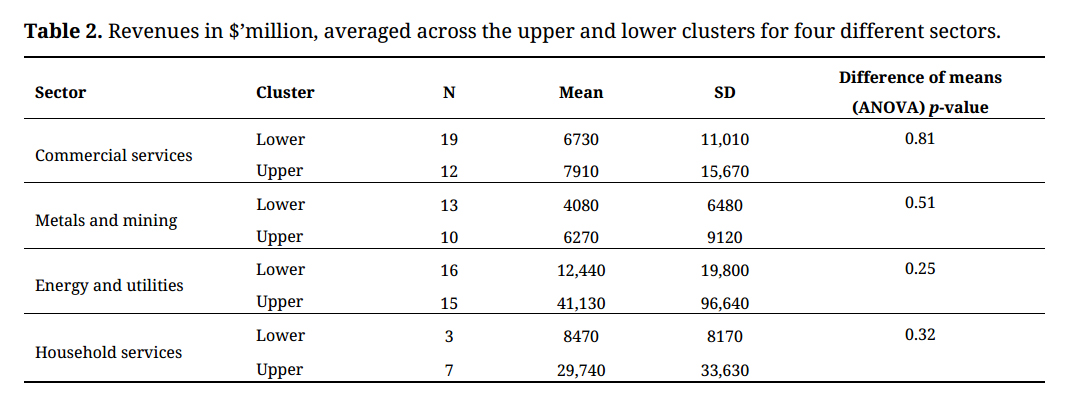 Table 2. Revenues in $’million, averaged across the upper and lower clusters for four different sectors.
Overall, this analysis indicates that there is not any statistical difference in the mean of revenues between upper and lower cluster companies in any of the four industries at least as regards the range of sizes covered in the chosen sample.
A scatterplot by sector (Figure 2) graphically illustrates the relation between revenues and sustainability disclosure score for energy, metals, household, and commercial services. We see that the sustainability disclosure score is scattered around a range of revenues for all companies in the four chosen sectors.
 Figure 2. Correlation between total sustainability disclosure score and revenues across all companies in the four industries.
Next, we compared the level of association of total sustainability disclosure score and revenues across all firms of the sample. Again, scatterplots (Figure 3) visually reflect the lack of any obvious relationship, whether for any particular sector, or for all the companies together (lower half of Figure 3). It is therefore indicated that a company’s total sustainability disclosure score is not dependent on its size.
 Figure 3. Correlation between total disclosure score and size across all companies in the sample.
To test the consistency of the proposed index with market-leading indices, two measures were selected—inclusion (or not) in the Dow Jones Sustainability Index and Bloomberg’s Environmental Social Governance (ESG) scores. The 85 companies that belonged to DJSI in the year for which we used sustainability reports have a sustainability disclosure score ranging from 46 to 17, and more specifically, 75 out of these 85 companies, score higher than 20. This fact indicates that companies that are part of the DJSI have a higher total disclosure score compared to the ones that are not part of the DJSI.
A dummy variable is constructed (=1 when the company belongs to DJSI, 0 otherwise) to measure the correlation between a company’s appearance in DJSI and its total disclosure score [29,30]. ESG is already a score, so we use that as the variable. Pairwise correlations, parametric and non-parametric, between total disclosure score, DJSI and ESG show the correlations to be quite similar to each other:
-
-
-
An independent t-test to examine any statistically significant difference in the level of disclosure between companies that belong to DJSI and those that do not. T-test is statistically significant (p = 0.001), indicating that there are significant differences in total sustainability disclosure score between the two groups, with companies that belong to the DJSI having a higher sustainability disclosure scores (26.94 ± 0.94) compared to companies that are not (20.54 ± 0.52).
A binomial logistic regression is also performed to examine the effect of total sustainability disclosure score on DJSI ranking. Logistic regression analysis is statistically significant and indicates that the total sustainability disclosure score of companies’ sustainability reports is more likely to be higher in companies that are part of DJSI compared to those that are not (Table 3).
 Table 3. Logistic regression between DJSI and total disclosure score.
OLS regression is also performed to examine sustainability disclosure score has any explanatory power over ESG score. The results indicate ESG score is predicted by the total disclosure score (Table 4).
 Table 4. OLS regression between ESG score and total disclosure score.
Taken together, the total disclosure score developed by extracting information from sustainability reports is significantly and positively linked with the inclusion or otherwise of a company in the DSJI and also its ESG rating.
This paper developed a formative index of sustainability disclosure for researchers and practitioners using only publicly available sustainability reports. We showed that the disclosure index that this study proposes can be applied to companies across various industrial sectors and with different size. Moreover, the disclosure index significantly explains third party ratings like DJSI and ESG that use public and private information and proprietary methods. Hence, managers and researchers can use sustainability reports to obtain an accurate knowledge of companies’ disclosure on their sustainability efforts, instead of relying on third party provided ratings.
The real contribution of this paper lies in is showing how researchers and financial institutions can develop their own indices by refining the methodology used in this study. There are three practical implications. First, managers of companies can rate their own companies’ sustainability reporting using the method presented by us to (a) understand how investors may rate their companies, and (b) to improve their own reporting, and efforts, regarding sustainability performance over time. Second, practitioners interested in developing their own, possibly sector-specific, indices can start with the list of pertinent questions (e.g., Papoutsi and Sodhi, 2020 [5]) and then use the methods described in this paper to check the robustness and practicality of the index they seek to develop. Third, these practitioners or managers of companies could alternatively use the index developed here as one component of their own rating, supplemented by other information.
The limitations of this study can be the basis for future development in the following ways:
(1)
(2)
(3)
All authors contributed equally.
The authors declare that there is no conflict of interest.
1.
2.
3.
4.
5.
6.
7.
8.
9.
10.
11.
12.
13.
14.
15.
16.
17.
18.
19.
20.
21.
22.
23.
24.
25.
26.
27.
28.
29.
30.
Papoutsi A, Sodhi MS. A Sustainability Disclosure Index Using Corporate Sustainability Reports. J Sustain Res. 2020;2(2):e200020. https://doi.org/10.20900/jsr20200020

Copyright © 2020 Hapres Co., Ltd. Privacy Policy | Terms and Conditions


