Location: Home >> Detail
J Sustain Res. 2024;6(2):e240029. https://doi.org/10.20900/jsr20240029
 ,
S Krishnan 2,
N Rajavinu 3,
B Muthuraj 4
,
S Krishnan 2,
N Rajavinu 3,
B Muthuraj 4
1 Department of Electrical and Electronics Engineering, GMR Institute of Technology, Rajam, Andhra Pradesh 532127, India
2 Department of Electrical and Electronics Engineering, Mahendra Engineering College (Autonomous), Namakkal, Tamil Nadu 637503, India
3 Department of Electrical and Electronics Engineering, S.A. Engineering College, Chennai, Tamil Nadu 600077, India
4 Department of Electrical and Electronics Engineering, Panimalar Engineering College, Chennai, Tamil Nadu 600123, India
* Correspondence: K Karthick.
This research paper presents a novel approach to wind power prediction, focusing on seasonal analysis and machine learning models. The study addresses short-term wind power forecasting, specifically targeting the prediction of wind power generation at a given location over periods ranging from a few minutes to several days in advance. The proposed methodology integrates comprehensive seasonal analysis, leveraging four distinct seasons namely Winter, Spring, Summer, and Autumn to gain insights into wind energy production patterns. This study evaluates the performance of two machine learning models, kNN Regression and AdaBoost, across these seasons, providing valuable insights into their effectiveness in wind power prediction. This research contributes to advancing wind power forecasting methodologies by offering a comprehensive analysis of seasonal variations and leveraging machine learning techniques for accurate and reliable predictions.
Wind power prediction is the process of forecasting the amount of electricity that can be generated from wind turbines at a given location over a specific period of time, typically ranging from a few minutes to several days in advance. This prediction is crucial for the efficient wind energy integration into the power grid and for ensuring a reliable and stable electricity supply. Wind power prediction is an essential component of managing renewable energy resources effectively [1].
Wind power is intermittent and highly variable due to changes in wind speed and direction [2]. Accurate predictions help grid operators anticipate fluctuations in wind power generation, enabling them to balance electricity supply and demand and maintain grid stability.
Electricity grids need to balance the production and consumption of electricity constantly. Accurate wind power predictions allow utilities to schedule other power sources (e.g., fossil fuel-based or hydroelectric plants) accordingly, optimizing the use of various resources and minimizing operational costs [3].
In many energy markets, electricity generators submit their expected generation schedules in advance. Wind power predictions enable wind farm operators to participate effectively in these markets and provide reliable commitments to deliver electricity [4].
In electricity markets with imbalance charges, utilities may incur financial penalties for deviations between scheduled and actual electricity production. Accurate predictions reduce the risk of imbalances and the associated charges.
Governments, energy companies, and investors use wind power predictions to plan the deployment of wind farms and assess the potential of wind energy in a particular region. Accurate predictions are crucial for making informed decisions about investments in renewable energy infrastructure [5].
Energy traders and contract holders use wind power predictions to assess future supply and demand dynamics, make pricing decisions, and hedge against risks associated with variable wind power generation [6].
For policymakers and grid planners, wind power predictions are essential for conducting studies related to the integration of wind energy into the existing power grid. These studies help identify potential challenges and design strategies to accommodate higher shares of renewable energy [7].
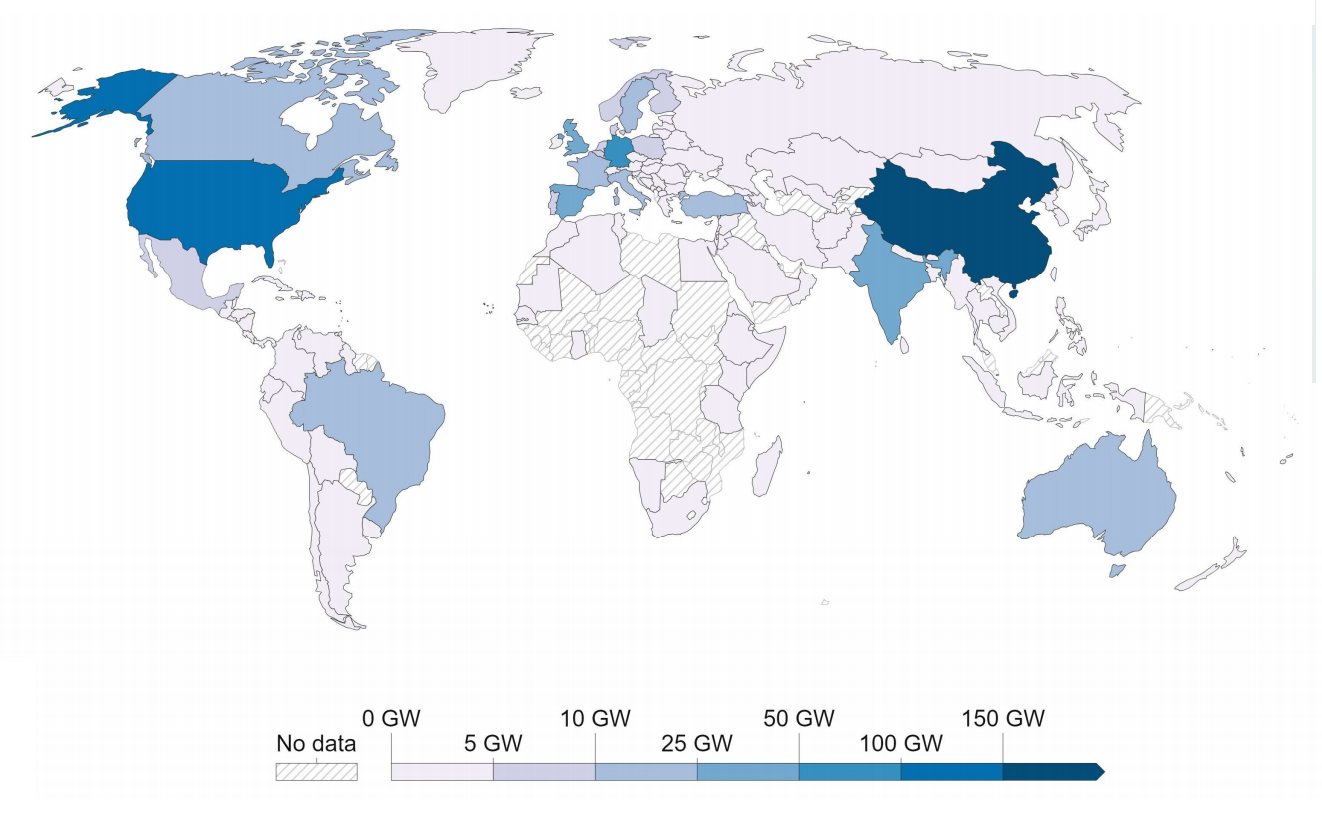 Figure 1. World total installed wind power capacity in 2021 [8].
Figure 1 displays a world total installed wind power capacity of 2021 [8], which reaches 770,336 MW in 2021. The remaining sections of the paper include an overview of related work, materials and methods, results and discussion, and concluding remarks. This research aims to provide valuable insights into wind power forecasting methodologies and their applicability across different seasons.
Li et al. [9] focuses on wind power forecasting using Extreme Learning Machine (ELM) with error correction in short-term and ultra-short-term scales. ELM shows high computational efficiency. Overall, the error-corrected ultra-short-term forecasting achieved improved accuracy (Normalized Root Mean Squared Error (NRMSE) of 5.76%) compared to short-term forecasting (NRMSE of 21.09%).
Oh J et al. [10] focuses on wind power generation prediction using a Multi-Layer Perceptron (MLP) model with transfer learning. The MLP model consists of one or more hidden layers between the input and output layers. To optimize the model, the grid search optimization method has been applied to find the best combination of hidden layers and nodes. Transfer learning is employed to improve the prediction of a new wind power generator with limited data. The results show that transfer learning outperforms the simple MLP model and even a tree-based learning algorithm. The study demonstrates the potential of transfer learning in wind power prediction, especially for new wind power generators with insufficient historical data.
Alkesaiberi et al. [11] explores the effectiveness of various machine learning models for wind power prediction using three datasets from wind turbines in France, Turkey, and Kaggle. The datasets vary in terms of time resolution and features. The investigation includes static models that only use past wind power data for forecasting, and models that use meteorological variables (wind speed and direction) as inputs for prediction. The results indicate that dynamic models outperform static models, and the inclusion of meteorological variables further improves prediction accuracy. The best-performing models include Gaussian Process Regression (GPR) and ensemble methods like Bagging, Boosting, and Random Forest (RF).
P. Lakshmi and Deepak, P. [12] introduced a new Linear Regression algorithm and compares its effectiveness in predicting wind power generation with the widely used K-Nearest Neighbor (KNN) algorithm. Two groups were formed, one for KNN (group 1) and the other for Linear Regression (group 2), each containing 10 samples from a dataset collected from an actual wind turbine. The dataset includes factors like wind speed, altitude, humidity, air density, wind direction, and output power, gathered at 10-minute intervals over a year.
Lili Wang et al. [13] described a novel approach to wind speed prediction called the multiple-point model. Unlike traditional single-point methods which rely solely on data from one location, this model incorporates wind speed measurements from neighboring locations to enhance accuracy. Named the multiple-point-AdaBoost-ELM model, it combines the Extreme Learning Machine (ELM) with the AdaBoost algorithm.
Guoqing An et al. [14] developed an integrated wind power prediction model, Adaboost-PSO-ELM, to address the challenges of wind energy utilization and grid stability. Combining Adaboost algorithm with extreme learning machine optimized by particle swarm optimization (PSO-ELM), the model enhances prediction accuracy and generalization ability. It optimizes ELM with PSO, then integrates weak predictors with Adaboost to form a strong prediction model.
Most of the research have been done with a limited set of features to develop the prediction model. Our approach provides the prediction model with 14 features. In our research article, kNN Regression and AdaBoost Regression have been evaluated for their effectiveness in wind power prediction.
The wind power dataset, accessible in the public domain of Kaggle [15], encompasses diverse weather, turbine, and rotor characteristics. The data spans from January 2018 to March 2020, captured at intervals of 10 minutes. The raw dataset consists of up to 94,750 instances and includes 21 features, incorporating date and time attributes. The index showcases the range of features present in the dataset.
Data ImputationCommonly, missing values arise from either human error during data processing or system errors caused by equipment breakdown. This prevalent issue of missing values gives rise to various concerns, including reduced performance, data analysis challenges, and potentially biased results [16]. The mean value of the ‘ControlBoxTemperature’ attribute is found to be 0. Consequently, the decision was made to eliminate this particular feature from the dataset. Additionally, the 'date' attribute has undergone a data type conversion from ‘object’ to a date and time format. Figure 2 shows the presence of missing values in the dataset for each attribute. After imputation all the features have 118,224 instances and here Active power is the target variable and the data imputation has not been performed on the target variable. Table 1 provides the count, mean, standard deviation, percentiles, and minimum-maximum values for all the features in the imputed dataset.
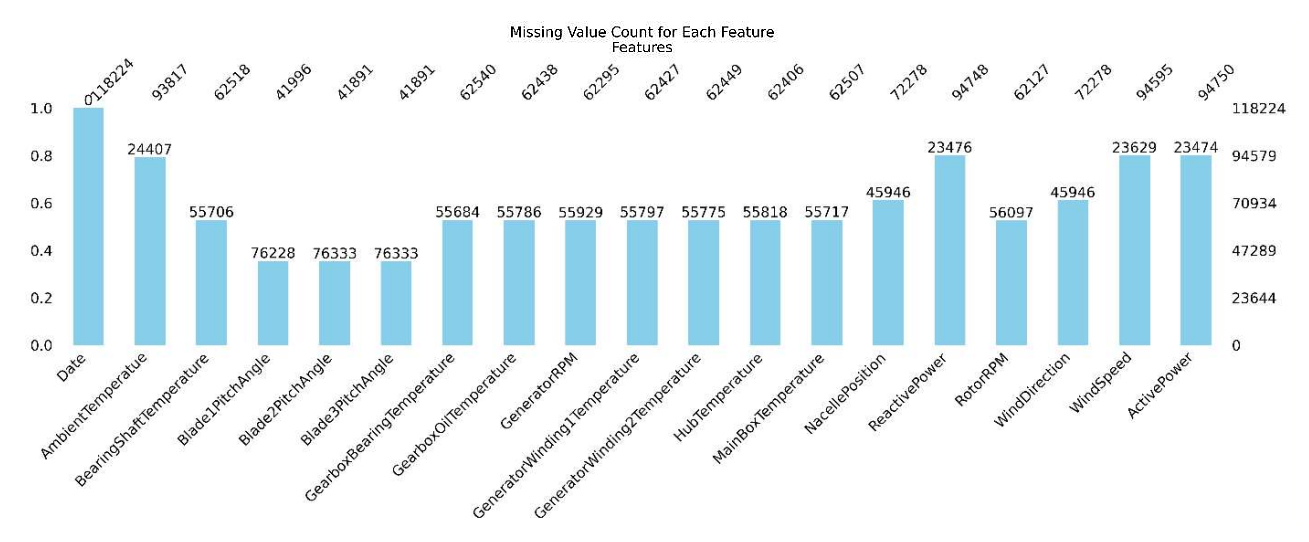 Figure 2. Missing value count for each attribute in the dataset.
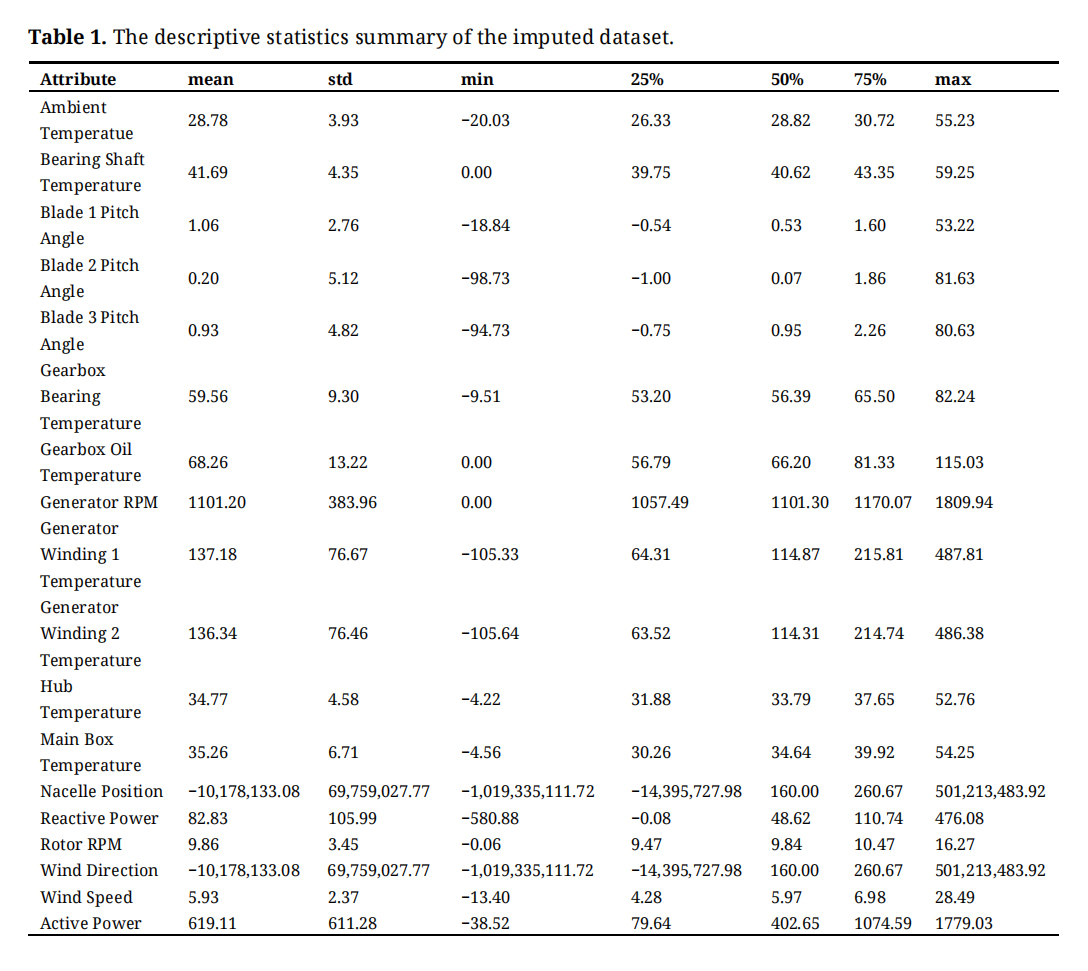 Table 1. The descriptive statistics summary of the imputed dataset.
Lasso feature selection has been performed on the imputed dataset [17]. It is observed that ‘WindDirection’, ‘NacellePosition’, ‘MainBoxTemperature’, ‘Blade3PitchAngle’ and ‘Blade2PitchAngle’ has the least coefficient value. So, these features has been removed from the model development. The remaining 14 features have been considered for model development including Date and Active Power. Figure 3 shows the Lasso feature coefficient values of all the features.
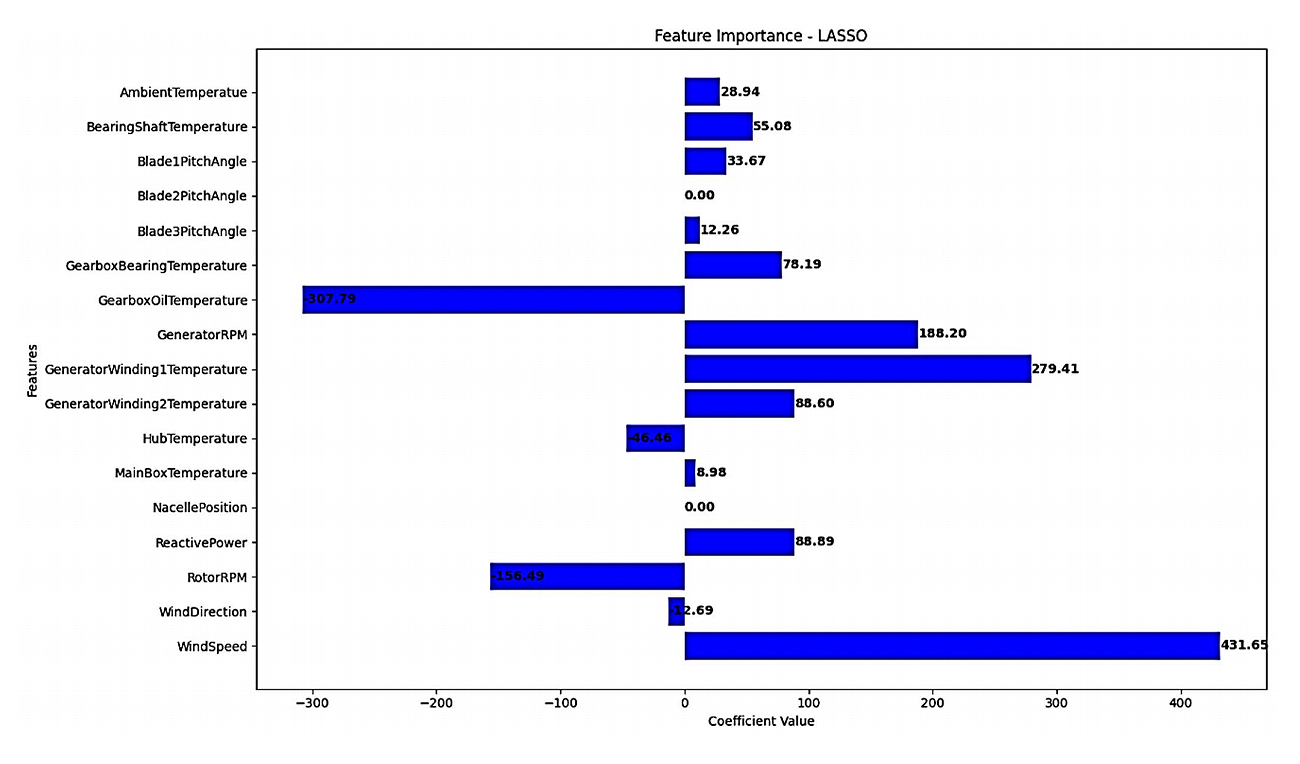 Figure 3. LASSO feature selection.
Figure 4 shows the weekly mean values of (a) Wind Speed (b) Generator RPM and (c) Active Power. As per the data, the Monday, Tuesday, Wednesday and Saturday, the generating station able to produce more power. The same has been reflected with wind speed and generator RPM. The large daily wind speed has been found in the month of July and August month. In this diagram, because of large dataset, 10,000 random samples have been considered for the plots. Summary statistics are still based on the entire dataset.
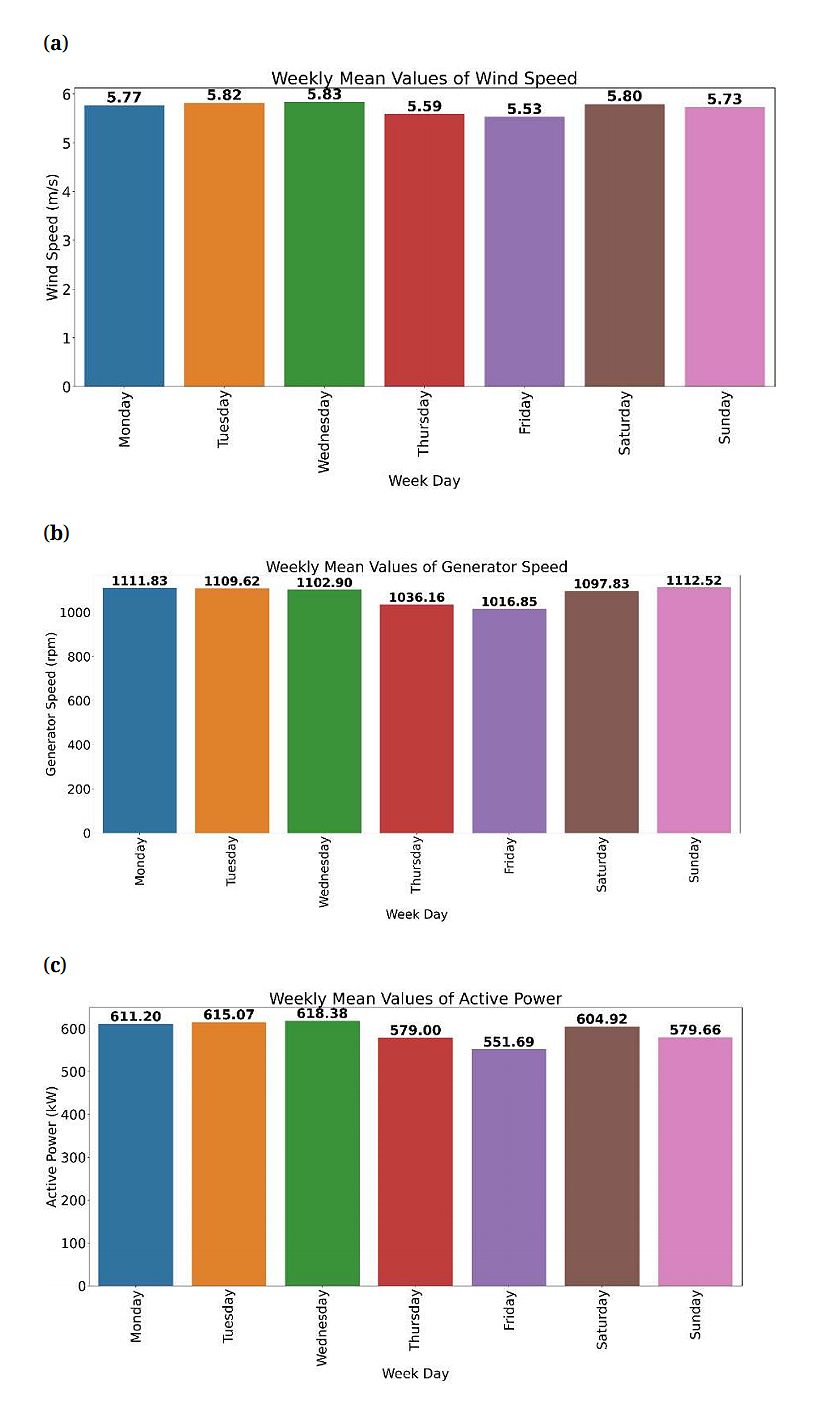 Figure 4. Weekly mean values of (a) Wind Speed (b) Generator RPM (c) Active Power.
The regression model was constructed utilizing two distinct machine-learning algorithms: kNN Regression and AdaBoost.
To forecast the active power output for a new data point, the kNN model identifies the k-nearest neighbors in the training dataset (using a distance metric, commonly Euclidean distance), where k represents a user-defined hyperparameter [18]. Subsequently, the predicted value is computed as the average (for regression) or the majority class (for classification) of these k-nearest neighbors.
In contrast, AdaBoost assigns weights to each data point in the training dataset. Initially, all data points carry equal weights. With each iteration, a new weak learner (often a simple decision tree) is trained using the weighted data [19]. The model then assesses its performance and assigns higher weights to misclassified data points. This iterative process continues for a predetermined number of iterations or until the model achieves the desired level of performance.
While the kNN model excels in capturing local patterns and intricate relationships, resulting in high prediction accuracy, AdaBoost Regression benefits from its ensemble nature, adeptly managing complex and noisy data, albeit potentially sacrificing some accuracy in capturing local patterns compared to kNN.
The dataset spans from December to March, capturing four seasons: Winter (December, January, February), Spring (March, April, May), Summer (June, July, August), and Autumn (September, October, November). This categorization enables the analysis of wind energy production patterns across different seasons, providing insights into seasonal variations and trends in energy generation. As shown in Table 2, The dataset for the Winter season comprises 17 input features and consists of 11,327 instances. The Spring season dataset contains 17 input features and encompasses 5893 instances. The dataset representing the Summer season consists of 17 input features and includes 7728 instances. Finally, the Autumn season dataset, like the others, is composed of 17 input features and encompasses 8115 instances.
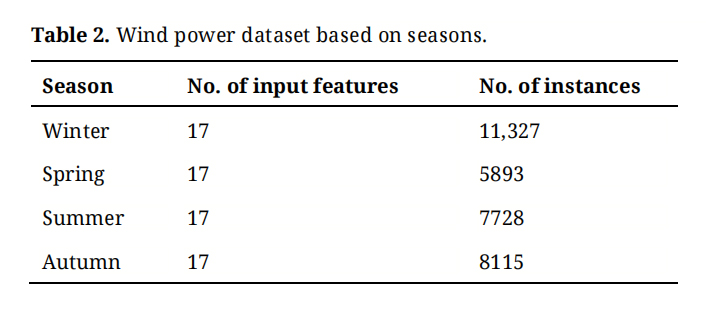 Table 2. Wind power dataset based on seasons.
The performance metrics mean absolute error (MAE), mean squared error (MSE), root mean squared error (RMSE) and R-squared value [20] have been defined in equations (1) to (4).


Table 3 showcases the performance metrics, including MAE, MSE, RMSE, and R-squared scores, for two wind power prediction models, kNN Regression and AdaBoost, evaluated across distinct seasons: Winter, Spring, Summer, and Autumn. Both kNN Regression and AdaBoost models exhibit varying performances across different seasons, as indicated by the metrics. In the Winter season, kNN Regression demonstrates notably lower MAE, MSE, and RMSE compared to AdaBoost, suggesting better predictive accuracy for this model during winter months. AdaBoost exhibits higher error metrics compared to kNN Regression during Spring, indicating potentially less effective performance in predicting wind power generation during this season. Both models perform relatively well during the Summer season, with moderate error metrics across the board. However, kNN Regression shows slightly lower errors compared to AdaBoost. Similar to Winter, kNN Regression outperforms AdaBoost in the Autumn season with lower error metrics, indicating its superior predictive capability during this time of the year. Overall, kNN Regression demonstrates more consistent performance across seasons, with lower error metrics observed in Winter and Autumn compared to AdaBoost. Depending on the specific requirements and priorities, stakeholders may choose between kNN Regression and AdaBoost models based on their seasonal performance variations and the importance of accurate wind power predictions throughout the year.
Figures 5 to 8 depict the predicted and actual values plot of machine learning models, specifically k-NN Regression and AdaBoost Regression, across different seasons: Winter, Spring, Summer, and Autumn. Each figure showcases the predicted values generated by the machine learning models compared to the actual values for respective seasons, providing a visual representation of model performance. Stakeholders, such as renewable energy planners and operators, can utilize these visualizations to make informed decisions regarding the selection and optimization of machine learning models for wind power prediction, thereby enhancing the efficiency and reliability of renewable energy systems.
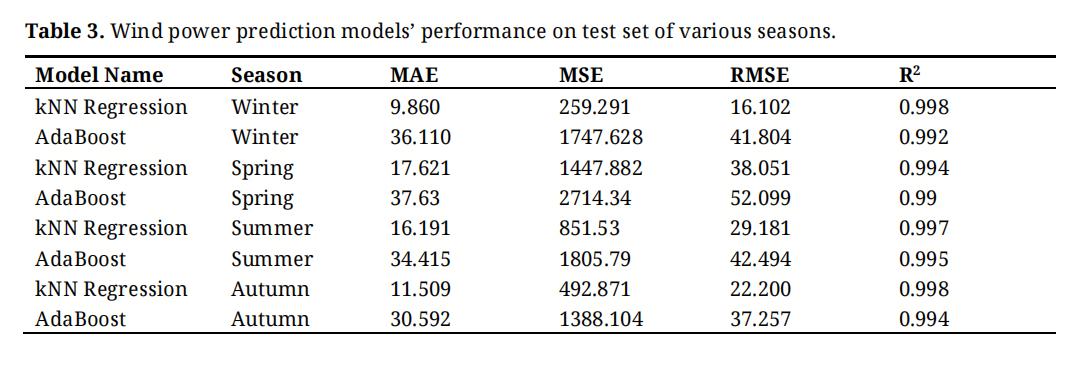 Table 3. Wind power prediction models’ performance on test set of various seasons.
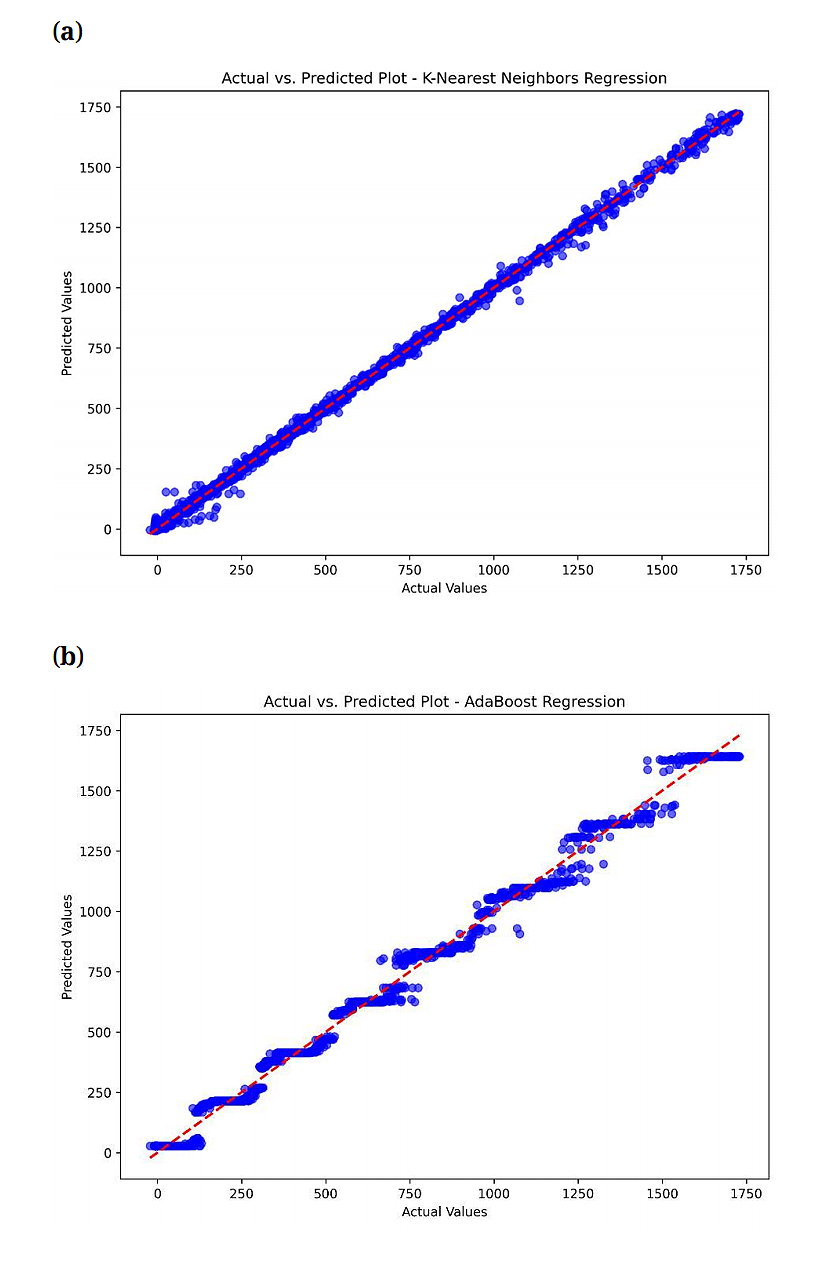 Figure 5. The predicted and actual values plot of machine learning models (a) k-NN Regression (b) AdaBoost Regression for winter season.
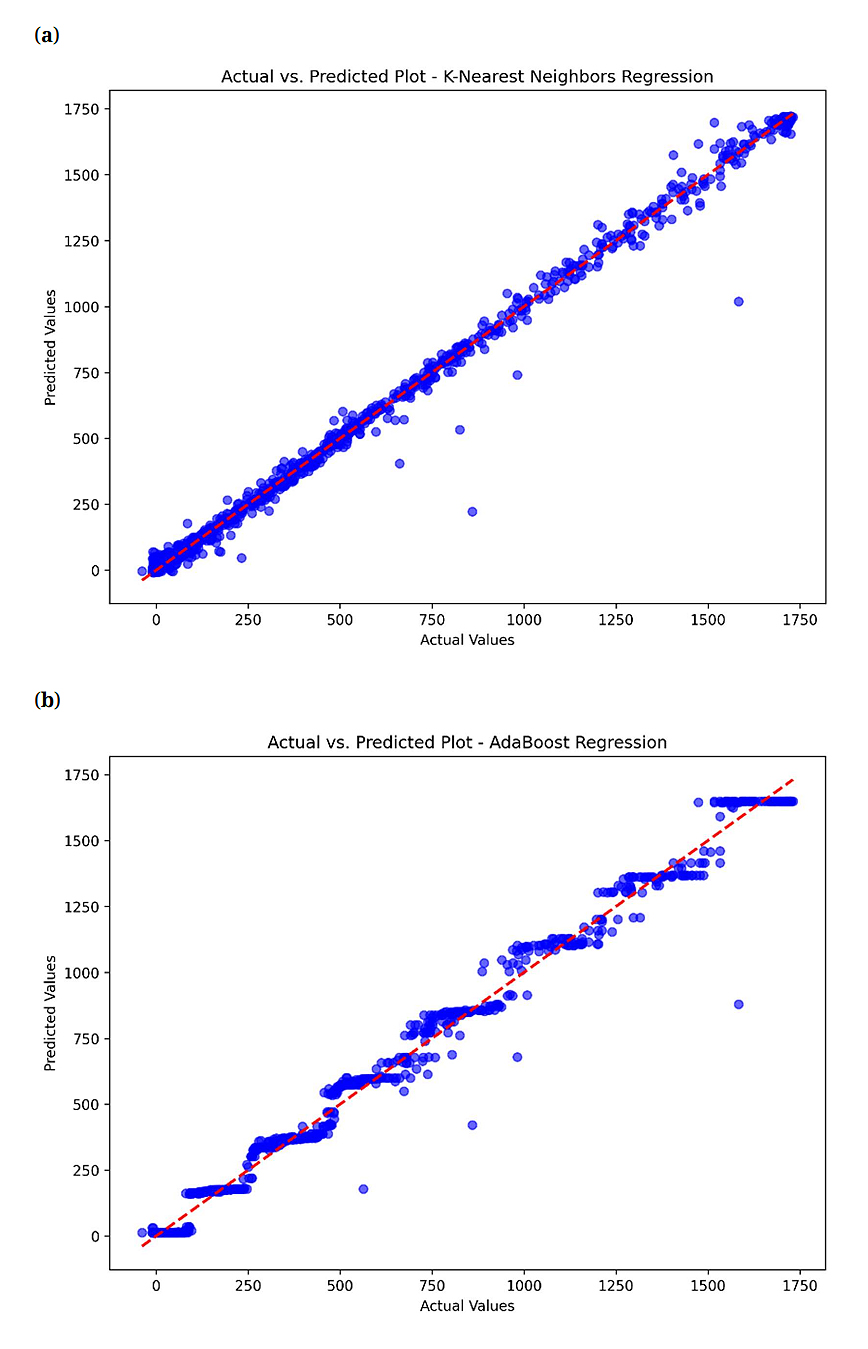 Figure 6. The predicted and actual values plot of machine learning models (a) k-NN Regression (b) AdaBoost Regression for spring season.
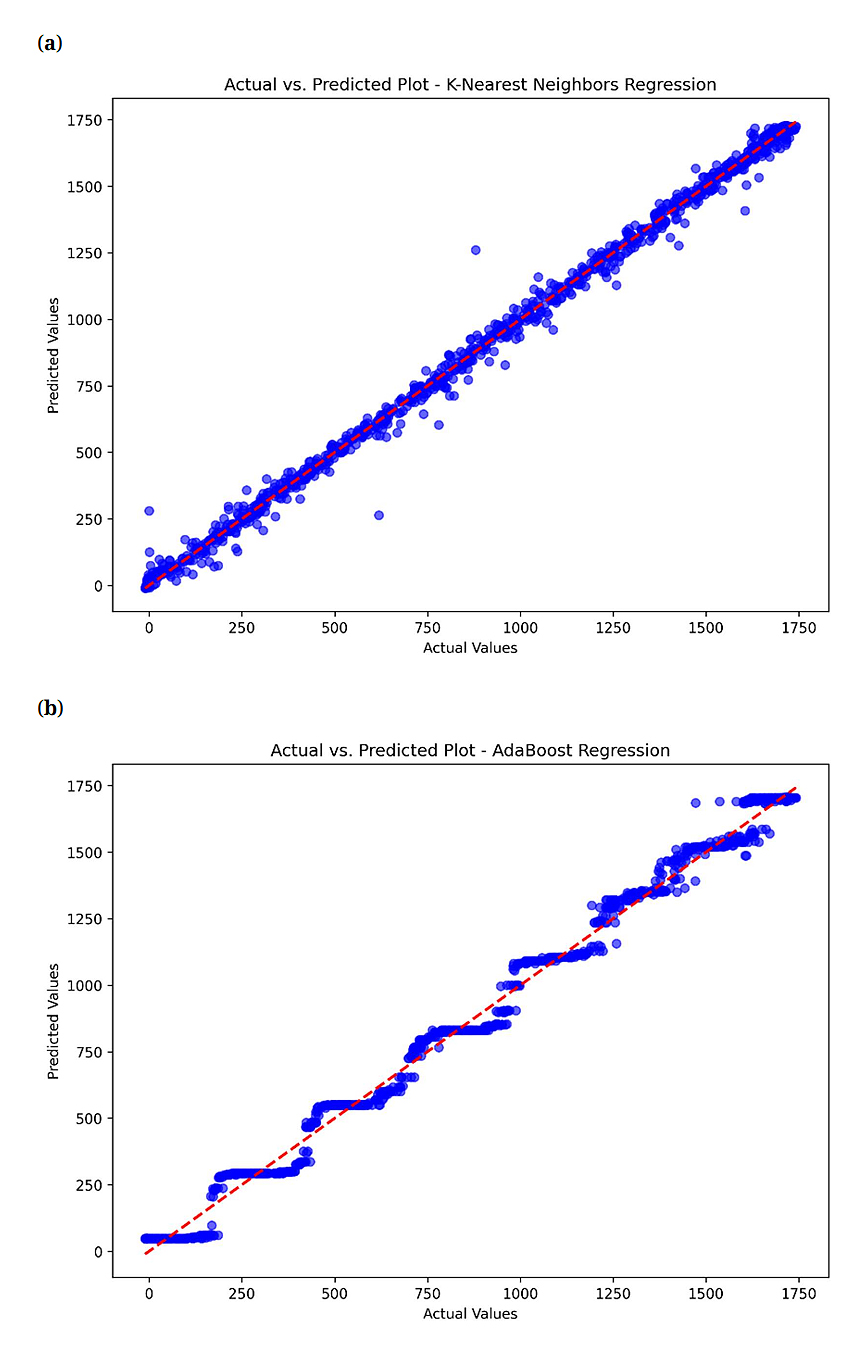 Figure 7. The predicted and actual values plot of machine learning models (a) k-NN Regression (b) AdaBoost Regression for summer season.
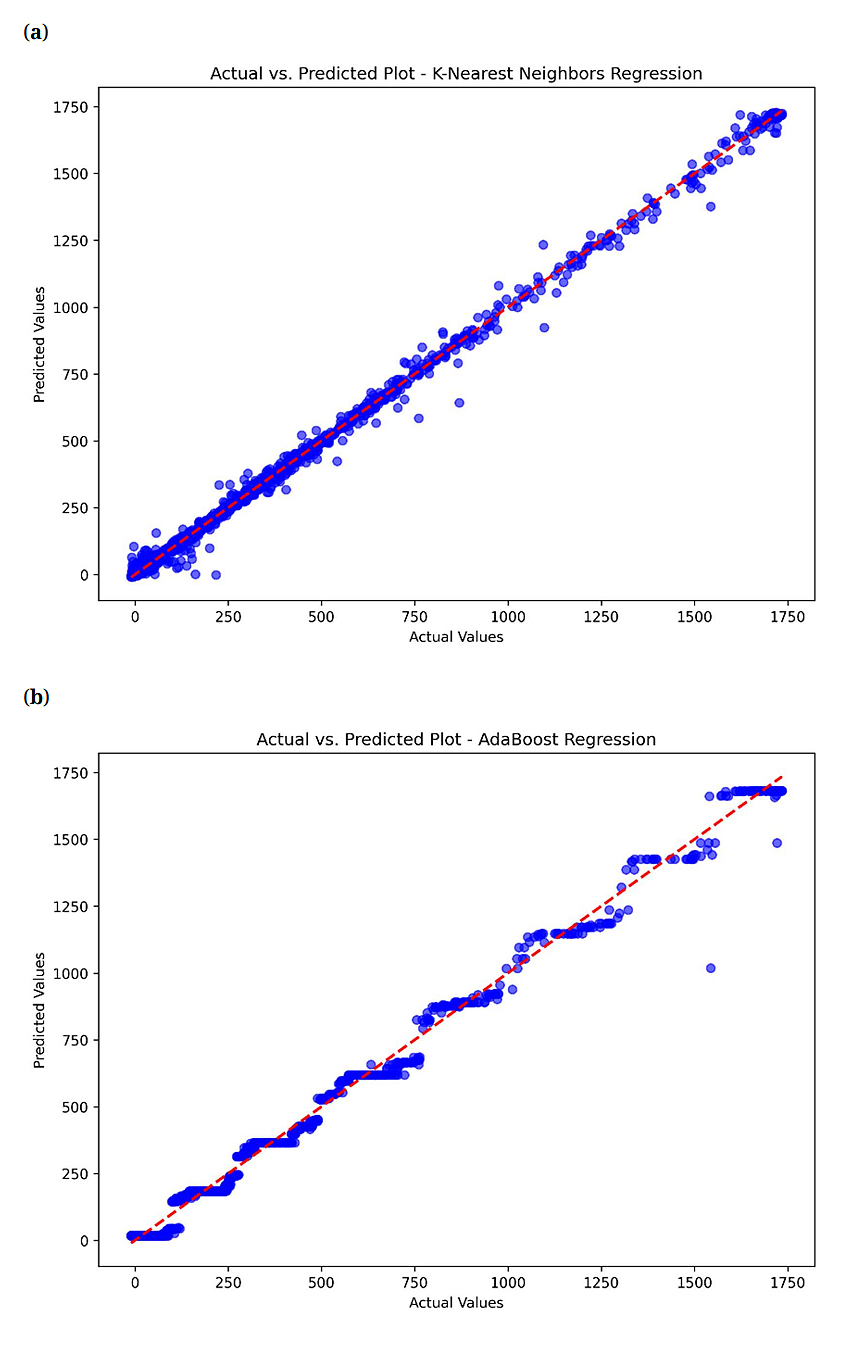 Figure 8. The predicted and actual values plot of machine learning models (a) k-NN Regression (b) AdaBoost Regression for autumn season.
In this study, a comprehensive analysis of wind power prediction using machine learning algorithms, specifically kNN Regression and AdaBoost, was presented, leveraging a dataset spanning from January 2018 to March 2020. The dataset was refined through seasonal variation and attribute selection, ensuring its suitability for model development. The results demonstrated the varying performance of kNN Regression and AdaBoost across different seasons, with kNN Regression exhibiting superior predictive accuracy in Winter and Autumn, while AdaBoost showed competitive performance in Spring and Summer. These findings highlight the importance of considering seasonal variations when selecting wind power prediction models. The evaluation of model performance using metrics such as MAE, MSE, RMSE, and R-squared scores provided a quantitative assessment of predictive accuracy, guiding stakeholders in selecting the most suitable model for their specific requirements. While this study provides valuable insights into wind power prediction, several limitations exist. The models’ performance may be influenced by factors not accounted for in the dataset, such as extreme weather events or changes in turbine efficiency over time. Future research could focus on incorporating additional features or refining existing models to enhance predictive accuracy and robustness.
The dataset is available in publicly accessible database.
KK: Conceptualization, Methodology, Writing—original draft; SK: Validation, Data Analysis; NR: Formal analysis; BM: Writing—review & editing.
The authors declare that there is no conflicts of interest.
1.
2.
3.
4.
5.
6.
7.
8.
9.
10.
11.
12.
13.
14.
15.
16.
17.
18.
19.
20.
Karthick K, Krishnan S, Rajavinu N, Muthuraj B. Seasonal Performance Analysis and Comparative Evaluation of Wind Power Prediction Models Using Machine Learning Techniques. J Sustain Res. 2024;6(2):e240029. https://doi.org/10.20900/jsr20240029

Copyright © 2024 Hapres Co., Ltd. Privacy Policy | Terms and Conditions


