Location: Home >> Detail
J Sustain Res. 2024;6(2):e240030. https://doi.org/10.20900/jsr20240030
 ,
Boglarka Anna Elias
,
Boglarka Anna Elias
Corvinus University of Budapest, Budapest 1093, Hungary
* Correspondence: Attila Jambor.
The role of food security has continuously been increasing during the recent decades and especially due to recent crises. This study investigates the determinants of food security in East Asia, South Asia, and Southeast Asia—regions that are critical to global food security due to their substantial population and agricultural output. Utilising a dataset spanning from 2001 to 2021 and employing a random effects regression model, this paper examines the influence of economic growth, agricultural performance, open economic activities, climate change, and crisis situations on food security. The study covers 357 observations from 17 countries within the selected regions. Results suggest that the relationship between economic growth and food security is not straightforward across the regions. While agricultural performance generally supports food security, the impact of open economic activities and external shocks like conflicts and climate change vary. Notably, recent global crises have had nuanced effects on food security, while the prevalence of undernourishment steadily decreased despite of the crisis events. The study highlights the complexity of achieving food security in Asia and the need for sustainable region-specific policies addressing both structural and transitory challenges. Policymakers need to consider a broader range of factors, related to sustainability, to effectively combat hunger and undernutrition.
Ensuring food security, defined as consistent access to an adequate quantity (availability) and quality (utilisation) of food over time (stability) [1], is fundamental for maintaining social stability and economic prosperity. Consequently, food security holds significant importance in both national and international political agendas. Several of the United Nations’ 17 Sustainable Development Goals (SDGs) are intertwined with food security, with SDG2, ‘Zero Hunger’, explicitly addressing this concern. Following the formulation of the SDGs at the United Nations Sustainable Development Summit on 25 September 2015, there was room for optimism about achieving substantial progress in SDG2. From 2002 to 2017, the trend in the global number of undernourished people was declining, however, in 2018 and 2019, there was a modest increase (+2.6% and +4.4%). In the subsequent years, 2020 and 2021, the increase was more pronounced at 14.5% and 5.3%, followed by a slight 0.5% decrease in 2022, bringing the global number of undernourished to 735.1 million—a regression to the 2006 level [2].
UN Food and Agriculture Organization (FAO) projections indicate an expected increase to 590.3 million undernourished people by 2030. This suggests that during the Sustainable Development Framework period (2015–2030), rather than achieving the targeted decrease, the number of undernourished people may increase by 0.24%. Even if the share of undernourished people in the population (prevalence of undernourishment, PoU) is likely to be smaller in 2030 than in 2015 due to expected population growth, this outcome would still fall short of the targets set by SDG2.
The pre-COVID-19 FAO projection in 2019 foresaw a 19.9% decrease in the global number of undernourished people. By contrast, a more modest decline of 3.6% was projected for 2021, reflecting the aftermath of the COVID-19 peak and preceding the conflict in Ukraine. The most recent scenario from 2022 expects a slight 0.24% increase in the number of undernourished people globally between 2015 and 2030 [3].
According to the FAO classification, chronic food insecurity arises from structural weaknesses, such as low income, with enduring effects. On the other hand, transitory food insecurity results from sudden shocks like conflicts and weather extremes, and its effects are temporary [4]. In the three FAO projections mentioned above, the annual change in the number of undernourished is projected to remain relatively consistent from 2025 onward. Consequently, the factors hindering food security due to recent crises may not significantly impact the long-term food security process. However, if the pace of food security development merely returns to pre-COVID-19 levels, the surplus of 120 million people who fell into undernourishment between 2020 and 2022 will persist compared to the pre-crisis scenario [3]. Consequently, the distinction between chronic and transitory food security becomes blurred.
The relationship between non-food-security crises and their impact on food security is often challenging to determine due to multicausality and mutual reinforcement between outcomes of certain non-food-security crises and their direct and indirect effects on food security. The Global Report on Food Crises (GRFC) presents analyses of countries experiencing food security crises in specific years. From 2018 to 2023, the primary drivers of food crises were crises of conflict, weather extremes, and economic shocks nature [5–10].
Until 2019, conflict and weather extremes stood out as the two most significant causes of food crises in the countries examined in the GRFC reports [5–10]. However, from 2020 onward, conflict remains the driver resulting in the biggest food crises in terms of number of affected people, while economic shocks drag the most countries into food crisis and weather extremes became a relatively less significant factor. While the extent or frequency of natural disasters has not decreased, economic problems have reached a level where they surpass the food security-related effects of weather conditions [5–10].
The lesson extracted from the [5–10] and [3] annual reports is that global crises, such as COVID-19, the war in Ukraine, or even pre-existing issues like the 2007–2008 food price crisis, do not solely explain deep food security crises. Food security is most jeopardised when the pre-existing structural weaknesses of local food and economic systems intersect with the direct or indirect effects of local security, climate, or economy-related crises, and/or the direct or indirect effects of a global crisis on market prices, supply chains, national currencies etc.
In this paper, we assess the determinants of food security in three major regions of Asia: East Asia (encompassing China with Taiwan, Hong Kong SAR, and Macao SAR; Mongolia; North Korea (DPRK); South Korea (ROK); and Japan), South Asia (comprising Afghanistan, Bangladesh, Bhutan, India, Maldives, Nepal, Pakistan, and Sri Lanka), and Southeast Asia (including Brunei, Cambodia, Indonesia, Laos, Malaysia, Myanmar, Philippines, Singapore, Thailand, Timor-Leste, and Vietnam). These three regions are highly populous, collectively representing more than half of the global population, and thus, they play a significant role in global food consumption and production. Furthermore, in economic and food security terms, the countries within these regions exhibit substantial variations. The presence of conflicts and extreme weather conditions in certain parts of these regions makes it possible to account for local crises of this nature.
The paper contributes to the existing literature in three ways. First, it gives an update on the latest trends of food security in three Asian regions. Second, it identifies the determinants of food security, especially considering those related to recent crises. Third, it provides better understanding of food security dynamics to policy makers.
The paper is structured as follows. Chapter 2 (LITERATURE REVIEW) provides a brief review of the literature so far, followed by a description of the methods used. Chapter 4 (THE FOOD SECURITY LANDSCAPE OF SOUTH AND EAST ASIA AND ITS DETERMINANTS) shows some descriptive patterns of regional food security, followed by the presentation and discussion of our regression results. Chapter 6 (CONCLUSIONS) concludes.
The application of panel data analysis to identify food security determinants is not unprecedented. Demeke et al. (2011) sought to identify food security determinants using panel data from Ethiopian rural households and employed a fixed-effects regression model. Their findings indicated that factors such as rainfall variability, household size, participation in local savings groups, and livestock ownership had a positive impact on the food security of the involved households [11].
Subramanyam et al. (2011) found an inverse association between economic growth and food insecurity in India using fixed and random effects logistic models [12]. In Kenya, Mutisya et al. (2016) discovered that higher levels of education reduced the risk of severe food insecurity through the application of a random effects generalised ordered probit model [13]. Dithmer and Abdulai (2017) examined the impact of trade openness and economic growth on dietary energy consumption and dietary diversity analysing data from 151 countries between 1980 and 2007. Their linear dynamic panel data model demonstrated a positive and significant impact of the independent variables on dietary outcomes [14]. Affoh et al. (2022) analysed panel data from 25 sub-Saharan African countries between 1985 and 2018 to assess the relationship between precipitation, temperature, CO2 emissions, and the availability, access, and utilisation dimensions of food security. Their findings revealed that rainfall positively affected all three dimensions, temperature negatively impacted availability and access but had no effect on utilisation, while CO2 emissions positively influenced both availability and access but did not affect utilisation [15].
Population growth also appears to be a determinant of food security according to the literature, often demonstrating an inverse relationship. In the analysis of former Yugoslav countries, Kovljenič and Raletič-Jotanovič (2020) found that a 2.85% growth in population resulted in a 1% increase in the prevalence of undernourishment [16]. Additionally, according to Applanaidu and Baharudin (2014), a sudden change in population has a negative but temporary impact on food security [17]. Aiyedogbon et al. (2022) found that population growth is significantly but variably associated with agricultural output and consequently, food security over time [18].
The relationship between economic growth and food security is far from as evident as one might think. Aziz et al. (2021), in their examination of South Asia, found that a 1% GDP growth reduced the number of undernourished people by 0.005% [19]. Warr (2014) also found an inverse association between GDP per capita and undernourishment; however, in the case of Asia, the result was not statistically significant [20]. According to Applanaidu and Baharudin (2014), a shock in GDP growth results in a decline in food security, but this effect is not immediate; instead, it is strongest 2 years after the economic shock [17]. In contrast, Ramessur and Bundhun (2022) found that in parallel with the growth of GDP per capita, the level of food security declined in the Maldives [21]. The study by Holleman and Conti (2020) also detected this phenomenon and concluded that in the case of countries with high income inequality, the positive effect of economic growth on food security cannot prevail. Instead, there is a simultaneous increase in GDP and undernourishment in these countries [22].
On the whole, various studies have concentrated on different factors behind food security so far but the number of studies taking into account different determinants at the same time are limited—a gap which paper aims to fill in.
The aim of this paper is to identify the various determinants of food security in Asia. Based on the above literature, the following hypotheses are tested:
H1: The growth of average economic size foster food security.
The difference in resources can be measured in various ways—we use two proxies here: population and GDP, suggesting that increasing population challenges food security. While keeping in mind the above introduced ambiguous results of the literature on the association between GDP growth and food security level, we still assume that in case of the three examined regions, higher GDP levels guarantees higher food security levels. Population is measured in million people, while GDP is measured in million USD—population size is expected to be positively related to prevalence of undernourishment, while GDP is thought to be negatively related.
H2: Open economic activities positively influence food security.
Open economic activities and liberal trade relations are generally thought to increase economic prosperity and hence food security. Three proxies are used here to capture these effects: FDI (Foreign direct investment) inflows (measured in million USD), exchange rates (local currency/USD) and the dependency on cereal imports (in percentage). Higher FDI rates assume higher capital for food infrastructures and technologies, higher employment and household incomes, thereby a negative relationship with prevalence of undernourishment, unlike weak exchange rates, where a positive relationship is assumed. Cereal import dependency, in our understanding, fosters undernourishment, so again a positive association with PoU is expected.
H3: Higher performance of the agriculture sector decreases food insecurity.
It seems to be evident that higher performance of the agriculture sector guarantees food security. Three proxies are used to capture these impacts: share of agricultural employment in total employment, gross production value of agriculture and producer prices of agricultural products. Higher agricultural employment rates and production values are expected to be negatively related to prevalence of undernourishment, while higher producer prices are expected to foster undernourishment through decreasing food access.
H4: Higher changes in average temperature are against food security.
Agriculture and the climate are strongly linked together. Climate change impacts, measured in temperature changes, assume lower yields, higher variability and lower reliability of agricultural production and thereby increased prevalence of undernourishment.
H5: Crises situations cause food security to decrease.
Previous years have shown several crises situations, impact of which on food security are also about to be tested. We have introduced five dummy variables to capture the effects of crises situations: refugees, deaths in battles, price booms, crises in time and delayed crises in time. The first two represent the years of fatal casualties on the battlefield within the country’s territory and the years when the number of refugees hosted by the country equalled at least 0.01% of the country’s population. The crisis dummy variable identifies the years of the 2007–2008 food price crisis (extremely affecting Southeast Asia) and the years of the COVID-19 pandemic (2020–2021).
By examining food price trends in East, South, and Southeast Asia, we can explore deviations from the global average. Notably, during 2019–2020, food prices in the three examined regions increased significantly, unlike the global trend. While globally, prices continued to rise amid the ongoing COVID-19 crisis, prices in East, South, and Southeast Asia decreased remarkably in 2021 [2] (See below Figure 1). Hence, a fourth dummy variable was introduced, representing the years of significant food price increase in the three regions. The distinction between these two dummy variables aims to understand whether price increases or more complex crises have a more influential impact on food security. The last dummy variable is the ‘delayed crises’ variable, based on the findings of Applanaidu and Baharudin (2014) about delayed food security effects of economic downfalls [17] and based on our assumption that households are more likely to cut expenditures on other items before reducing spending on food. Thus, during economic crises or food price spikes, the consequences, such as people falling into undernourishment, may not appear immediately. The ‘delayed crises’ dummy variable marks the years of global crises plus one. All crises dummy variables are expected to have a significant positive relationship with prevalence of undernourishment.
The paper applies a random effects regression model to identify the determinants of food security in Asia between 2000 and 2021, based on a dataset containing 357 observations. The following model is applied and tested:
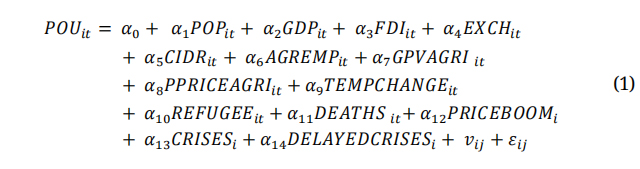
where i stands for a particular country, while t stands for time.
Table 1 presents an overview of the description of variables and the associated hypotheses.
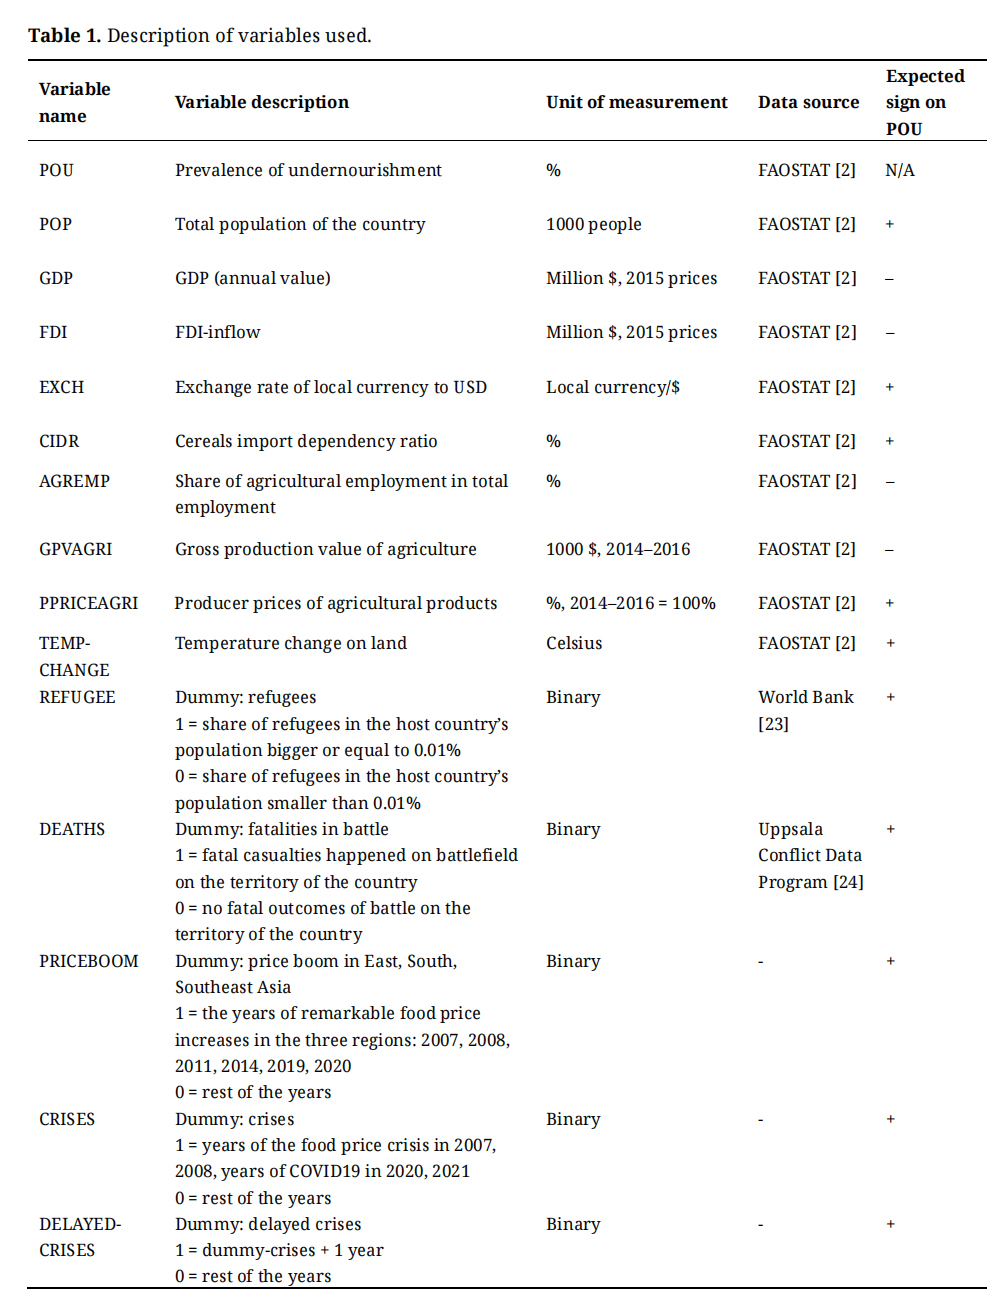 Table 1. Description of variables used.
In estimating the determinants of prevalence of undernourishment, we use the generalised least square (GLS) random effects model. Standard regression and panel unit root tests were applied before estimations and we have not found any multicollinearity, heteroskedasticity or unit roots.
The research focuses on countries in East, South, and Southeast Asia. For China, mainland China, Taiwan, Hong Kong SAR, and Macao SAR were considered separately. Due to a lack of data, 10 countries were excluded. The final panel includes the following countries: Bangladesh, Cambodia, China—Hong Kong SAR, mainland China, India, Indonesia, Japan, Laos, Malaysia, Mongolia, Nepal, Pakistan, Philippines, South Korea, Sri Lanka, Thailand, and Vietnam. The observed period spans from 2001 to 2021, with data retrieved from FAOSTAT [2], World Bank Data Bank [23], and the Uppsala Conflict Data Program [24].
We employ two different approaches in running regressions in line with Bakucs et al. (2018) [25]. First, for more robust data, we run GLS random effects regression in STATA18, involving all 17 countries with available data from the three regions without any differentiation between them (“three regions” regression with 357 observations). Second, for more regionally specific results, we run GLS random effects regressions for each of the three regions, including only the countries belonging to the respective region.
The food security landscape across the countries of the discussed three regions is notably diverse. On the Global Food Security Index ranking list, countries from these regions exhibit high scores (Japan, China, Singapore) as well as low scores (Pakistan, Laos, Bangladesh, Sri Lanka—[9]). On a regional level, the protein, fat, and overall food supply per capita are above the global average in East Asia and below it in South and Southeast Asia (Table 2). Compared to 2015, there has been a 5.0% and 5.2% increase in food supply in South and Southeast Asia, and a 9.9% and 8.3% increase in protein supply, respectively. The meat and fish consumption in Asia is anticipated to grow by 73% until 2050, based on 2017 figures, with Southeast Asia expected to contribute the most substantial increase [26].
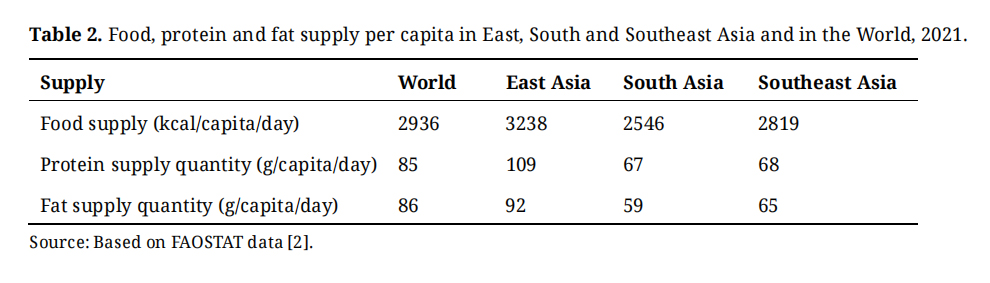 Table 2. Food, protein and fat supply per capita in East, South and Southeast Asia and in the World, 2021.
In alignment with the presented supply data, the prevalence of undernourishment in East Asia is generally low, notwithstanding higher values in countries such as Mongolia, Macao SAR, or Taiwan. Notably, mainland China, the most populous entity in the region, boasts the lowest FAO-given value (<2.5%), influencing the overall prevalence for the entire region. Southeast Asia has demonstrated improvement from 2015 to 2021, with the prevalence of undernourishment decreasing from 7.5% to 5.3% during this period. Conversely, South Asia stands out as one of the most food-insecure regions globally, with a 16.9% prevalence of undernourishment in 2021, marking a 2.5% increase from 2015. By region, the PoU decreased in East Asia from 9.6 to 3.7 from 2001 to 2021, while from 19.1 to 11.4 in South Asia and from 19.00 to 4.8 in Southeast Asia.
As to the determinants of food security, the combined population of the three regions accounted for 54.4% of the global population in 2023, showing a growing trend. East Asia had 1.65 billion people, South Asia had 2.0 billion, and Southeast Asia was home to 682 million individuals [27]. The urban population consistently grew in all three regions over the last few decades. In 2021, 66% of East Asia’s population, 51% of Southeast Asia’s population, and 37% of South Asia’s population lived in urban areas. Aligned with the declining share of rural residents, the proportion of agricultural employment in total employment has also diminished since the millennium, reaching 22.2% in East Asia, 29.2% in Southeast Asia, and 41.5% in South Asia in 2021 [27].
East, South and Southeast Asia contributed 33.7% to the global GDP in 2021, though not evenly distributed. East Asia alone produced 26.0% of the global GDP and accounted for 77.0% of the combined GDP of the three discussed regions in 2021 [2]. Within these regions, there is a diverse economic landscape, featuring high-income countries like Japan, South Korea, or Singapore, upper-middle-income countries such as China, Thailand, Indonesia, lower-middle-income countries like Mongolia, India, or the Philippines, and low-income countries including Afghanistan and North Korea. In 2021, the GDP per capita of East Asia was $15,200, which was 24.9% more than the global average of $12,200. In Southeast Asia, the GDP per capita was less than half of the global value, standing at $4945.8, while in South Asia, it was less than 20% at $2157.8 [2].
The populations of low-income and lower-middle-income economies are often the most vulnerable to economic crises, which impact household incomes and/or food prices [28,29]. Between 2001 and 2022, the three regions experienced several food price shocks, with the 2007–2008 crisis being the most severe (Figure 1).
The East Asia region, with the purchasing power of its high-income countries and the economic potential of China, attracted 23.3% of global foreign direct investment in 2021. Meanwhile, 10.8% of the global FDI flowed into the emerging economies of Southeast Asia. However, South Asia, with its weaker purchasing power and security issues, could only attract 0.4% of FDI inflow from around the world. The East Asian region is a significant investor as well, accounting for 29.1% of foreign direct investment worldwide. Notably, Japan (10.8% of global FDI outflow in 2021) and Mainland China (9.2%) were the biggest investors from East Asia [2].
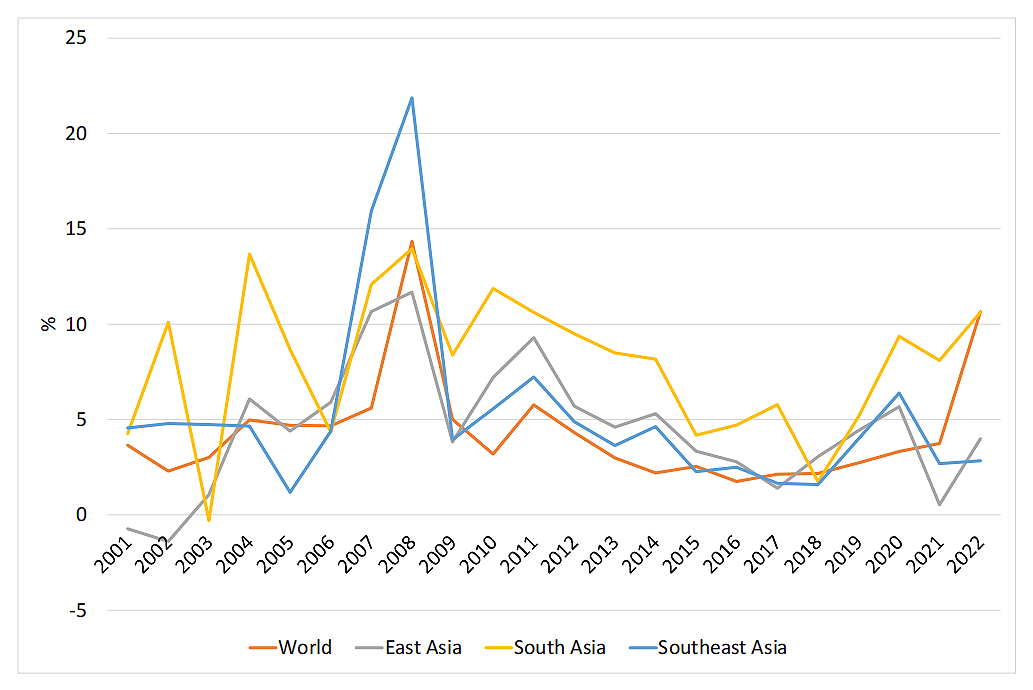 Figure 1. Average monthly change in food prices in East Asia, South Asia, Southeast Asia and the world, 2001–2022, percentage. Source: FAOSTAT data [2].
Feeding half of the world’s population with only 23.1% of the world’s agricultural land poses a remarkable challenge for the agri-food production systems in the three regions analysed [2]. According to FAO data from 2022, 45.2% of global cereal production (with rice accounting for 89% of the global production), 49.4% of oil crops production, 38.6% of meat production (where pork production has the highest global share at 53.6%), 37.7% of dairy production, and 60.3% of egg production occurred in these regions. Within the three regions, East Asia dominates in cereals, roots and tubers, vegetables, fruits, meat, and egg production. The majority of oilseeds production takes place in Southeast Asia, and South Asia leads in milk production (Table 3). The combined gross agricultural production value of the three regions was $2311.6 billion in 2021 [2], with 63.1% belonging to East Asia, 24.0% to South Asia, and 12.9% to Southeast Asia.
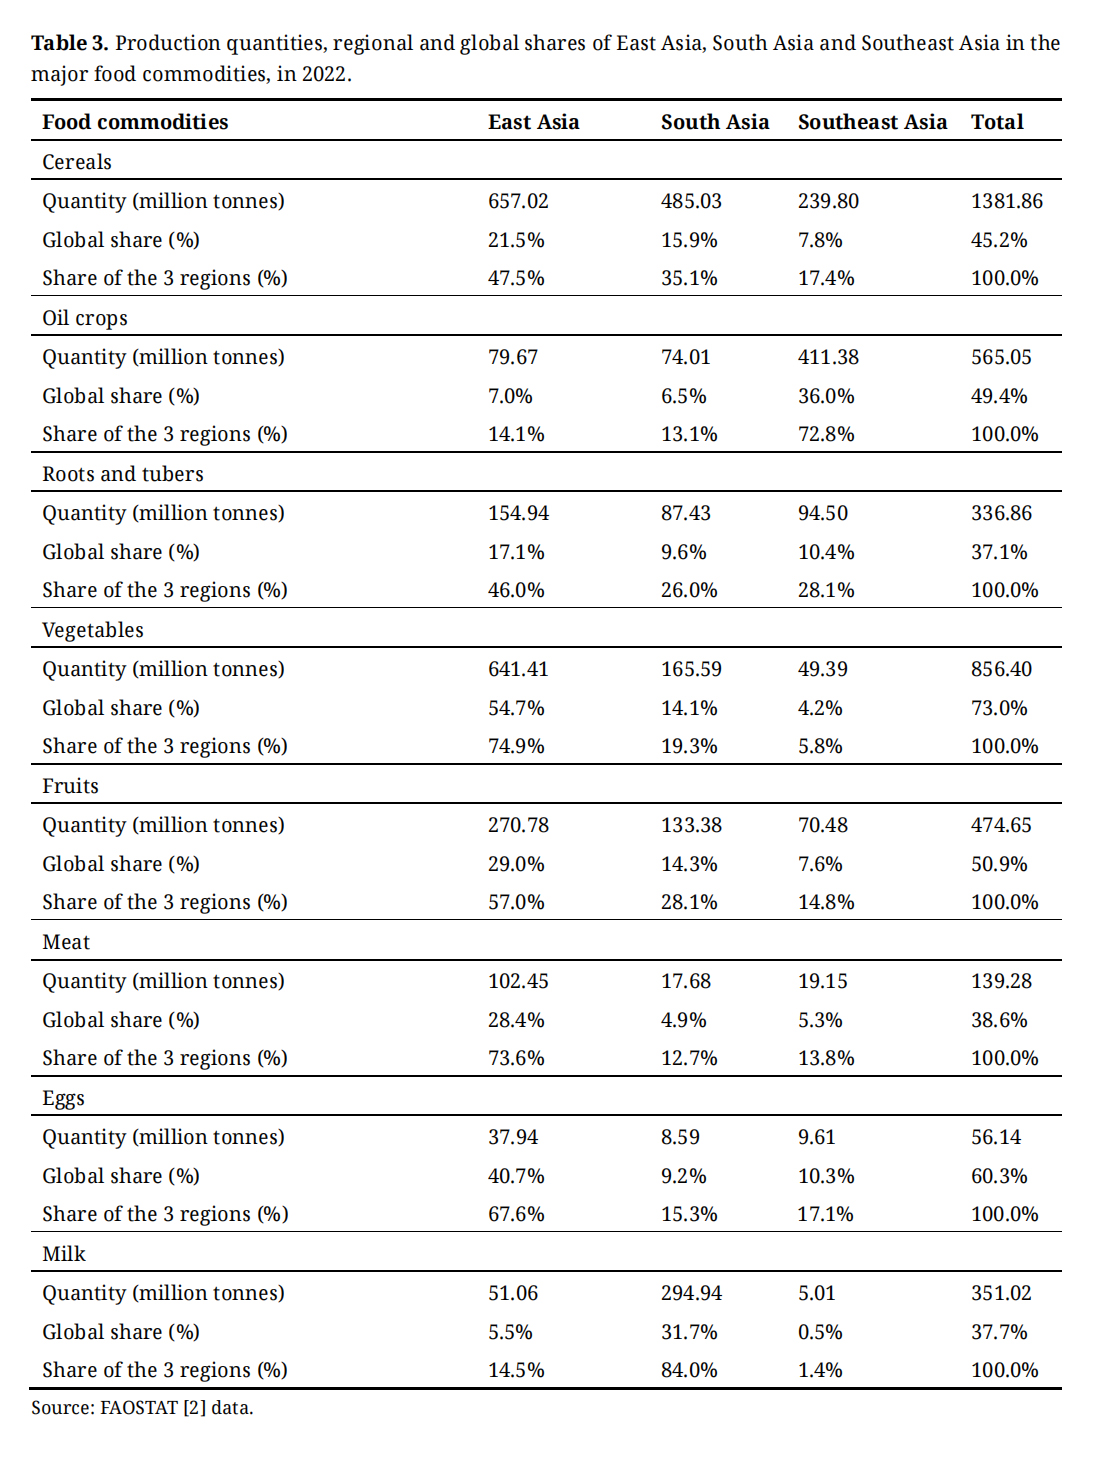 Table 3. Production quantities, regional and global shares of East Asia, South Asia and Southeast Asia in the major food commodities, in 2022.
The three regions are not self-sufficient in the production of most staple food categories; therefore, agri-food trade plays a crucial role in ensuring their food supply. In 2022, 27.2% of the food trade volume within the three regions was internal, while 72.8% involved global trade with countries outside of these regions. In East Asia, 87.7% of the region’s foreign food trade consists of imports, with China (mainland) accounting for 66.1% and Japan for 15.7% of regional agri-food imports. Both China and Japan are significant global players in terms of the value of food imports. In South Asia, agri-food exports surpass import volumes by 31.4 million tonnes, constituting a 17% surplus. India, as the main producer in the region, contributed to 78.6% of South Asia's total exports. In Southeast Asia, major agri-food exporters in 2022 were Thailand (29.3%), Indonesia (29.2%), Malaysia (25.4%), and Vietnam (22.0%) (Figure 2). In terms of value, the combined agricultural imports of the three examined regions accounted for 27.0% of global imports in 2021, while their exports constituted 11.4% of global exports [2].
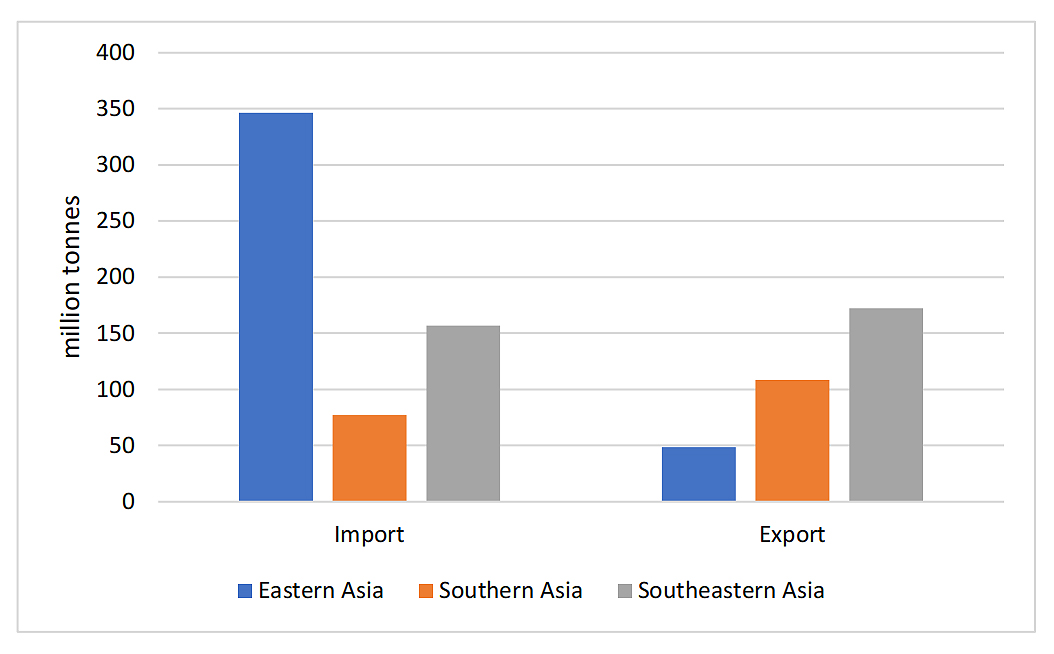 Figure 2. Agri-food foreign trade volume of East Asia, South Asia, Southeast Asia (excluding the trade between these three regions), in 2022, million tonnes. Source: FAOSTAT data [2].
Security concerns are also prevalent in these regions, determining food security levels. These concerns include tense relationships between North and South Korea, Mainland China and Taiwan, India and Pakistan, territorial disputes in the East China Sea, the South China Sea, and the Ambalat Block, the China-India border dispute, the presence of the Abu Sayyaf Group militants in South Philippines, and piracy posing a threat to maritime trade [30]. Approximately one million Rohingya refugees have been living in the Cox Bazar’s region of Bangladesh since fleeing Myanmar in 2017. The Taliban takeover in August 2021, following the American withdrawal, resulted in a record refugee outflow from Afghanistan, while skirmishes in the bordering regions between Pakistan and Afghanistan have persisted for decades.
In addition to security concerns, weather extremes have doubled worldwide since the 1990s, and droughts and floods have become more frequent in these regions [6]. The Global Climate Risk Index from Germanwatch is calculated by the multiplication of differently weighted rankings of a certain country in terms of fatalities, fatalities per 100 thousand inhabitants, losses (USD), and losses per GDP due to weather extremes like droughts, floods, storms, heatwaves, etc. A higher index score indicates a smaller risk. According to the last calculation in 2019, the countries in the three regions most exposed to climate-related risks (having the lowest scores in order) were Japan, Afghanistan, India, Nepal, Bangladesh, Indonesia, Pakistan, Myanmar, and Mongolia. The average score was 55.5 in East Asia, 44.8 in South Asia, and 72.2 in Southeast Asia [31].
The characteristics outlined above, spanning the economy, food production, trade, and supply, highlight significant food security-related structural weaknesses in all three discussed regions. In South Asia, both food availability (supply) and economic access (GDP per capita) face deficiencies. In Southeast Asia, availability and access are notably below the world average, although this region is experiencing dynamic development in terms of both economy and food security. While food security in East Asia is generally stable, countries like Mongolia or North Korea encounter challenges in economic access and availability. Additionally, even the most developed countries in the region are net food importers, relying on international food supply chains, with economic access heavily influenced by world market prices.
As to the determinants of food security, our results suggest a diverse picture (Table 4). In terms of average economic size, both population and GDP seem to be significantly and positively related to prevalence of undernourishment, suggesting that countries with more people and bigger economies tend to be less food secure. While the influence of population size on food security aligns with the literature, it appears to be less influential in the examined regions compared to findings such as Kovljenić and Raletič-Jotanovič (2021). They found that a 2.85% growth in population resulted in a 1% increase in PoU in the countries of the former Yugoslavia [16], whereas in East, South, and Southeast Asia, a larger 3.5%–4.0% (156.7 million people) population increase results in a 1% growth in undernourishment.
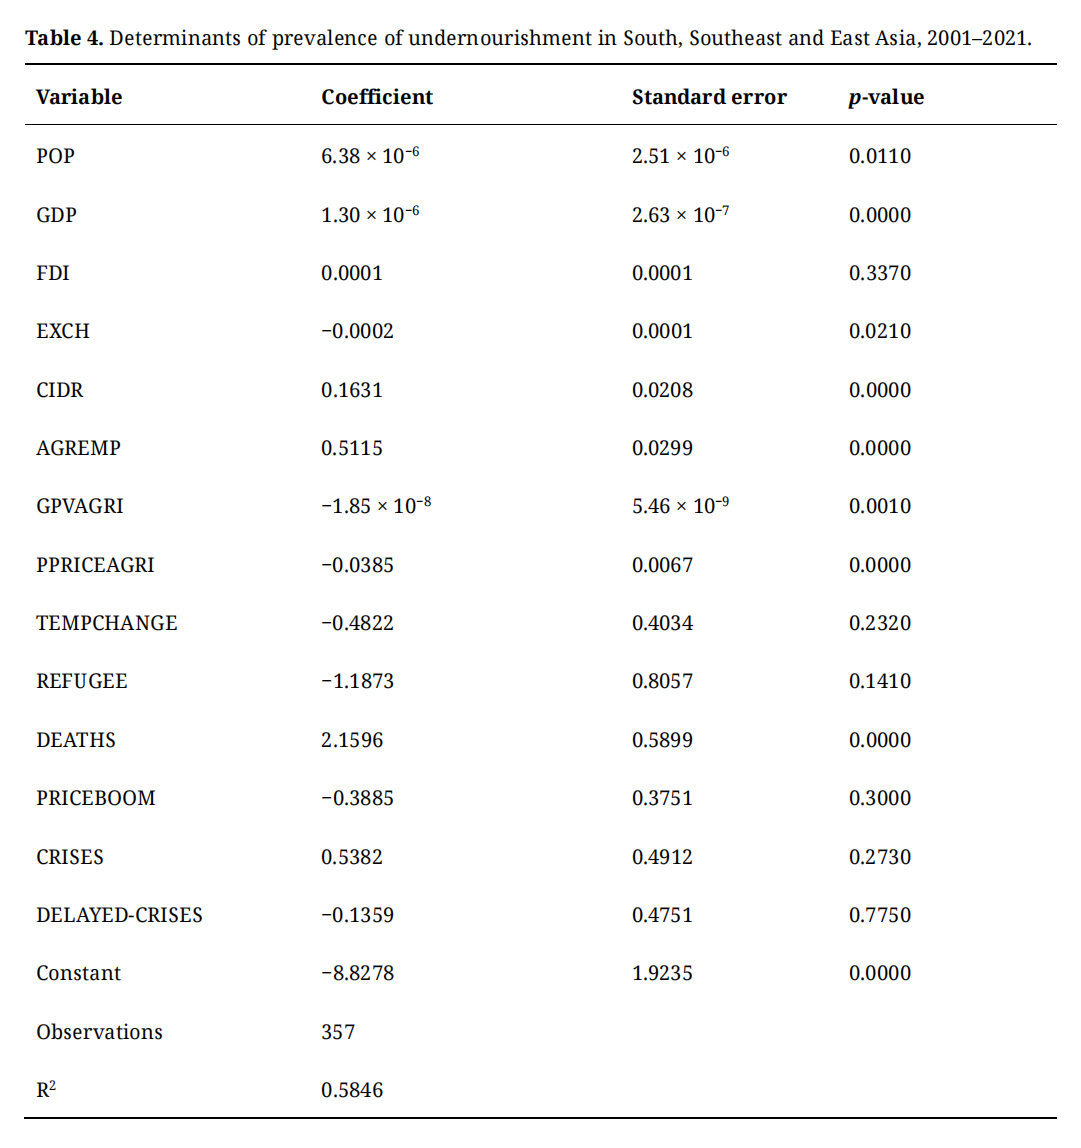 Table 4. Determinants of prevalence of undernourishment in South, Southeast and East Asia, 2001–2021.
Figure 3 demonstrates the relationship between population and prevalence of undernourishment in the discussed countries from 2001 to 2021 average values, showing why undernourishment is not as sensitive to changes in population in the chosen three regions. Examples include instances where a large population is paired with a high PoU value like in India, Pakistan, Bangladesh and Indonesia. Conversely, there are cases of countries with small populations having lower PoU values, like South Korea and Hong Kong. However, notable exceptions exist: China, the country with the largest population, and Japan, the sixth most populous country, exhibit low PoU values. On the other hand, Mongolia, with the smallest population, has the highest percentage of undernourished people on the 2001–2021 average. It is striking that the three exceptional countries are all from East Asia.
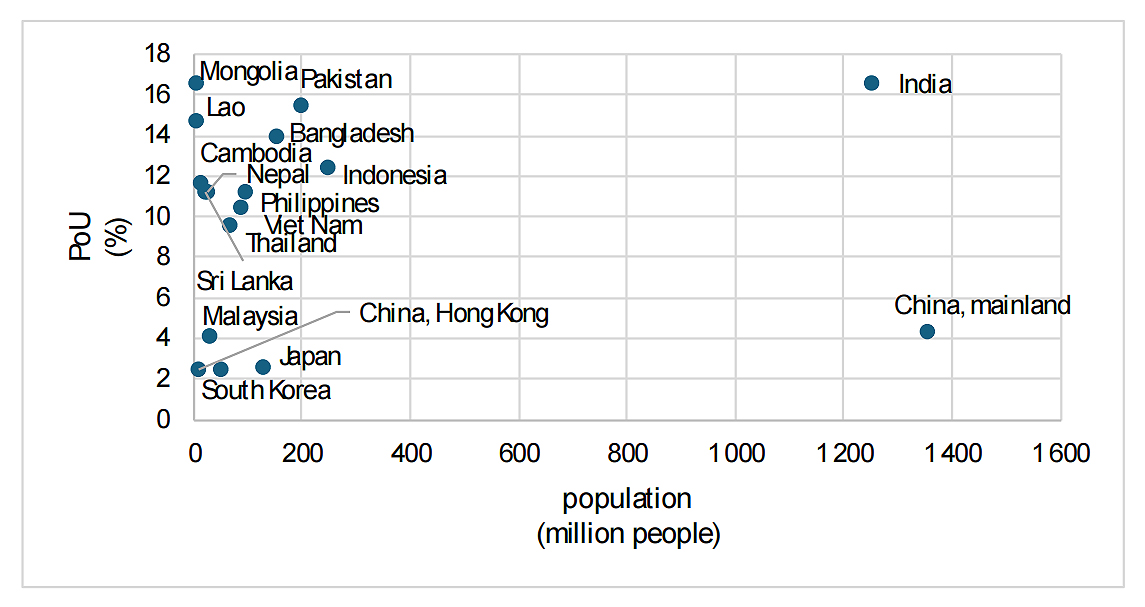 Figure 3. Relationship between population and prevalence of undernourishment in South and East Asia, 2001–2021 averages. Source: Own compilation based on FAOSTAT data [2].
As to open-economy related determinants, FDI inflows were found to be positively but not significantly related to the prevalence of undernourishment in South and East Asia between 2001 and 2021. However, exchange rate and cereal import dependency ratio were both significantly related to PoU, though with different signs (exchange rate negatively, cereal import dependency positively affected PoU).
Note that the national currency of Mainland China, South Korea and Thailand became stronger compared to USD between 2001 and 2021, while the exchange rate of Japan, Hong Kong and the Philippines stagnated (in the rest of the countries, the exchange rate became higher, their national currency lost value to USD). Exchange rate related results, however, should be taken with caution as they may reflect the effects of the overall economic development over the examined twenty years which in most of the analysed countries was executed with weakening national currencies.
Regarding agriculture sector related determinants, results suggest an ambiguous picture. Higher shares of agricultural employment seem to be significantly and positively related to the prevalence of undernourishment, while higher agricultural production values and producer prices significantly decrease prevalence of undernourishment. The first argument is also evident from Figure 4, drawing a scatter plot on agricultural employment share in total employment and PoU. Although a linear and positive relationship is observable, note that the scatter plot illustrates the average values between 2001 and 2021, which does not reflect changes over time. As to the value of agricultural production, a statistically significant and negative relationship holds, suggesting that higher production value decreases the prevalence of undernourishment, as expected.
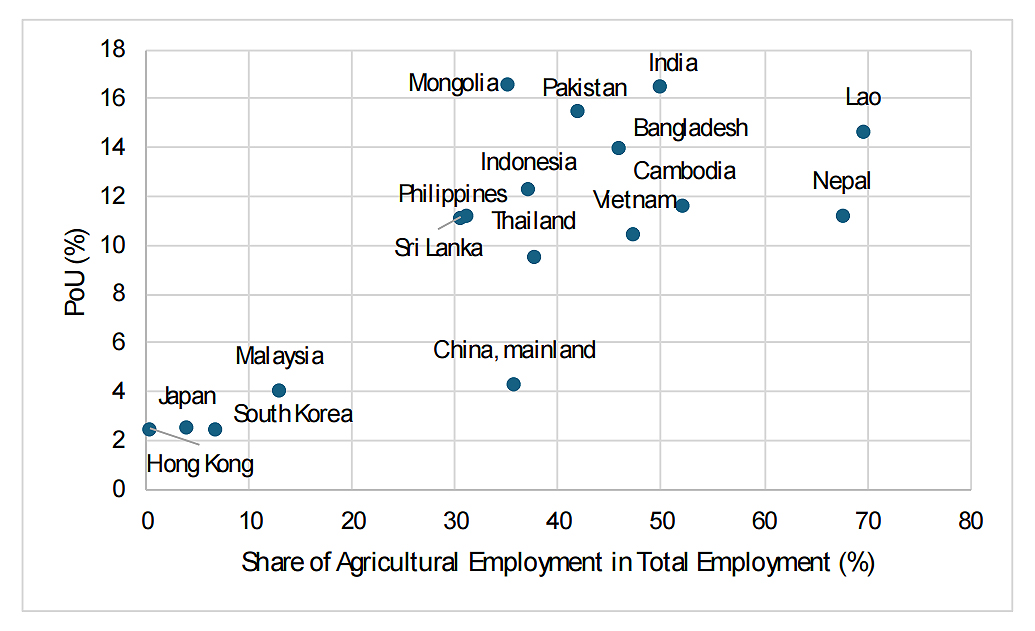 Figure 4. Share of agricultural employment in total employment and prevalence of undernourishment in the examined countries, 2001–2021 average.
The producer price of agricultural products also appears to be a relevant determinant of food security in the region. We found an inverse relationship between prevalence of undernourishment and producer prices—if producer prices increase, undernourishment decreases. To understand the reason behind this inverse relationship, one need to look at the agricultural employment data—while globally the share of employment in agriculture in total employment is 26.58% [2], in Southeast Asia this value is 29.16, in South Asia it is 41.5 percent and in East Asia, it is 22.15% [2]. Consequently, the rural population employed in agriculture can achieve higher incomes from higher producer prices, thus, they can improve their economic access to food.
As another determinant of food security, temperature change appears to be a statistically not significant determinant for food security in the region, though an inverse relationship was found—we assume a similar reasoning than we had about interpreting exchange rate results (being parallel in time with economic development).
Last but not least, the crises related dummy variables which we created based on the conclusions of the literature were in general not found to be statistically significant, except for the deaths in battle dummy variable on the territory of the given country. Not surprisingly, there is positive relationship between prevalence of undernourishment and deaths in battle, as expected.
The ‘per region’ analysis helps us to better understand regional patterns of food security determinants (Table 5). In the case of East Asia, for instance, population growth has a significantly positive impact on food security, not like in South and Southeast Asia (though the impact was found to be very small). The entities omitted in this region due to a lack of data are North Korea (25.97 million people in 2021) and China, Taiwan (23.86 million people) with relatively similar population sizes. Taiwan has a very low, 3.0% PoU rate, while in North Korea, the estimated share of undernourished people is very high, 45.5%. Therefore, we can assume that in terms of the effects of population size on food security, these two entities are cancelling each other out, so the inclusion of them into the regression would not change the regional result significantly. The South Asian and Southeast Asian results are in line with the literature.
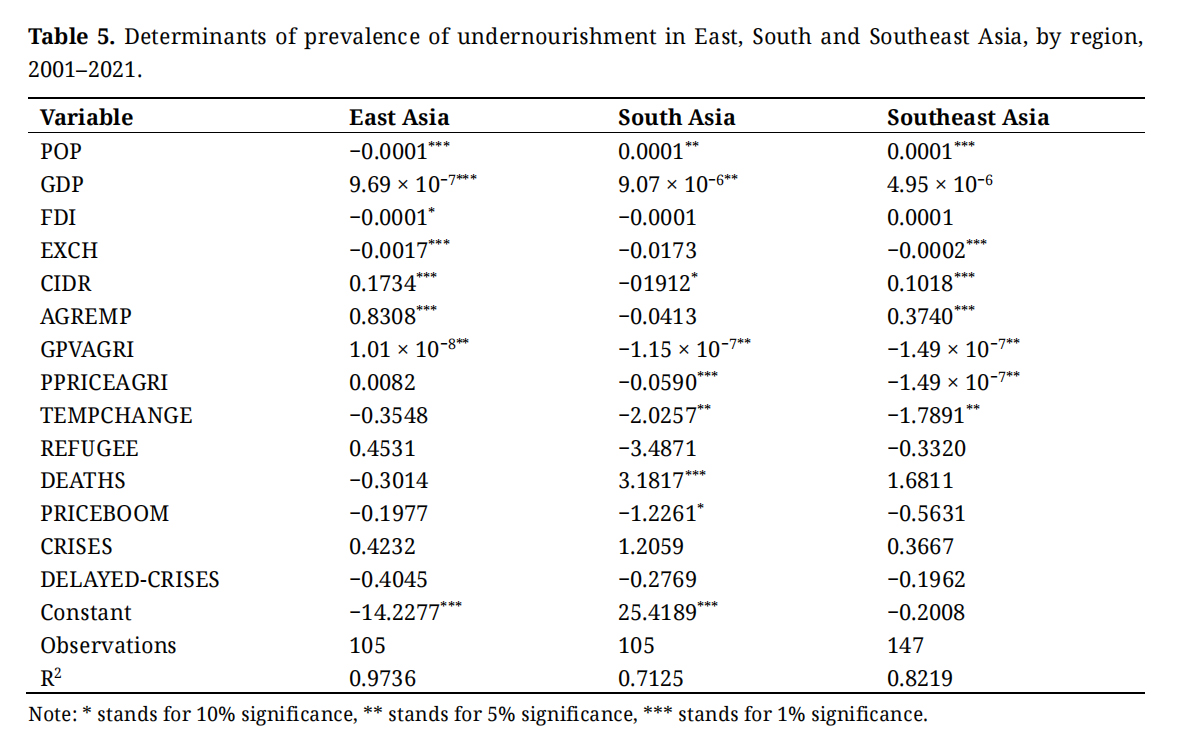 Table 5. Determinants of prevalence of undernourishment in East, South and Southeast Asia, by region, 2001–2021.
However, economic size does not exhibit a statistically significant relationship with food security in Southeast Asia and found to have little impact on food security in all subregions analysed. The positive relationship with undernourishment supports the above presented similar findings [21,22] of the literature.
As to open economy related variables, FDI inflow was still found to be insignificantly related to PoU, though signs were changed, compared to the whole sample. The role of exchange rate was the same as the whole sample by region, though cereal import dependency was interestingly found to be negatively related to PoU in South Asia in the period analysed.
In Table 3, agricultural employment turned out to be a significant determinant of food security for the three regions together, and also for East and Southeast Asia, but not for South Asia. The magnitude of the impact is relatively strong. The reason behind the case of South Asia, we can look at average respective values of 2001–2003 and 2019–2021 (Figure 5). Nepal had the highest agricultural employment share among the examined South Asian countries in the time of 2001–2003 and 2019–2021, however, in terms of PoU, Nepal turned from the last to the first in the last two decades with recently having the lowest prevalence of undernourishment in the region. Furthermore, while Bangladesh had the largest decrease in agricultural employment share (−31.8%) comparing the two chosen period, in prevalence of undernourishment, Bangladesh had the smallest change (−22.5%). The GLS random effect regression model considered these changes over time, therefore agricultural employment share turned out to be statistically not significant.
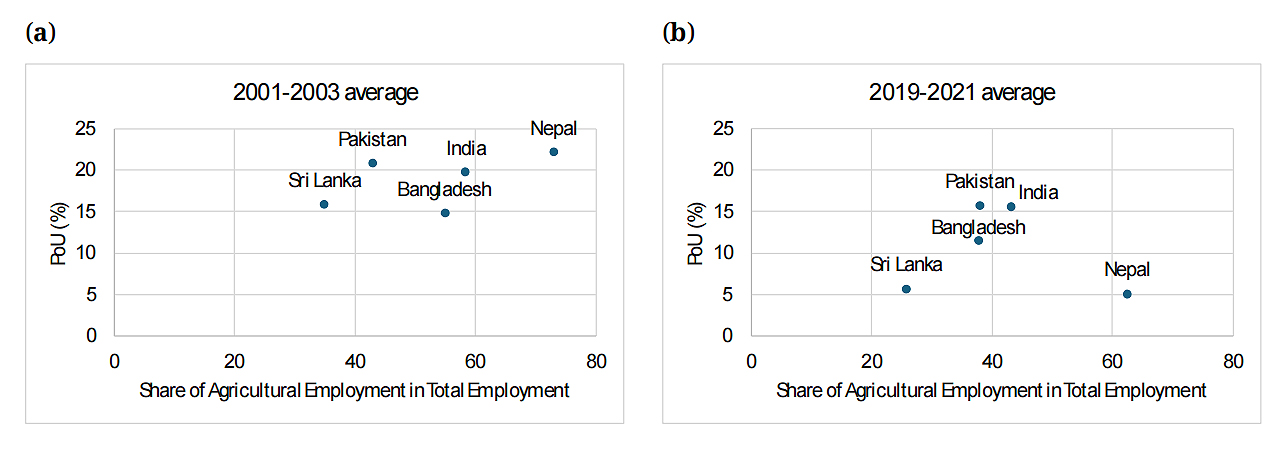 Figure 5. Share of agricultural employment in total employment and prevalence of undernourishment in the examined South Asian countries, (a) 2001–2003 and (b) 2019–2021 average. Source: Own compilation based on FAOSTAT data [2].
As to agricultural production value, a small but significantly positive relationship with PoU was found in East Asia, while negative impacts were identified in South and Southeast Asia. Agri-food prices and temperature change were not found to have significant impacts on food security in East Asia. Last but not least, the only highly significant dummy variable was found to be deaths in conflicts in South Asia.
With all these results, we can reject our first hypotheses as GDP were not found to be significantly and negatively related to prevalence of undernourishment, and population size just had a minor impact—it seems that relationship between economic size and food security does not hold for these regions. Our second hypothesis also needs to be rejected as clear signs between open economy and food security could not be found.
Our third hypothesis related to agricultural sector related determinants can just partly be rejected as not all variables showed the expected signs. Our fourth hypothesis should be definitely rejected as relationship between temperature and prevalence of undernourishment was found to be negative in nature. Our fifth hypothesis can also not be accepted due to lack of significant relationships among the dummy variables identified and food security.
In conclusion, our comprehensive study on the determinants of food security in South, Southeast, and East Asia over the period 2001–2021 provides both expected and unexpected insights into the complex interplay of economic, demographic, agricultural, and external factors influencing the prevalence of undernourishment (PoU). Consistent with existing literature, the positive relationship between population size and PoU, albeit with a less pronounced effect—due to such exceptional countries as China, Japan and Mongolia—than reported in some studies, reaffirms the demographic pressures on food security. Similarly, the significance of agricultural employment and the value of agricultural production in influencing PoU align with established theories positing agriculture as a critical determinant of food security, highlighting the crucial role of productive and remunerative agricultural sectors, and reflecting on the fact that in food secure developed countries—due to technologically developed agriculture and other social factors—agricultural employment rate is usually low, while in less developed countries the other way round.
Unexpectedly, however, our findings challenge several established assumptions. The relationship between GDP and PoU was anticipated to be negative, based on the presumption that larger economies would have better resources to ensure food security. Contrary to this expectation, our analysis indicates a positive relationship, suggesting that economic growth alone does not guarantee improved food security, a deviation from the literature that warrants further investigation.
The nuanced effects of open-economy variables, such as cereal import dependency ratio and foreign direct investment, on PoU also present an unexpected picture. The anticipated negative impact of high cereal import dependency on food security (i.e., positive on PoU) was not universally observed, challenging the notion that reliance on food imports is inherently detrimental to food security. Furthermore, the insignificance of foreign direct investment (FDI) in relation to PoU contradicts the optimistic view of FDI as a catalyst for improving food security through economic development and agricultural modernization.
Another intriguing aspect is the non-significant impact of temperature change on food security, which diverges from the expected negative outcomes of climate change on agricultural productivity and food availability. This finding suggests that other factors, possibly adaptive measures or economic development, may mitigate the impact of temperature changes in the studied regions.
Finally, the lack of significant relationships among the crisis-related dummy variables (except for the deaths in battle) and food security stands out as unexpected. This suggests that while geopolitical and social stability is crucial, its direct impact on food security may not be as straightforward as previously thought, indicating the need for a deeper understanding of the resilience mechanisms at play. However, we have to note here, that PoU is a quite radical food security indicator, measuring severe food insecurity. The insignificance of the crisis-related variables shows a direction for further research with a more nuanced food security indicator such as dietary diversity. However, dietary diversity data is very scarce in the selected region, therefore this future research request a different geographical scope.
In sum, our study reaffirms some established narratives on food security determinants while challenging others, offering new insights that enrich the discourse on food security in South, Southeast and East Asia. The unexpected findings, in particular, highlight the complexity of food security dynamics and the need for nuanced, region-specific approaches to understand and address the challenges of undernourishment.
All data generated from the study are available in the manuscript.
Attila Jambor and Boglarka Anna Elias designed the study, Elias collected and analyzed the data, Jambor ran the regression model, Elias and Jambor analysed the results. Both authors contributed to the writing of each chapter in the paper.
The authors declare that there is no conflict of interest.
1.
2.
3.
4.
5.
6.
7.
8.
9.
10.
11.
12.
13.
14.
15.
16.
17.
18.
19.
20.
21.
22.
23.
24.
25.
26.
27.
28.
29.
30.
31.
Jambor A, Elias BA. Determinants of Food Security: A Comprehensive Analysis Across East, South, and Southeast Asia. J Sustain Res. 2024;6(2):e240030. https://doi.org/10.20900/jsr20240030

Copyright © 2024 Hapres Co., Ltd. Privacy Policy | Terms and Conditions


