Location: Home >> Detail
J Sustain Res. 2025;7(2):e250026. https://doi.org/10.20900/jsr20250026
 ,
Ahm Shamsuzzoha 2,3,4,* ,
Mohammad Shamsuzzaman 5
,
Ahm Shamsuzzoha 2,3,4,* ,
Mohammad Shamsuzzaman 5
1 School of Technology and Innovations, University of Vaasa, Vaasa, FI-65101, Finland
2 Digital Economy Research Platform, School of Technology and Innovations, University of Vaasa, Vaasa, FI-65101, Finland
3 Department of Mechanical and Materials Engineering, University of Turku, Turku 20014, Finland
4 Faculty of Graduate Studies, Daffodil International University, Daffodil Smart City, Birulia 1216, Bangladesh
5 Department of Industrial Engineering and Engineering Management, College of Engineering, University of Sharjah, Sharjah, P.O. BOX 27272, United Arab Emirates
* Correspondence: Ahm Shamsuzzoha.
This study complements the productivity and sustainability research by focusing on digital work productivity from the perspective of knowledge work professionals in Finnish workplaces. Using a mixed method approach involving survey and case strategies, a questionnaire was sent to the members of the Union of Professional Engineers in Finland to collect data for quantitative and qualitative analysis. Over 300 responses produced a rich variety of information over the research area, which indicated that the use of IT in relation to work productivity in Finnish workplaces is perceived differently depending on the professional role, field of workplace, sector, size of workplace and domestic or foreign ownership of the organization. The results indicated that while the use of IT in work was widely acknowledged, its impact was unknown or seen as difficult to determine by many respondents, and the evaluation of the productivity impacts was often based on subjective experiences rather than tangible measurement. For improving knowledge work with the use of IT, the study provides suggestions including better alignment of remote and on-site work, increasing the inclusion of knowledge workers, and the development of tangible measurement methods for the follow-up of productivity of IT.
Digitalization of processes is often driven by the goal of improving work productivity, which is a major source of economic growth, employment and well-being. Besides incremental improvements, information technology (IT)-driven development results in the transformation of work which is becoming increasingly knowledge intensive. According to economic theories, work productivity is a major source of economic growth, employment and well-being, and work productivity can be improved by leveraging latest technology innovatively [1,2]. Based on previous research, it is noticed that the use of IT has improved work productivity with limited or mixed results, which contradicts the technology presumptions and experiences before the age of IT [3,4].
In the literature, there is also a strong connection between digital technology and social sustainability. Grybauskas et al. [5] presented the status of the literature, pointed out research trends in this field, and highlighted methodological and theoretical gaps that require attention. They determined the primary technological approaches, social sustainability domains affected, quantifiable impacts of digital technologies, and measurement techniques by thoroughly examining the body of existing literature. Serpa and Ferreira [6] studied those numerous societal aspects, including social interactions, financial markets, manufacturing organizations, and individuals, as well as science itself are being impacted by the growing use of digital technology. Economic development has been made possible by the gradual adoption of digital technology, rising production rates per employee, and the potential to create new or higher-quality products and services [7,8]. The productivity paradox has been recognized as persistent in national economies on macroeconomic level. On organizational and work unit levels, the impact of IT on productivity improvement can be continued as a new research direction [9]. Moreover, the issue also crosses the transformation of work, which is becoming increasingly knowledge intensive because of the introduction and use of IT. Consequently, knowledge work is expected to be a new source of work productivity, which involves leveraging IT as part of the process [10].
This paper focuses on how knowledge workers who use IT as part of their work perceive the work productivity, which in turn contributes to the research on digital work productivity and, consequently, on the issue of productivity paradox [11]. Digitalization continues to advance in all walks of life. In workplaces, IT has become an integral part of the processes, while also transforming work which is becoming increasingly knowledge intensive because of the process [12]. As a primary goal in many organizations, digitalization is driven by the strategic goal of improving work productivity which, in turn, in a wider perspective, is a major source of economic growth, employment and well-being. Despite investments in IT, productivity expectations have often been achieved with mixed results [13]. According to previous research, the potential causes of this productivity paradox relate to characteristics of IT, industry differences, mismeasurement and mismanagement, as well as country specifics, in particular [14].
Due to the complexity and the many factors involved, this issue continues to be researched. In most cases, the previous studies have recognized the existence of the productivity paradox from a macroeconomic perspective, while lacking focus on the levels where work productivity and use of IT among other productivity inputs take place: that is, in organizations and particularly in individual work units which contribute ultimately determine the total productivity output. Accordingly, the research objective was to study digital work productivity in Finnish workplace organizations by reflecting how the relation of IT and work productivity and sustainability are perceived by their members as knowledge work professionals. The backgrounds and experiences related to the use of IT in work differ, which in turn has an impact on work productivity, among others. Consequently, research questions (RQs) related to the research objective are as follows:
RQ 1: What impacts in the use of IT in Finnish workplaces have been identified by knowledge work professionals?
RQ 2: How is the relation between work productivity and the use of IT understood or perceived by knowledge work professionals?
RQ 3: What IT-related enablers and challenges can be identified as impacting directly or indirectly on work productivity in Finnish workplace organizations?
The answer to the first research question introduces perceptions on the impacts of IT in work, which facilitates understanding digitalization-related experiences in Finnish workplaces. The answer to the second question concerns the relation of work productivity and IT according to knowledge of work professionals. To answer the third and most central question, the resulting information is used in analyzing the potential causes of the productivity paradox in the Finnish workplaces. This paper examines the matter considering a study which was carried out involving Finnish knowledge work professionals who use IT in daily work. The survey feedback was analyzed by using quantitative and qualitative methods. The results indicated that while the use of IT in work was widely acknowledged, its impact was unknown or seen as difficult to determine by many respondents, and the evaluation of the productivity impacts was often based on subjective experiences rather than tangible measurement.
The paper is organized as follows: a brief literature review is presented in Section 2 (LITERATURE REVIEW). Section 3 (RESEARCH METHODOLOGY) introduces research methodology while Section 4 (RESULTS) presents the results. Section 5 (CONCLUSIONS) provides the study conclusions.
The investigation, which began in the late 1960s, covers the decades that followed the rise and rapid spread of ITs, especially in developed nations. According to research findings that investments in ITs have not produced the anticipated boost in productivity, the worker productivity paradox challenges the assumptions of earlier Industrial Revolutions regarding the significance of technological advancements in sustaining economic growth [15,16]. Prior to the productivity decrease that occurred in the early 1970s and continued into the 1980s, despite significant rises in definitive investment in research and development (R&D), advances in science, and advanced technologies, the principle of technology-driven improvement in productivity was unquestioned. This recommended the presence of a paradox [17]. The paradox appeared to be resolved when improvements in productivity surfaced in the 1990s and early 2000s, but this has since been disputed [18]. van Ark [19] asserts that despite falling IT prices, a shift from internal investments to external IT services, and an ongoing spike in knowledge resources to support IT, higher expenditure on ITs like mobile devices, the Internet, and cloud computing has not resulted in an apparent rise in productivity.
ITs of the current Fourth Industrial Revolution, like the Internet of Things, blockchain, and artificial intelligence (AI), appear to have fallen short of expectations for increased productivity thus far. Platforms like the Organisation for Economic Co-operation and Development (OECD) have acknowledged the low productivity of ITs [20]. “Why have the massive investments in IT not led to obvious increases in organizational productivity?” remains the central question [21]. It can be hard to measure productivity because it is tricky to evaluate either input or output, or both. Additionally, evaluations are susceptible to inaccuracies due to the absence of IT expenditure data [22]. Moreover, it has been proposed that the evolution of IT is occurring more quickly than earlier technological advances. As a result, it is difficult to identify quantity and quality. The rapid advancement of technology and the intangible qualities that make it difficult to quantify their value make it difficult to estimate the cost of IT inputs. The ability to integrate IT with other inputs to create highly valued outputs is a difficulty. This problem more broadly refers to the incapacity to execute business models and digitalization strategies [22].
Productivity Paradox in FinlandResearch have acknowledged the paradox in Finnish sectors, industries, and organizations. In Finland, IT’s are recognized as important producers of economic wealth and in maintaining well-being by improving productivity [23–27]. The private sector has been major contributor in productivity with its share of the Finnish gross domestic product (consisting of added value by products and services) being around 80% in comparison with 20% by the public sector [28] and with 56% of the employed people [29]. Also, the share of total research and development expenses by the private sector is around two-thirds [30]. Public sector productivity has been difficult to determine due to country-specific differences and indirect impacts on production, which makes the measurement and evaluation challenging [23,27,31].
Parviainen et al. [25] have approached IT-based productivity from the perspective of less work effort/input in production of public services and introduction of measurement methods in the public sector: the focus is on the acknowledged drop in productivity in public sector services, which existence has been reported by André and Chalaux [32], for instance. Due to better comparability and the sector importance, private sector perspective was selected to examine the productivity paradox in Finland based on existing research. Work productivity and total factor productivity in the private sector declined due to the financial crisis of 2008 and the collapse of Finnish electronics industry in the early 2010s, and the recovery has been slow [24,26,27,32].
Enablers in Digital Work Productivity and SustainabilityCompanies all over the world have been working on digital transformation for several years, but considering the COVID-19 pandemic, some of that work must be focused on reconsidering the conventional office setup. During the epidemic, the experience of working remotely led many to oppose the prevalent paradigm that necessitates being physically present in an office full-time. Nowadays, a lot of workers choose arrangements that allow for a personalized, real-time, mobile-enabled, and collaborative digitally driven work experience and cover all the information, technologies, tools, and procedures utilized in a workplace [33]. To improve digital work productivity and sustainability, several enablers contribute which can be summarized in Table 1.
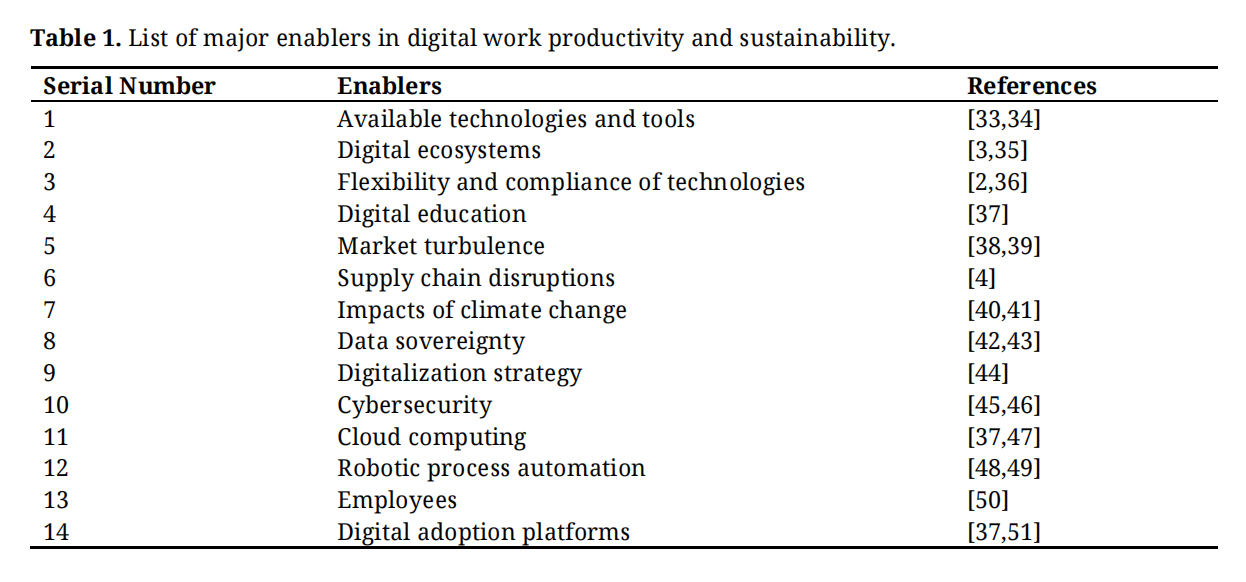 Table 1. List of major enablers in digital work productivity and sustainability.
With the advent of digital transformation, organizations now have access to a vast amount of information at an unparalleled rate of changes. However, knowledge workers who must cope with rapidly unpredictable, complicated, and unclear situations today face several challenges. Workflow collaboration technologies are being used more and more in this situation to handle this new style of working and boost knowledge worker efficiency. The most common challenges in digital work productivity and sustainability are summarized in Table 2.
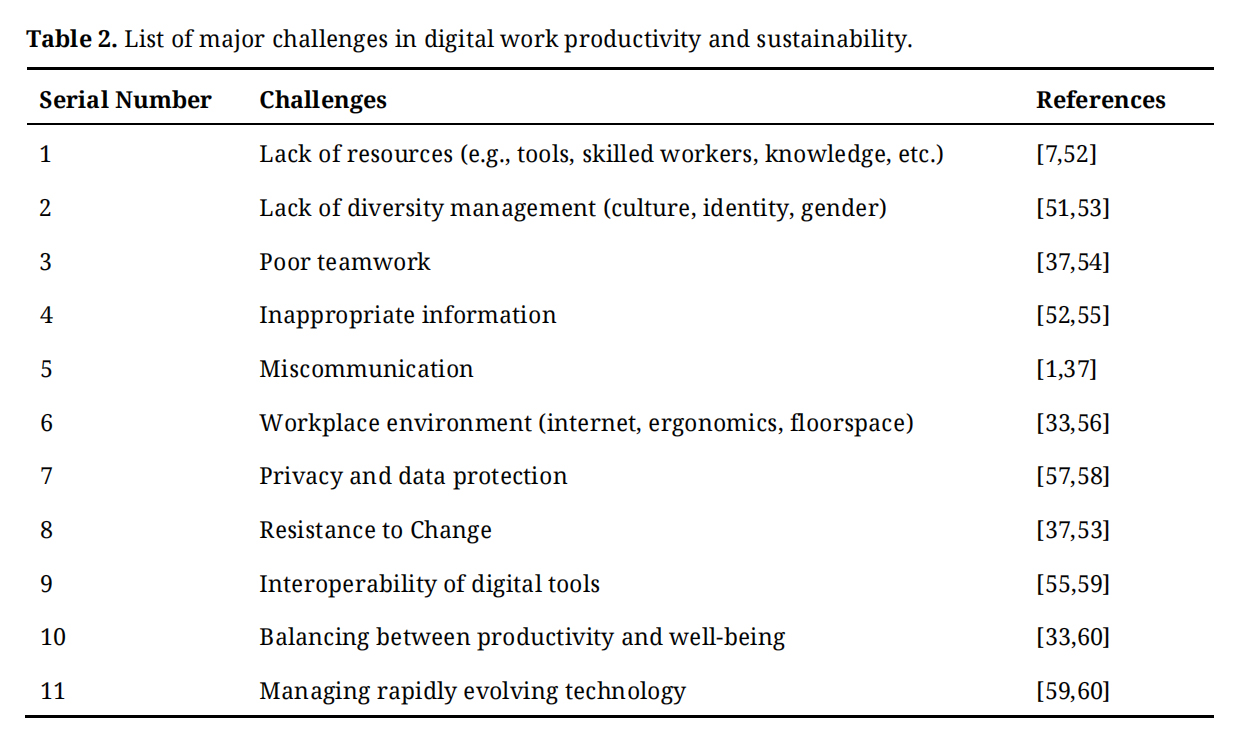 Table 2. List of major challenges in digital work productivity and sustainability.
To conduct this study, an applied methodology has been used in determining the impact of IT in work, which is increasingly becoming intangible, knowledge-based, and having a greater role as part of expectations in increasing work productivity. The research methodology choices to collect and analyze primary data for this purpose are introduced in this section. First, the selected case is presented with motivation. Thereafter, the research strategy and method of empirical study are defined, and primary data collection are introduced.
Research CaseThe case to be researched was selected because of discussions with representatives of the Union of Professional Engineers in Finland [61] during autumn 2022. The Insinöörilitto (IL) is a trade union which has 73,000 individual members including 58% engineer members, 10% IT members, 27% student members, and 5% other members. About 90% of the members of the Union work in the private sector. The main industries are technology, design, and IT. The IL has functioned for 100 years as a platform for professional activities and promoting the interests of engineers and other technical professionals [62]. Original proposal on the study topic related to selected areas of organizational management in Finnish organizations as perceived by the IL members. As result of the discussions with the IL management, the topic was refined to focus on the relation of productivity and digitalization in the organizations as perceived by the members in their workplaces as knowledge-work professionals, since this was determined by presenting an opportunity on introducing information on the issue of productivity paradox from unique perspective to complement previous research.
Research Strategy and MethodsDue to the research context and focus, a combined, mixed method research approach involving case and survey strategies was adopted. Case studies are useful in obtaining an in-depth, multi-faceted understanding by explaining, describing or exploring a contemporary and oft-complex issue, event or phenomenon in interaction with its real-life context to introduce rich empirical descriptions and development of theory. Identification of what is happening and why in a situation as well as grasping full implications of a case often involves acquiring both qualitative and quantitative data from different sources. Due to this, the value of case study research has been widely recognized in the fields of business, social sciences, and policy [63–65]. Like case study research, surveys are used to answer “what”, “who”, “where”, “how much” and “how many” questions, and they allow the collection of standardized data from number of respondents economically for easy comparison [65,66].
This combination of the two strategies is known as a case study survey, which as a research design is administered in the form of questions related to a case involving either a small sample or an entire population of individuals. Their responses to the questions are analyzed to describe population trends or to test questions or hypothesis considering identified opinions, behaviors, abilities, beliefs, or knowledge [66]. The mixed method approach was complemented by adoption of convergent design in context of questionnaire variant (also known as data-validation variant): that is, in addition to acquiring quantitative data, open-ended, qualitative questions were included to complement the research further, as resulting qualitative data in form of quotes provide emergent themes that can be used to validate and define the quantitative survey findings. Data collection in a mixed methods case study typically involves collecting both quantitative and qualitative data that helps to provide evidence for a case or cases or to generate a case or cases [67].
Primary Data CollectionIn line with the chosen research strategy, the questionnaire which was prepared and sent out to the IL members was structured with the following categories of consecutive questions:
●
●
●
●
●
●
The questionnaire was designed and implemented as an online questionnaire form by using Webropol 3.0. Before sending the questionnaire to the IL members, the form was reviewed in December 2021 and January 2022 together with the IL management as well by external test reviewers to validate grammar and concepts in the context, and it was incrementally refined until the final version was agreed to be sent to out. Once completed, the questionnaire was sent to the IL members last week of January 2022 with two weeks’ time for responding.
Over 300 responses to selection, multi-selection, open-ended, Likert scale selection, and numeric questions produced a rich variety of information over the research area, which was initially quantitatively analyzed involving absolute and relative shares based on the statistics as generated by Webropol 3.0. The follow-up quantitative analysis was done by using cross-tabulation with IBM SPSS statistics tool. The responses to open-ended questions are analyzed by conducting thematic analysis for establishing qualitative data insights. During the progress, both types of analysis were used in a complementary manner. As certain responses were distributed across several categories, detailed data granularity limited finding trends which might get manifested on other levels. Certain employment statuses and workplaces were represented more than others, and a smaller number of certain responses made comparison challenging. To facilitate analysis, the employment areas were recoded into two professional role categories, managerial role and specialist role. Also, current workplaces were recorded in private and public sectors.
Statistical Data AnalysisThe study results were analyzed using several statistical tools such as Microsoft Excel, and SPSS. The study outcomes are presented both in tabular and pictorial formats such as figures. The outcomes of each interview questions are presented in the form of response, number of respondents and percentages both in tables and figures. These representations clearly highlight the overall study outcomes and their impact on the study goals. Additionally, the results of the cross tabulated responses of the two questions in respect to the study aims are presented too.
In this section, selected findings from the questionnaires survey based on the analysis of the respondents’ answers are presented. The findings consist of the main insights of the data as introduced during this research study. The study results based on the primary data collection that was carried out with questionnaire survey are presented in this section.
Questionnaire Results Workplace background informationThe total number of responses received was 340 out of 500 questionnaires sent out and the response rate was 68%. Among the 340 responses, 330 respondents replied as currently employed, which was the core group of study focus of the survey. The largest age group reported was 36–50 years, followed by 51–60, 18–35, and 61 or older, respectively. Regarding gender, almost 80% were males, and around 19% were females. On education, over 63% reported Bachelor of Engineering degree, vocational degree (11.5%), university degree such as MSc or MBA (10.3%), other polytechnic degrees including higher AMK degree (9.4%), and upper secondary education degree (5.5%). Expert and middle management roles were reported by over 60% and 29% of the respondents, respectively.
Workplace background informationBased on the respondents, the field of current workplaces are presented in Table 3. From Table 3, it is seen that the respondents working in industrial operator-based workplace organizations are the largest group, while IT-based services or game industry and engineering, design, or consultancy agency are the second and third largest.
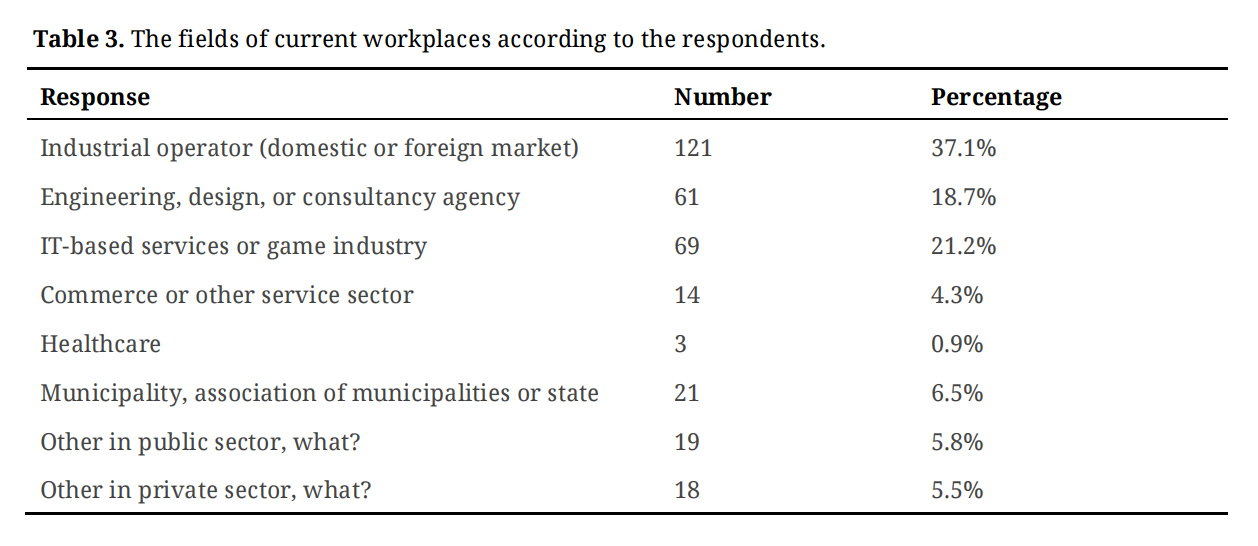 Table 3. The fields of current workplaces according to the respondents.
Figure 1 displays the results of the cross tabulated responses to the questions on ‘digitalization in organizational strategy and number of employees in workplaces’. From Figure 1, it indicates that organizations with greater number of personnel have more often digitalization defined as part of the strategy. The high amount of “I do not know” answers (over 1/4 across several size categories) suggests unawareness about the digitalization as part of strategy, the strategy itself, or both.
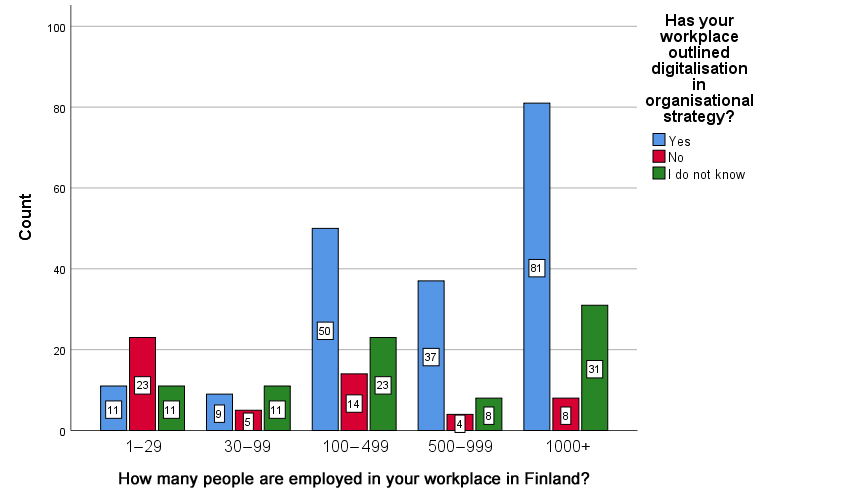 Figure 1. The results of the cross tabulated responses to the questions on ‘digitalization in organizational strategy and number of employees in workplaces’.
Furthermore, Figure 2 shows the current workplace responses (total of 325), which indicate that the fields where the “I do not know” answers amounted 25% or more were engineering/design/consultancy, healthcare, municipality/association of municipalities/government, and IT based services and game industry. The fields where “No” answers amounted 20% or more included commerce/other services, healthcare, and industrial operator. The “Yes” answers with rate of 57% or more included other in private and public sector, and IT based services and game industry. The high amount of the “I do not know” answers in respect to “Yes” and “No” answers in certain workplaces suggests that awareness about digitalization in the strategy may not exist widely among knowledge workers. Also, the “No” answers in particular indicate that digitalization may not be relevant in the fields which have not been traditionally IT-driven but more dependent on other inputs of production.
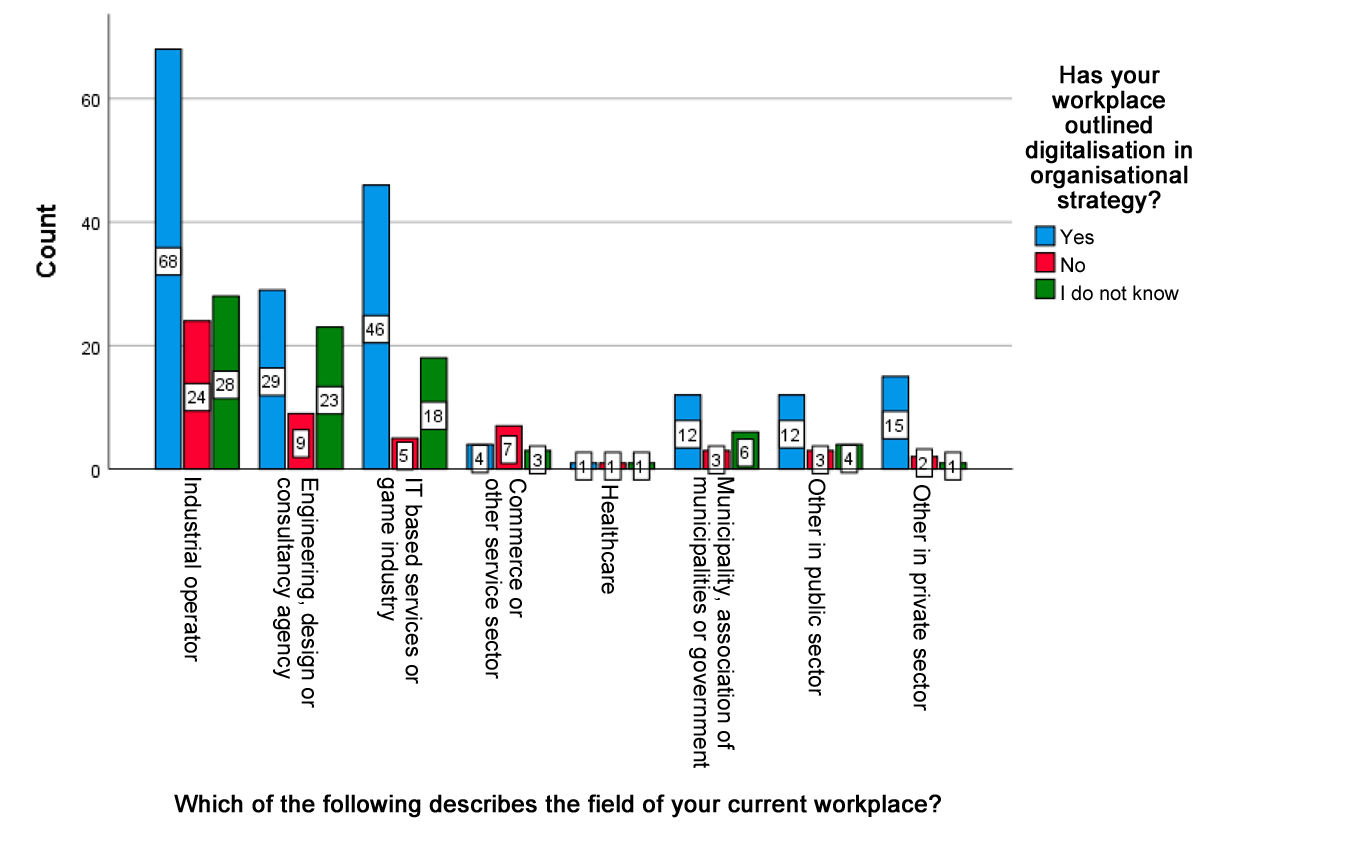 Figure 2. The results of the cross tabulated responses to the questions on digitalization in organizational strategy and fields of workplace.
Figure 3 highlights the distribution of the responses to question “Which form of IT is used or may be used in future in your workplace?”. From Figure 3 it is indicated that certain ITs were widely acknowledged across workplaces as used for 1 or more years. In case of social media, further crosstabulation with the fields of workplace demonstrated over 50% rate involving other in private sector (88.9%), industrial operator (78.6%), engineering (70.2%), commerce/other services (78.6%), IT based services or game industry (68.7%), municipality/association of municipalities/ government (95.0%) and other in public sector (89.5%), while healthcare totaled only 33.3%. These rates may be because social media can be adopted relatively easily and its wide adoption by people inside and outside of the organizations. In case of healthcare, use of online social media may be less relevant part of the work than being physically present on-site (an area which should be researched further due to the small absolute number of answers in this study). Similar adoption rates resulted in cloud computing, where most fields stood out between 78% and 95% of adoption for one or more years, with exception of healthcare (66%).
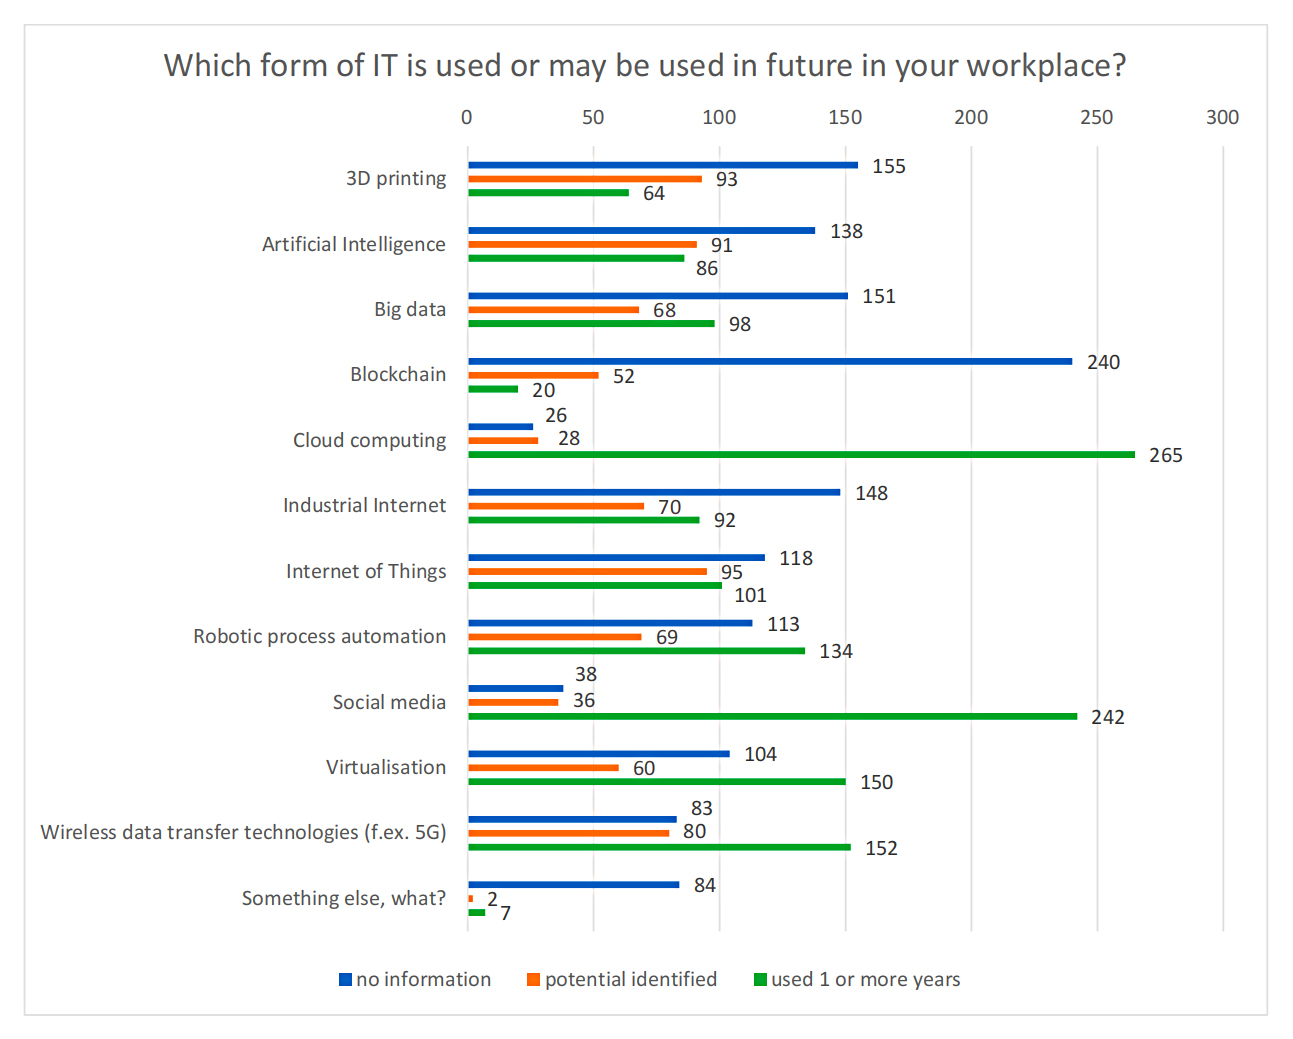 Figure 3. The distribution of the responses to question “Which form of IT is used or may be used in future in your workplace?”. Note: f.ex. 5G = for example 5G (fifth generation).
Figure 4 covers the results of the questions ‘What IT-related work methods are used or may be used in future in your workplace?” From Figure 4 it is noticed that lean, agile, human-machine interaction identifies more potential use of IT-related work methods which are used 1 or more years.
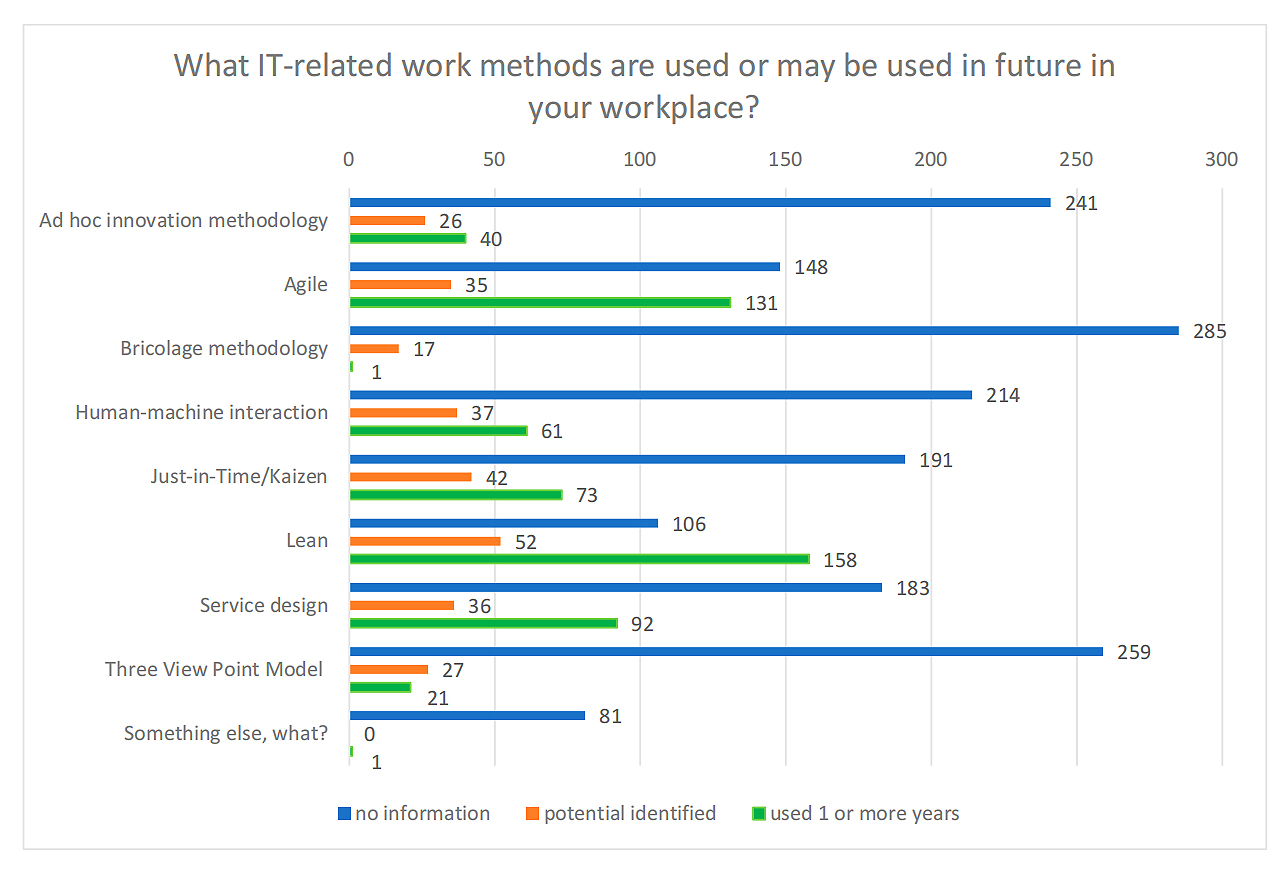 Figure 4. The distribution of the responses to question “What IT-related work methods are used or may be used in future in your workplace?”.
Figure 5 highlights the outcomes from the question ‘Due to introduction of IT and/or methods in my current workplace...’. From Figure 5 it shows that remote working is universally acknowledged as “completely true”. Using crosstabulation, over 65% answer rate was reported in most workplace fields except for the commerce/service sector (42.9%). This may relate to physical presence required in the workplace field, which cannot be substituted with online presence. On other options, the high number of responses on “to some extent true” reflect that the pros and cons have been recognized as impactful on personal work involving skill improvement, access to information, communication, and processual development, while also increasing workload or difficulties in work.
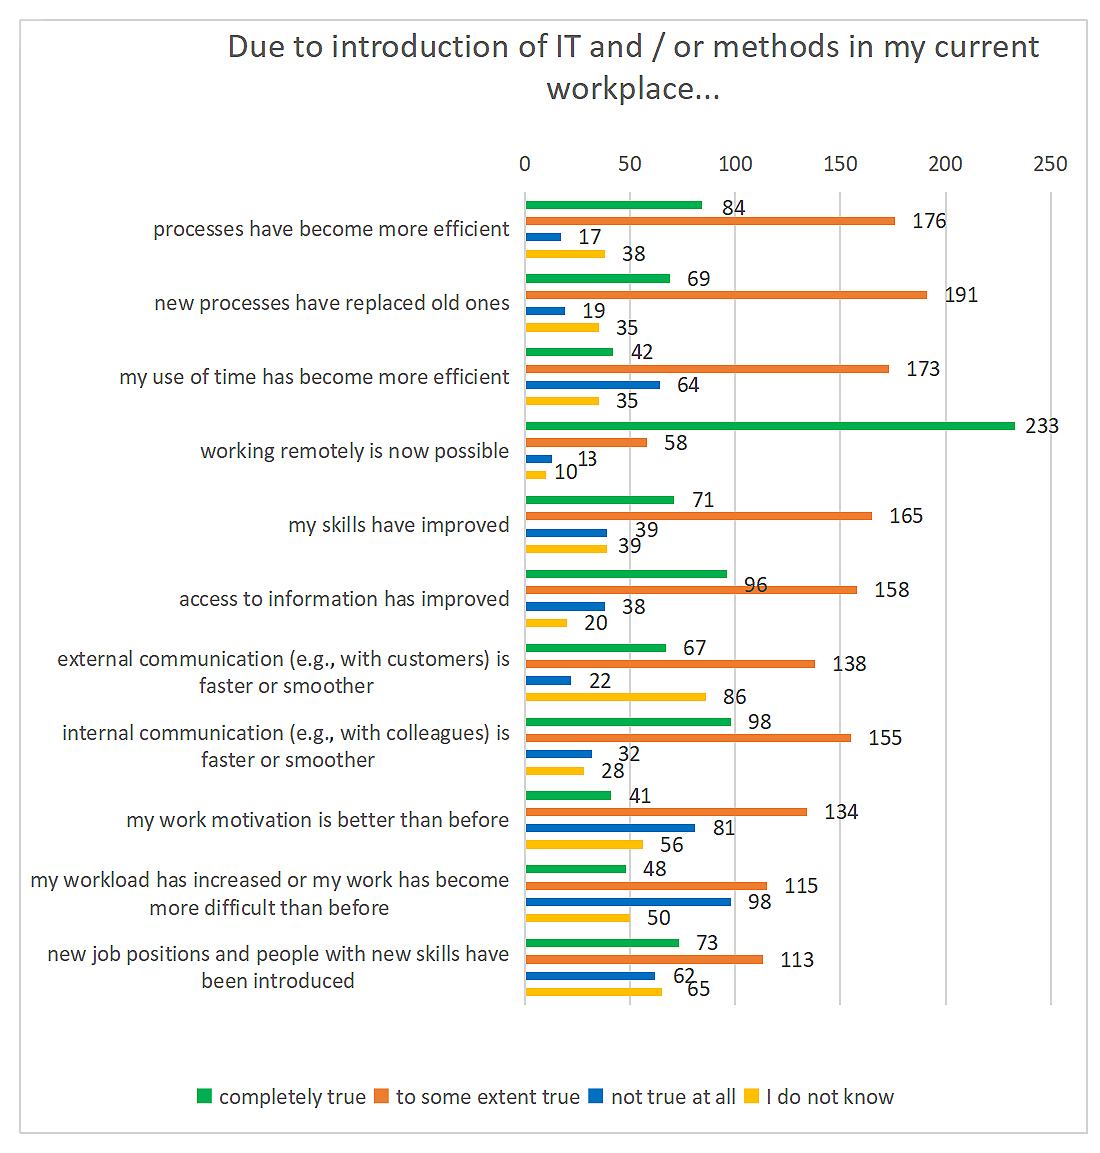 Figure 5. The distribution of the responses to proposition “Due to introduction of IT and/or methods in my current workplace”.
Regarding the question of “How do you develop your IT skills in your workplace?”, three answer options were inquired: training opportunities, learning through practice and/or in some other way. The total number of responses of 450 were distributed as shown in Table 4.
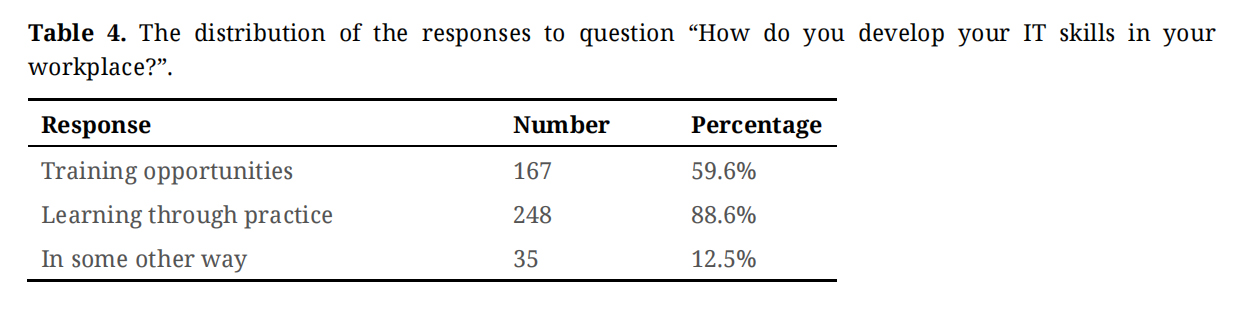 Table 4. The distribution of the responses to question “How do you develop your IT skills in your workplace?”.
The matter about areas where IT skills are needed or applied was asked on a proposition basis as shown in Figure 6 with the responses. In overall, a high degree of use of IT skills in workplaces can be seen with combined “completely true” and “to some extent true” answers, which suggests that IT skills are relevant in workplaces to carry out work tasks which can be determined as involving knowledge work (for instance, in searching information or communications). Also, similar response tendency can be seen on Figure 6 on core product/service development, innovation, and internal and external communications, with innovation option scoring the lowest for “completely true” answer after the open-ended “some other activity/activities” option. Regarding the open-ended option on some other activity/activities, the produced answers included in all or almost all tasks, financial management, and data/information management handling and analysis.
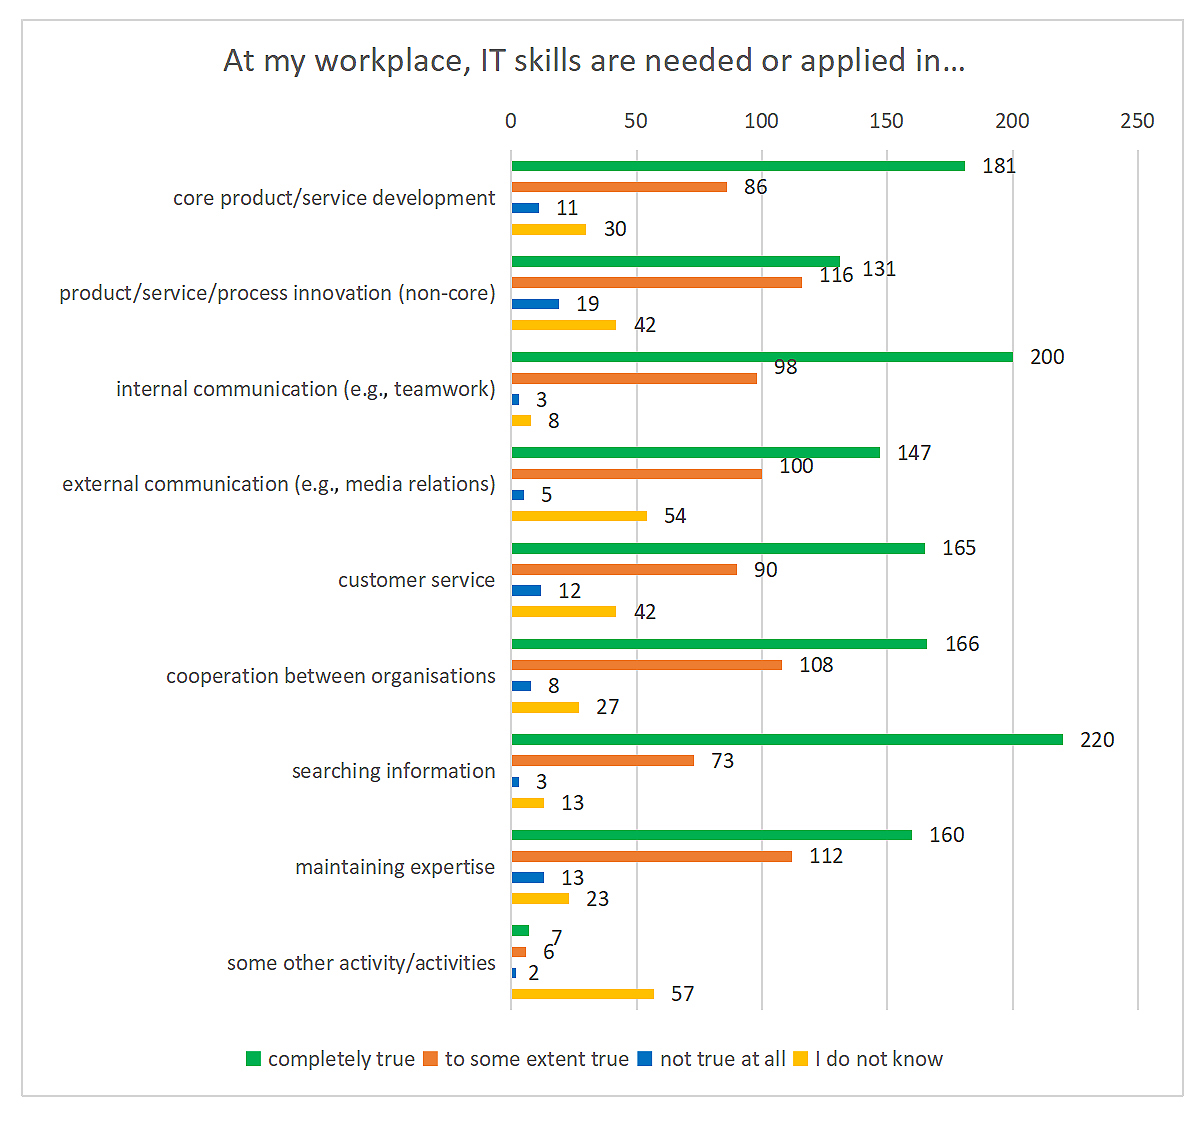 Figure 6. The distribution of the responses to proposition “At my workplace, IT skills are needed or applied in…”.
The impacts of COVID-19 in workplaces have varied across industries, with the major theme being the digitalization of work primarily to enable IT-based remote work. Accordingly, examining the matter was relevant to understand how the pandemic has shaped work according to the knowledge work professionals in Finnish workplaces. Figures 7 and 8 respectively displays the final part involving statement of “Use of IT during COVID-19 has and has not improved work productivity because...”, gained 125 open-ended input responses. Most of the answers (72) involved remote work in one form or another.
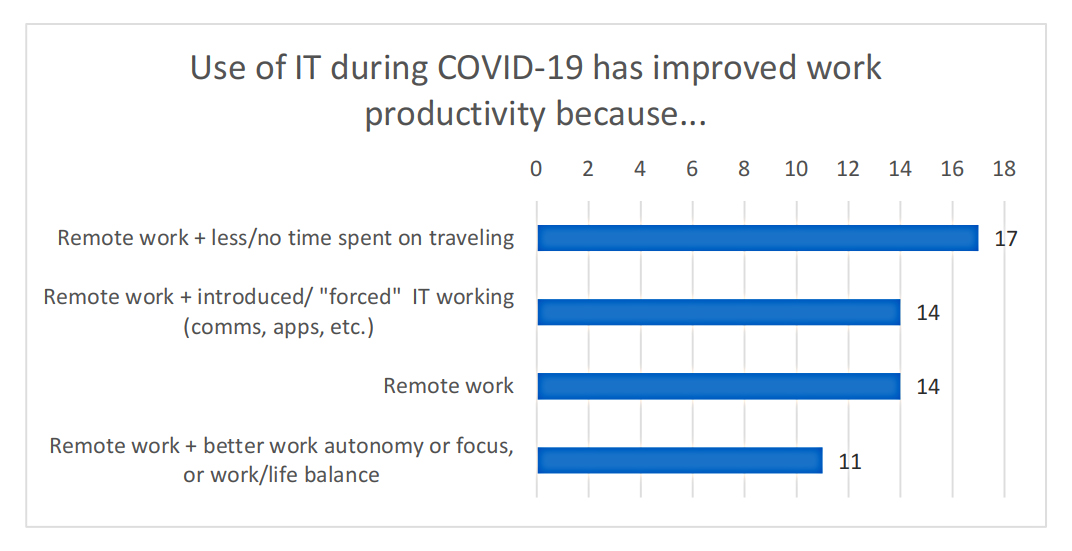 Figure 7. The distribution of the responses on the status of improved productivity by IT during the COVID-19 pandemic.
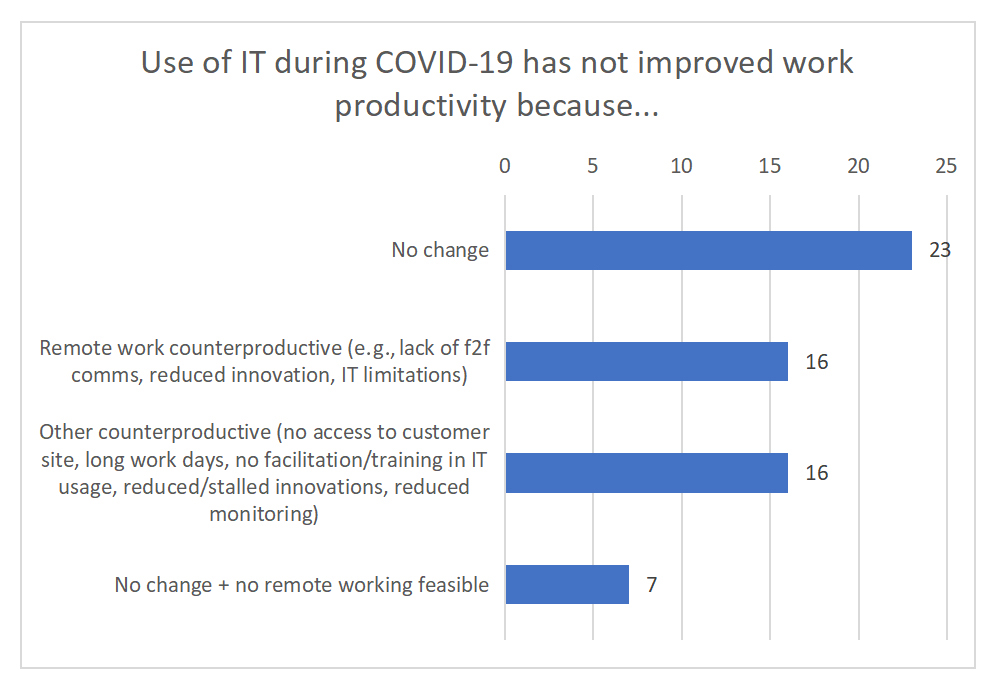 Figure 8. The distribution of the responses on the status of productivity improvement or not by IT during the COVID-19 pandemic. Note: f2f comms means face-to-face communications.
The final questions covered IT and work productivity in workplaces: performance-based monitoring of IT and methods, and the impact of IT and methods on work productivity and costs. The first question asked, “Does your workplace monitor performance (e.g., indicators) of IT and/or methods?”. Distribution of 310 responses is shown in Table 5. The question was to provide insights into how IT and methods are measured to ensure that their productivity (or lack of it), for instance, can be determined in a tangible manner.
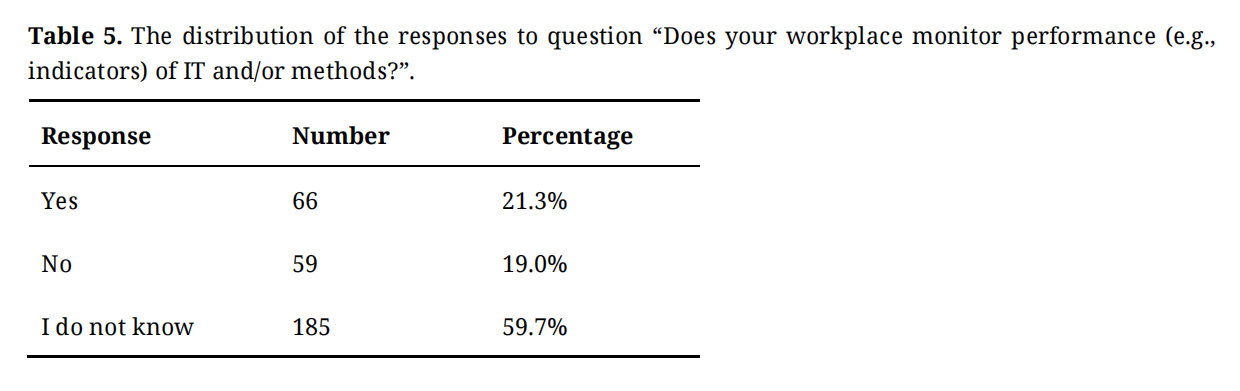 Table 5. The distribution of the responses to question “Does your workplace monitor performance (e.g., indicators) of IT and/or methods?”.
Based on Table 5, around 60% of the respondents do not know whether any performance monitoring of ITs and/or methods takes place in the workplaces. The “Yes” and “No” answers provided open-ended responses with major themes as follows as shown on Figure 9: 16 answers defined concrete areas such as process monitoring, application performance, standby rate, data correctness, servers, system functionality, and use of test automation in determining quality of continuous integration and solution delivery. Measures or methods used covered tools like Jira, human resource (HR) performances, quarterly reviews and yearly reports, key performance indicators (KPIs) and 24/7 dashboards. In case of “No” answers, most answers defined that need for the measurements has not been recognized, for instance, one respondent defined that “functions have been digitalized a long time ago, so self-evident use does not need to be measured”, and others defined that “monitoring has been jointly determined as useless” and “we do not measure anything anyway”.
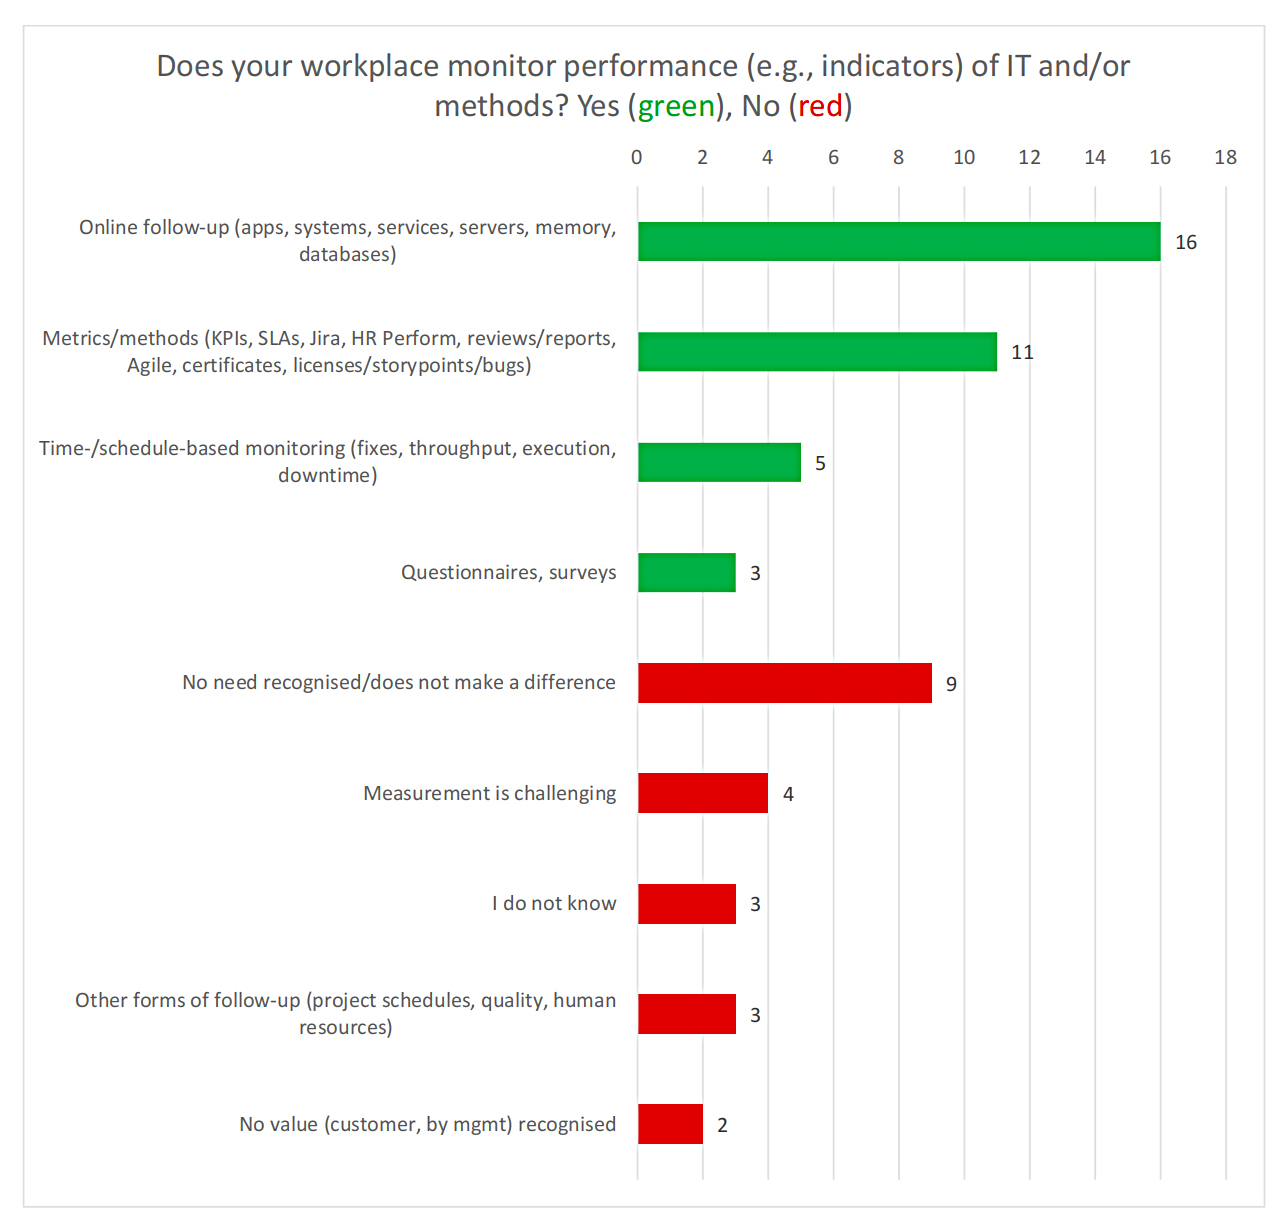 Figure 9. The distribution of “Yes” and “No” answers to the question of performance monitoring. Note: SLAs = service level agreements.
The next question “Has introduction of IT increased work productivity in your workplace?” produced 309 responses as distributed on Table 6.
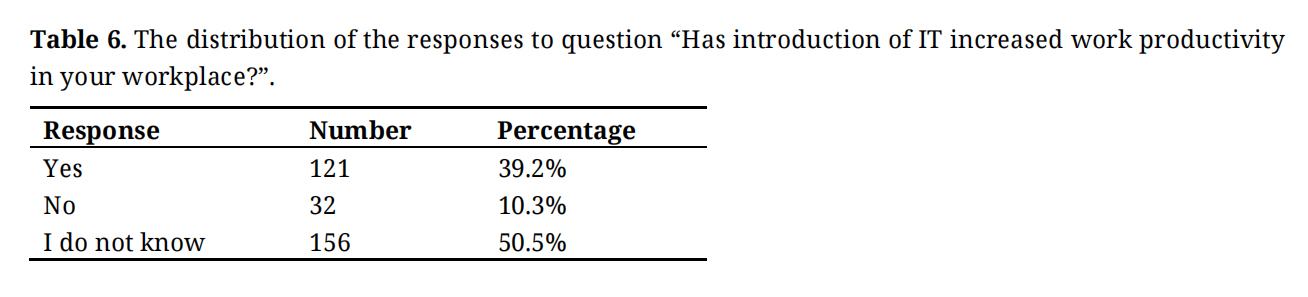 Table 6. The distribution of the responses to question “Has introduction of IT increased work productivity in your workplace?”.
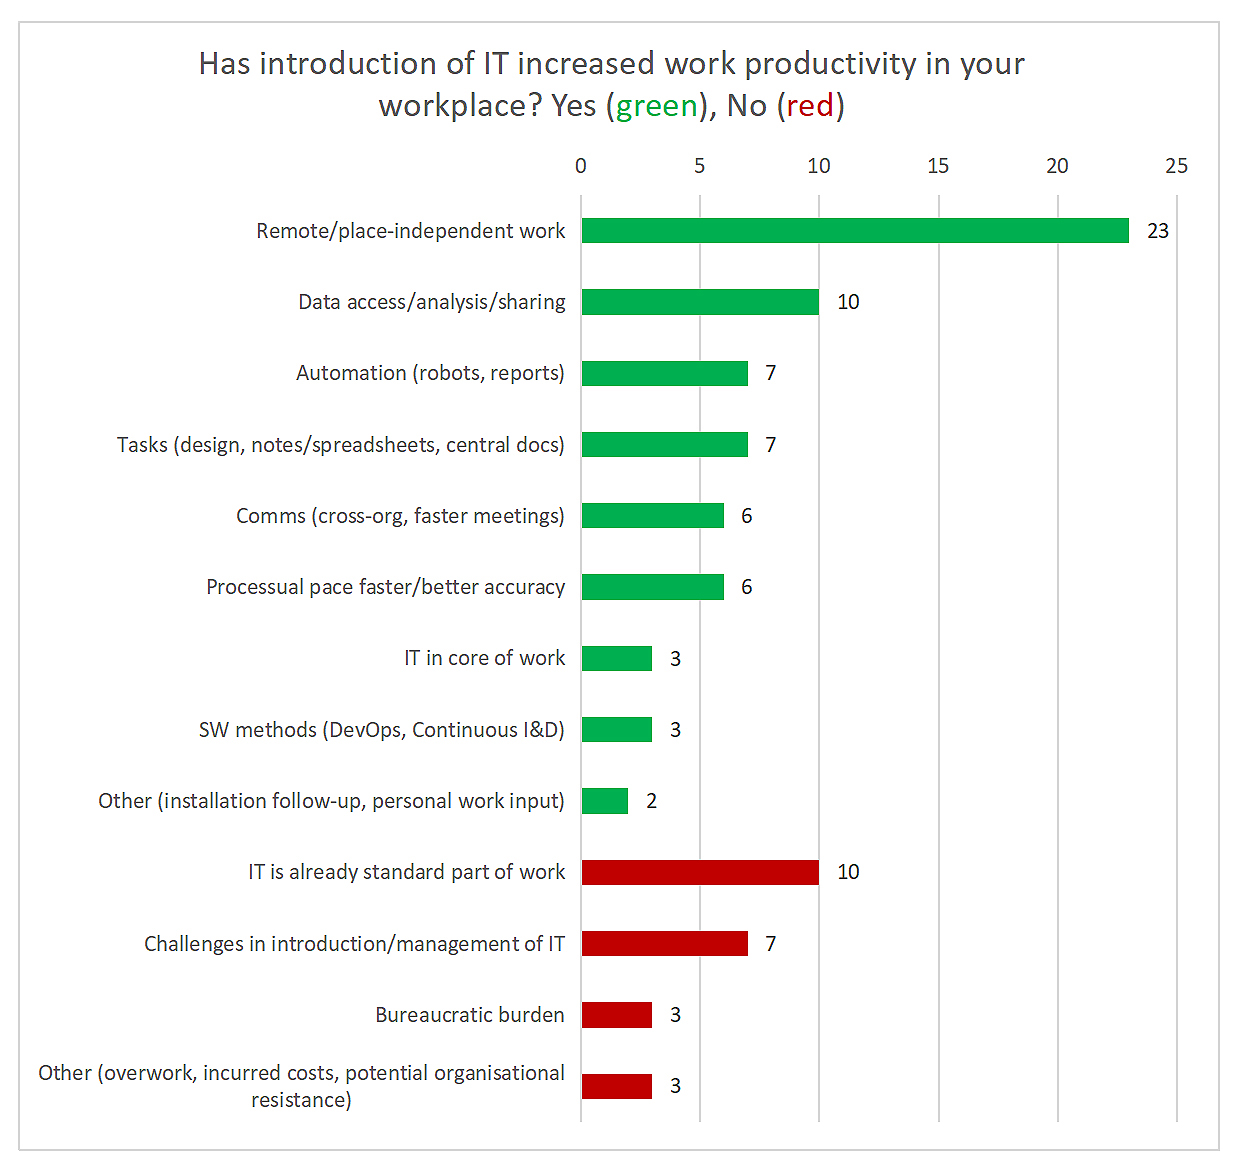 Figure 10. The distribution of “Yes” and “No” answers on the question of increased productivity by IT. Note: docs = documents, Comms = Communications, SW = software, DevOps = development and operations, I&D = inclusion and diversity.
The “Yes” and “No” answers (see Figure 10) provided following major themes of open-ended responses: In case of “Yes”, 23 respondents outlined remote or place-independent work due to less time spent on travelling and more work done at home during the time and reduced personnel costs. Data and information activities were defined including easier, faster and real-time data search and access, electronic data forms and more data-based analyses, as well as information sharing via cloud services. The respondents also commented that “IT is part of our industry and without it there is no productivity” and “IT has been used for over 30 years, which has certainly made working more efficient compared to doing everything using pen and paper”. For the “No” answers, 10 respondents defined the standard nature of IT with comments like “IT has not been introduced, it has been always in use” and “it has been part of business since founding”. 7 answers reflected IT-related challenges such as “slows down work”, “increasing number of systems is causing confusion”, and “feasibility of new technologies is not evaluated beforehand”. The question on “Has introduction of IT and/or methods increased costs in your workplace?” produced 309 responses which shares are shown on Table 7.
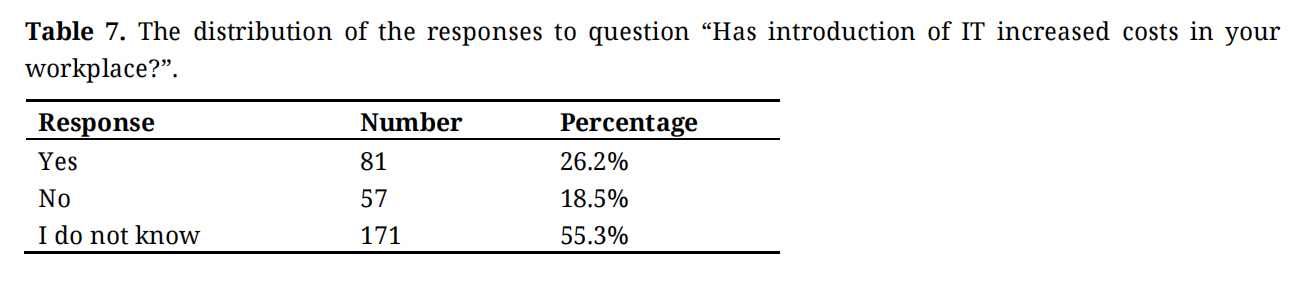 Table 7. The distribution of the responses to question “Has introduction of IT increased costs in your workplace?”.
The “Yes” answers included major themes for the open-ended responses (see Figure 11): IT investments (17 responses), licenses (16 responses), and hardware and system updates, for instance, in enabling remote work, network connectivity, and ensuring that hardware runs software (9 respondents).
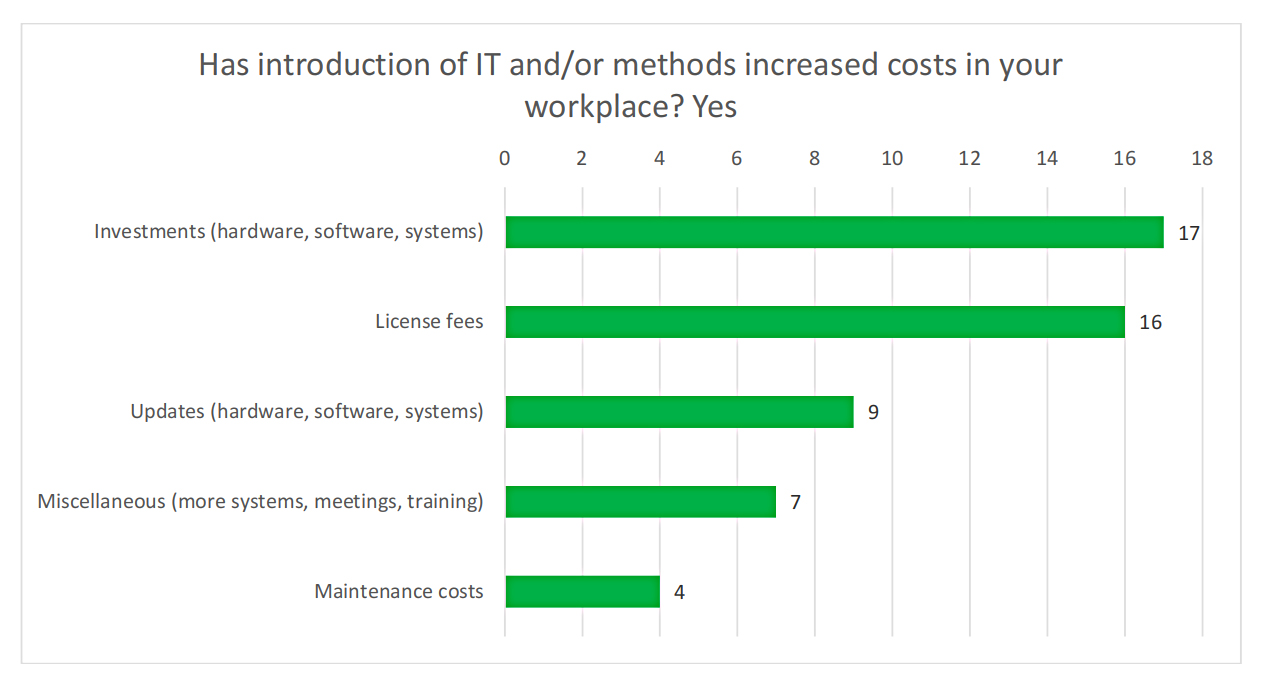 Figure 11. The distribution of “Yes” answers on the question of increased costs.
The final open-ended question of “What other factors have influenced development of your work productivity?” produced 48 answers which categorized themes are shown on Figure 12.
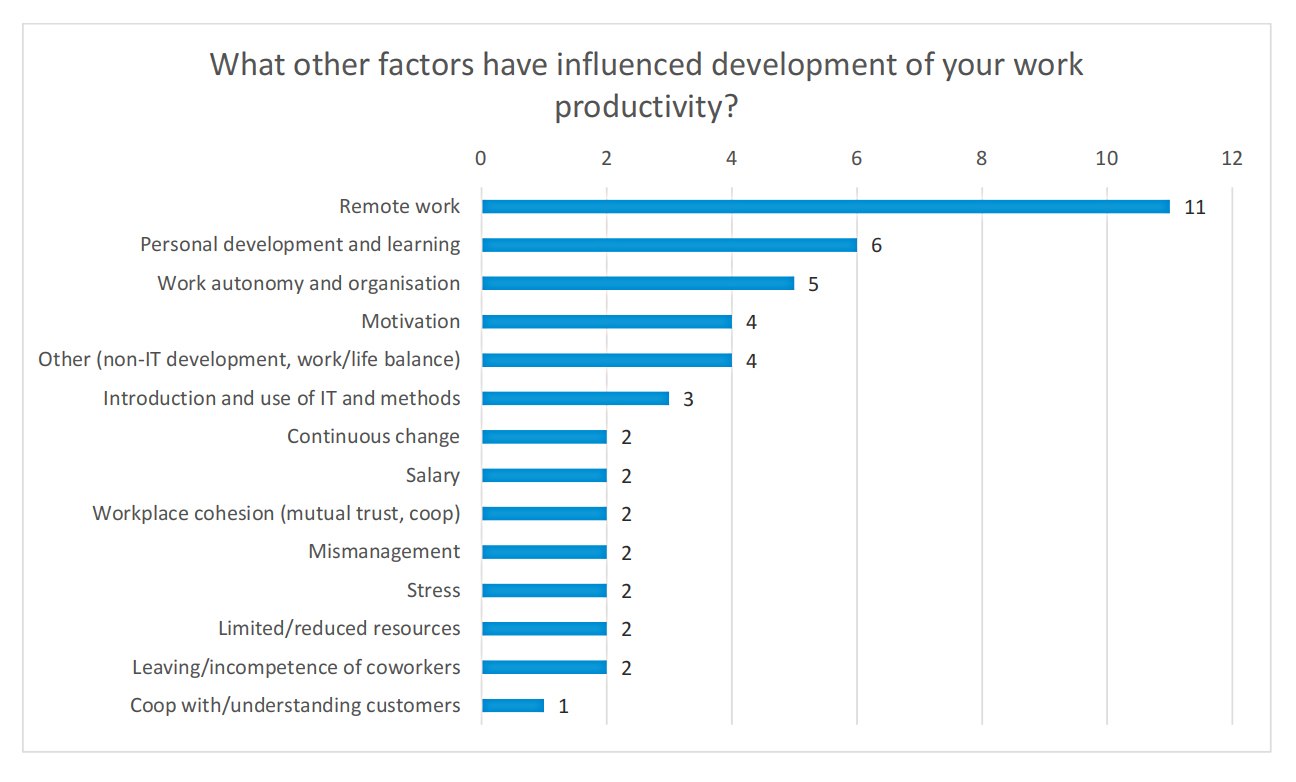 Figure 12. The distribution of the responses on other factors influencing development of work productivity.
The professional roles and workplace sectors were reflected in respect to the results of the two questions on increased productivity and performance monitoring of IT. As shown on Table 8, the managerial respondents recognized more often the impact of increased productivity (“Yes” answers under Total column) than the specialists who also reported over 50% of unawareness (“I do not know” answers under Total column), i.e., almost 10% more than the managers; also, the specialists reported the highest number of “I do not know” answers to the questions in relative and absolute numbers, underlining unawareness on the increased productivity and performance monitoring. Still, the rates of “Yes” answers to the two questions in both professional roles are relatively high in respect to the other answers options, which may suggest that awareness on the performance monitoring and increased productivity has a linkage, i.e., the follow-up of IT performance has been used in validating the increased productivity of IT.
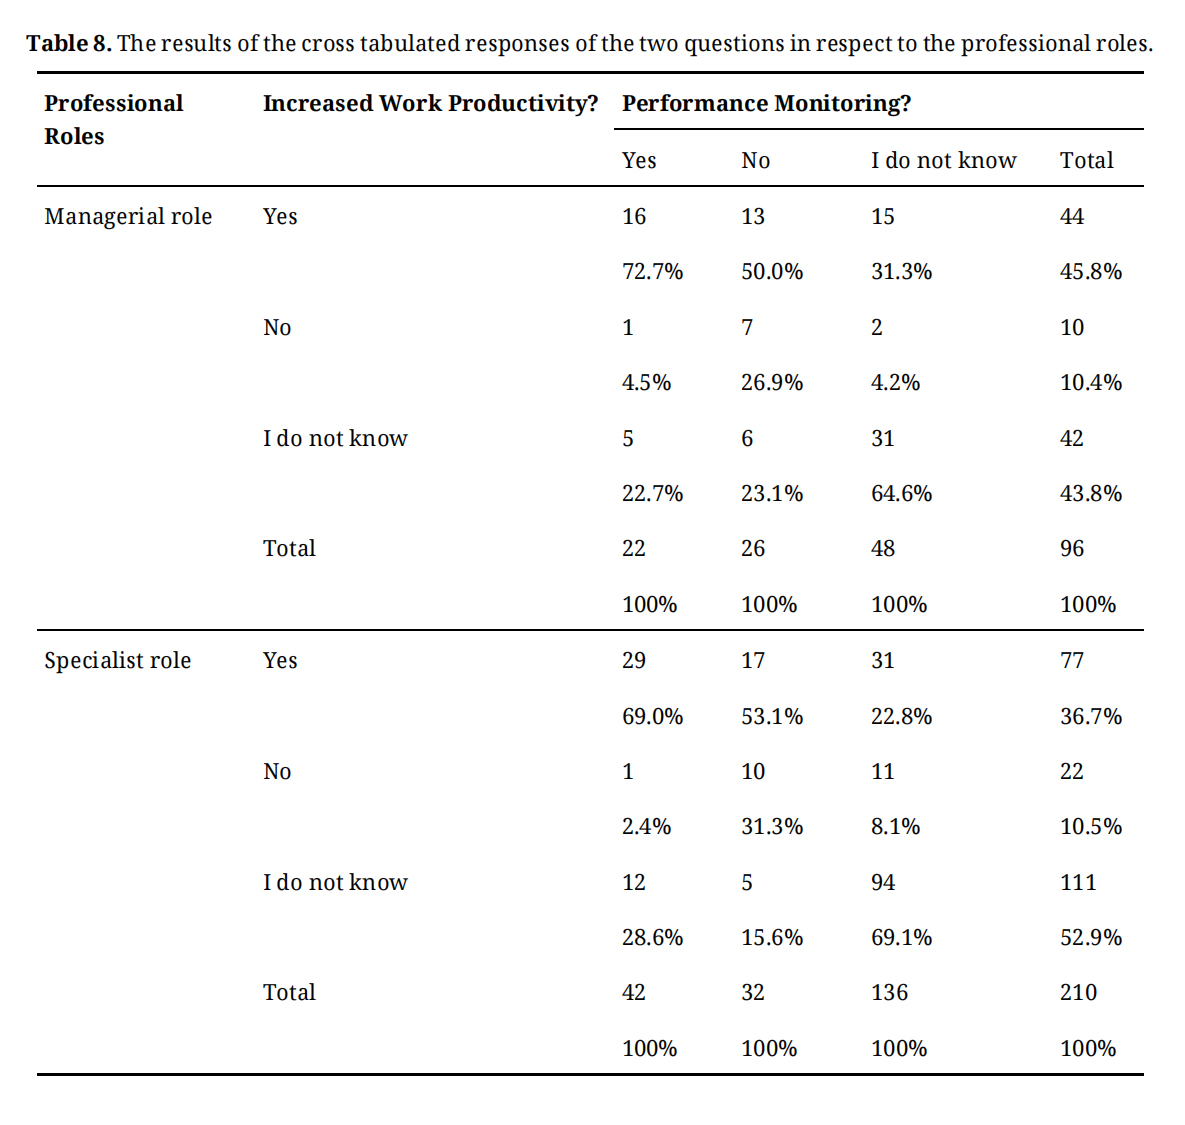 Table 8. The results of the cross tabulated responses of the two questions in respect to the professional roles.
Adding the workplace sector revealed further differences as shown on Table 9: for instance, awareness in managerial roles appears as opposite as the number of both “Yes” and “No” answers to the increased productivity by the public sector managers are lacking, which is underlined as the managers in the private sector recognized the increased productivity with 50.0% “Yes” answers under Total column. Also, the disparity is highlighted as the specialists in the public sector responded with “Yes” and “No” answers on increased productivity. Based on these findings, it seems that the managers in the private sector are mostly informed or aware about the increased productivity, also in respect to the specialists in both sectors, while managers in the public sector are not aware of productivity development or performance monitoring of IT in workplaces.
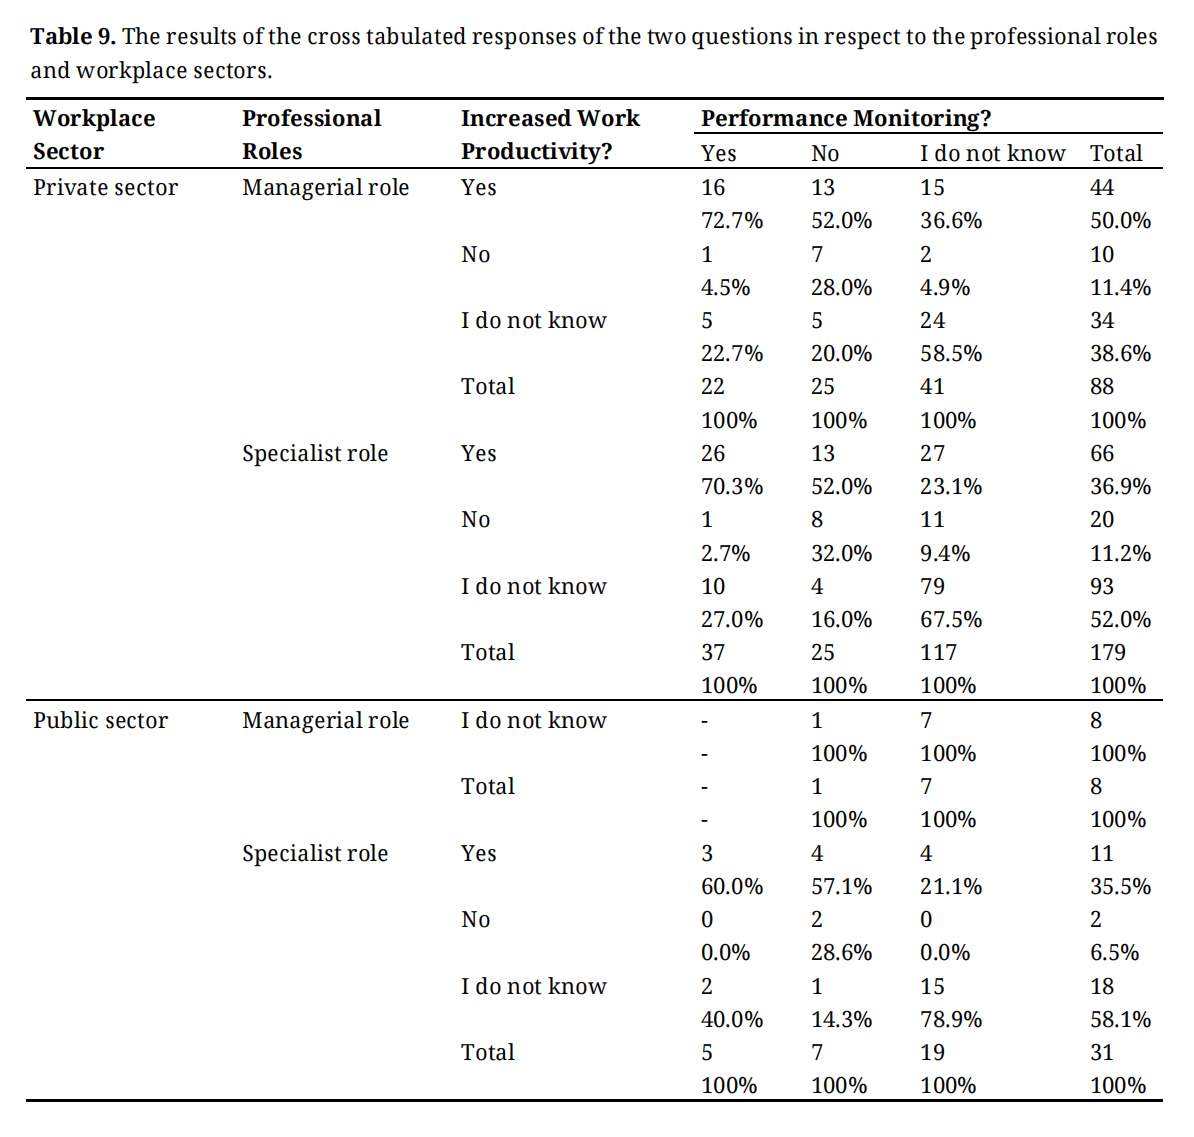 Table 9. The results of the cross tabulated responses of the two questions in respect to the professional roles and workplace sectors.
Given the employment and sector specific results over the increased work productivity and performance monitoring, further analysis was carried out on the increased IT costs by reflecting answers to the question of “Has introduction of IT increased costs in your workplace?” involving the defined categories. The results on Table 10 demonstrate differences in respect to the results of Table 9: most of the public sector managers (4) recognized (“Yes”) the incurred costs over other options (2, “No”; 2, “I do not know”). In relative terms, “Yes” answers were the highest single most result, as in other roles in both sectors the numbers of “I do not know” answer was the highest, followed by the numbers of “Yes” answers. It seems that the public sector managers focus on the cost side of IT only, while the private sector managers have awareness on both costs and increased work productivity (“Yes” answers), potentially involving use of methods such as cost and benefit ratio for the purpose.
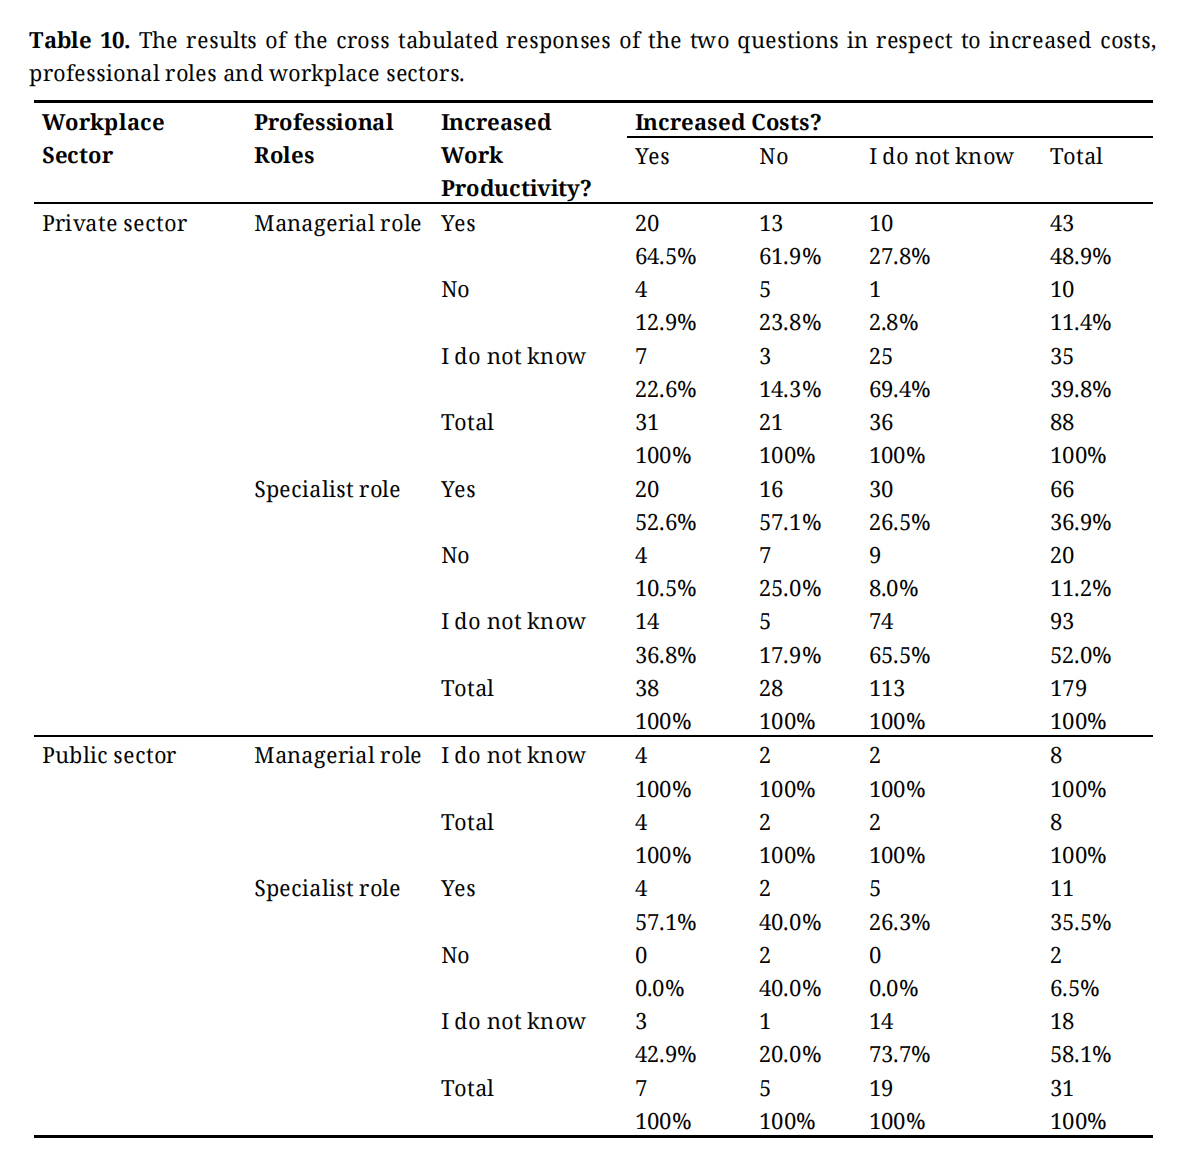 Table 10. The results of the cross tabulated responses of the two questions in respect to increased costs, professional roles and workplace sectors.
The contexts involving Finnish and foreign workplace organizations were reflected with the two questions to see whether the factors could introduce differences over the areas: (i) Is your workplace a foreign owned (over 50%) company? (ii) Has the introduction of IT increased work productivity in your workplace? (iii) Does your workplace monitor performance of IT and/or methods? Table 11 demonstrates following findings: first, foreign-owned companies which exercise performance monitoring (“Yes”) acknowledged also increased productivity (“Yes”) over the other responses (“No”, “I do not know”). The distinction between foreign-owned and non-foreign owned companies/organizations is interesting: first, the foreign-owned companies with the “Yes” answers on performance monitoring show up with zero “No” answers on increased productivity.
While “No” answers on increased productivity in other options of performance monitoring are not high either, the total of zero “No” answers in comparison with the “Yes” answers raise interest on the influencing specifics. While the similar distribution of answers can be seen across non-foreign companies/organizations which conduct performance monitoring (“Yes”), the numbers of “No” answers on performance monitoring are relatively higher. of the two company categories. The results suggest that foreign-owned companies may have a more coherent approach on determining IT-based productivity and involving performance monitoring as an integral part of the follow-up, analysis, and consequent development and other actions taken as required based on the acquired data.
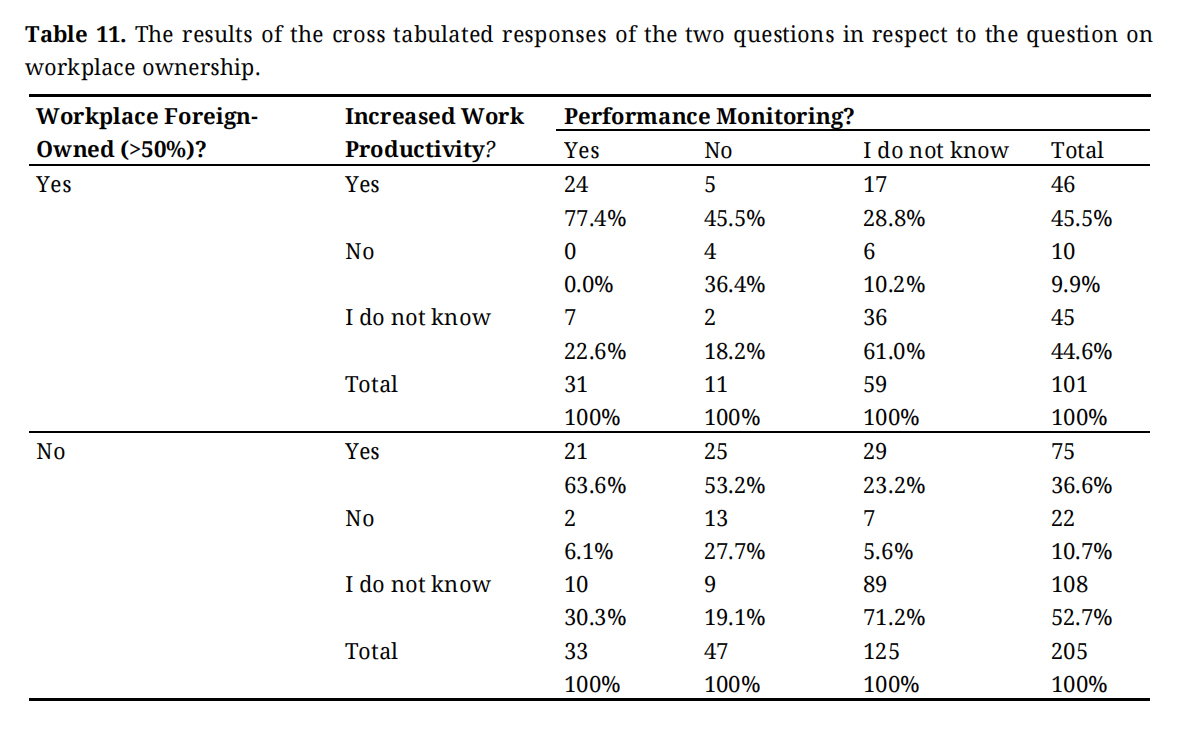 Table 11. The results of the cross tabulated responses of the two questions in respect to the question on workplace ownership.
The results indicated that the use of IT in relation to work productivity in Finnish workplaces is perceived differently depending on the professional role (managerial or specialist), the field of workplace, the sector (private or public), the size of workplace organization (the number of employees), and domestic or foreign ownership of the organization. The results suggest that digitalization propagates transformational effects which, depending on the implementation in organizations, may improve work productivity or inhibit its materialization. The study results can be compared to past works. For instance, Okkonen et al. [50] studied knowledge worker in the fields of medicine, education, law, and the church and not in the field of engineering and identified accompanying enablers and restraints. Mirbabaie et al. [68] studied how artificial intelligence (AI) helps workers with work-related tasks and to promote collaboration in human-machine teams. Cijan et al. [69] examined the impact of digitalization on the workplace that has been transforming organizations. Nowadays, individuals find it impossible to envisage their personal or professional lives without digital tools. Previous research looked at how digitization affected employee productivity and company performance [70–72].
The focus of this study was the productivity of IT in Finnish workplace organizations as perceived by knowledge work professionals considering identified enablers and challenges. The research was started with review of international and Finnish research on productivity paradox, introduction of knowledge work in respect to work productivity and increased use of IT in the work. Besides differences and aligned themes found from the results, the follow-up analyses indicated that the relation of IT used in work and work productivity in Finnish workplaces is understood and perceived differently depending on the professional role (managerial or specialist), field of workplace, the sector (private or public), and domestic or foreign ownership of the workplace organization.
Impacts of IT in Finnish Workplaces According to Knowledge Work ProfessionalsRegarding the first research question of “What impacts in the use of IT in Finnish workplace organizations have taken place or been identified according to knowledge of work professionals?”, there found several findings. Based on experiences by the respondents on tangible work task level, certain answers indicated that it propagates transformational effects and trade-offs, which depending on implementation in workplace may improve some forms or foundational preconditions of work productivity, while also potentially inhibiting materialization of others for the improvement. The quantitative results indicated that in most workplaces Its are perceived as impactful in facilitating standardized work processes such as communications, development of core products, services, and processes, and financial management in particular, and the respondents with insights on the aims of digitalization as part of organizational strategy acknowledged the importance in improving productivity, reaching out new markets and/or customer segments, and staying in competition in particular.
Relation of Work Productivity and Use of IT According to Knowledge Work ProfessionalsRegarding the second research question of “How is the relation of work productivity and use of IT understood or perceived by knowledge work professionals?”, the answers indicated high level of unawareness on the relation among the respondents combined with large number of subjective perceptions of the matter. As a first indicator, initial analysis of organizational background revealed that while digitalization as part of organizational strategy was recognized by majority of the respondents (“Yes”: 57.8%), a significant amount of them were not aware of the matter (“I do not know”: 25.7%) with the fields rating 25% or more including engineering/design/consultancy, healthcare, municipality/association of municipalities/government, and IT based services and game industry. The fields where “No” answers rated 20% or more included commerce/other services, healthcare, and industrial operator. Combining the previous answers suggests unawareness of or lack of digitalization in the strategy particularly in workplaces which are not traditionally intensive or primarily dependent on IT. The “Yes” answers with rate of 57% or more included fields of other in private and public sector (particularly involving educational institutions), and IT based services and game industry. The results suggest that the use of IT as part of personal work in respect to strategy-level goals in workplace organizations are not recognized as aligned by all respondents.
Impact of IT-Related Enablers and Challenges in Workplaces on Work Productivity in Respect to Productivity ParadoxRegarding the final research question of “What IT-related enablers and challenges can be identified as impacting in workplace organizations (of knowledge work professionals) directly or indirectly on work productivity, which could potentially elaborate the causes behind of the phenomenon of productivity paradox?”, the answers reveal about impacts in form of experiences in use of IT, lacking tangible productivity performance monitoring means, and the workplace differences as potential causes of the issue. In respect to the previously researched potential causes of the productivity paradox, the responses by the knowledge work professionals provided direct and indirect confirmations as well as further information about the origins as part of the cause. The lack of skills development and training can be considered as part of the broader issue of the mismanagement of IT in the workplaces, which is another potential cause of the productivity paradox identified by previous research. The responses also described inadequate evaluation of the new IT systems, lack of effective management of an increasing number of the systems, and low involvement of members of workplace organizations (particularly in specialist roles) in IT selection and trial processes. The mismanagement was manifested in the form of related challenges in the use of IT in work, that included increased work and learning efforts, end-user frustration and consequent lower motivation in work, which in turn have had an effect of reducing work productivity.
Study LimitationsThis study has several limitations which are worth mentioning. Firstly, this study only considers the Finnish engineers in the empirical survey and analysis because engineers are mainly engaged directly in the digital-work productivity. However, this study outcomes would have been better if the study considers other stakeholders associated to work-productivity such as technicians, blue collar workers, admin personnel etc., which can be considered as a future scope of this study. Secondly, the study analysis is done on cross-tabulations which can give better value with more advanced methods which can be considered as a future scope of this study. Thirdly, this study did not use any statistical tests which can be considered in the further research. Fourthly, this study relies on self-reported data, which may introduce bias and can limit the generalizability of the study outcomes. Fifthly, this study did not consider potential workplace differences (e.g., company culture, IT investment) that may affect generalizability. Finally, this study outcome could have been even better if cross-sectional analysis was done, which could be augmented with inferential statistics (e.g., chi-square tests) to determine whether relationships between variables are statistically significant.
The dataset from the study is not available because of confidentiality.
Conceptualization, RR, AS; Methodology, RR, AS; Software, RR, AS; Validation, RR, AS and MS; Formal Analysis, RR, AS; Investigation, RR, AS, and MS; Resources, RR, AS; Data Curation, RR, AS; Writing—Original Draft Preparation, RR, AS; Writing—Review & Editing, MS; Visualization, AS, MS; Supervision, AS; Project Administration, AS; Funding Acquisition, AS.
The authors declare that they have no conflicts of interest.
1.
2.
3.
4.
5.
6.
7.
8.
9.
10.
11.
12.
13.
14.
15.
16.
17.
18.
19.
20.
21.
22.
23.
24.
25.
26.
27.
28.
29.
30.
31.
32.
33.
34.
35.
36.
37.
38.
39.
40.
41.
42.
43.
44.
45.
46.
47.
48.
49.
50.
51.
52.
53.
54.
55.
56.
57.
58.
59.
60.
61.
62.
63.
64.
65.
66.
67.
68.
69.
70.
71.
72.
Rinnekangas R, Shamsuzzoha A, Shamsuzzaman M. Enablers and Challenges in Digital Work Productivity and Sustainability: A Study in Finnish Organizations. J Sustain Res. 2025;7(2):e250026. https://doi.org/10.20900/jsr20250026

Copyright © Hapres Co., Ltd. Privacy Policy | Terms and Conditions


