Location: Home >> Detail
J Sustain Res. 2025;7(3):e250053. https://doi.org/10.20900/jsr20250053
 ,
Rui Alexandre Castanho 2,3,* ,
Paulo Ferreira 2
,
Rui Alexandre Castanho 2,3,* ,
Paulo Ferreira 2
1 Department of Geomatics and Spatial Information Engineering, College of Engineering, University of Tehran, Tehran 14174-66191, Iran
2 VALORIZA—Research Centre for Endogenous Resource Valorization, Portalegre Polytechnic University, Portalegre 7300-110, Portugal
3 Advanced Research Centre, European University of Lefke, Lefke 99010, Northern Cyprus, TR-10 Mersin, Turkey
* Correspondence: Rui Alexandre Castanho.
Urban development in European cross-border regions significantly influences LULC changes, affecting environmental sustainability and regional planning. This study focuses on the France–Monaco borderlands, including the cities of Nice and Monaco, to analyze these dynamics between 2000 and 2018. Using the CLC dataset and GIS tools, we conducted a spatiotemporal analysis of LULC changes. Post-classification change detection and the AUEII were applied to quantify urban expansion and land conversion patterns. The built-up area in the study region expanded by approximately 28 km² over 18 years, with an average annual increase of more than 1.5 km². At the same time, natural and semi-natural areas, including forests and agricultural land, declined by approximately 11 km², reflecting a significant transformation of the landscape. Urban expansion accelerated notably after 2012, especially along major transportation corridors and coastal zones. Wetlands and water bodies remained relatively stable during this period. Rapid urbanization in the Nice–Monaco cross-border territory has led to substantial LULC changes, with implications for environmental sustainability and regional development. These findings underscore the need for integrated land management strategies that balance urban growth with conservation efforts, particularly in ecologically sensitive areas that span multiple borders. Coordinated policy and planning initiatives are crucial for mitigating environmental impacts while supporting socioeconomic development.
LULC, Land use and land cover; CLC, CORINE Land Cover; CORINE, Coordination of Information on the Environment; EU, European Union; GIS, Geographic Information System; GDP, Gross Domestic Product; EEA, European Environment Agency; MMU, Minimum Mapping Unit; CAP, Common Agricultural Policy; UHI, Urban heat islands; AUEII, Annual Urban Expansion Intensity Index; CLMS, Copernicus Land Monitoring Service.
Changes in LULC significantly impact global environmental processes, including carbon cycles and biodiversity. It is a major driver of climate change, influencing ecosystem functions and contributing to soil erosion and alterations in ecological and hydrological cycles. The interaction between human activity and LULC changes exacerbates these environmental challenges [1]. Over the last decades, LULC changes have resulted in significant global trends, notably a marked loss of natural areas and a substantial expansion of built-up areas. The literature further emphasizes the implications of these changes for biodiversity and sustainability, indicating that agricultural land occupies a major proportion of the Earth’s surface [2].
Changes in LULC have primarily been marked by a reduction in rural land extent and a significant increase in urban land due to urbanization. This trend has considerable implications for natural environments and sustainable development [3]. This rapid urbanization highlights a significant demographic shift toward city living. Increasing urbanization is leading to significant changes in LULC patterns, primarily driven by population growth and economic development. These changes have adverse effects on ecosystems, leading to biodiversity loss, watershed pollution, and increased impacts of climate change. Consequently, urban areas become increasingly vulnerable, facing challenges in maintaining ecosystem structure and function [4].
Cross-border territories are characterized by several fragmented features that arise from the presence of transnational borders. These territories encompass multiple local or regional authorities that are geographically close but administratively distinct, resulting in various disparities in demographic and socioeconomic characteristics. Moreover, the regulations in these areas may create price volatility and a shift from clear to bilateral risk management in trading practices. These regions often experience development gaps due to structural issues that hinder collaboration between neighboring states. Additionally, integrating diverse governance systems and addressing the differing needs of communities can complicate urban planning and development efforts [5]. The borderlands between France and Monaco have historically been a small region of dispute, with complex territorial dynamics. This area is characterized by a varied topography that includes mountainous relief and coastal regions [6].
Regional development in the France–Monaco borderlands has been shaped by a combination of high population density, tourism, and environmental concerns [7]. Notably, Monaco’s regional planning seeks to optimize space due to its limited land area, leading to innovative approaches such as vertical construction and efficient public transportation systems [8]. Based on the literature, regional development conflicts in these borderlands typically stem from issues of sovereignty, land use, and economic policy. Both regions have distinct governmental structures, with Monaco seeking to enhance its sovereignty while maintaining proximity to France. Tensions often arise from differing priorities in infrastructure development and environmental conservation, affecting local communities on both sides [9].
LULC dynamics in the France–Monaco borderlands are primarily driven by mixed urban development pressures, agricultural land abandonment, and environmental conservation efforts. The region faces challenges as former agricultural areas are increasingly left unused, leading to competing interests between urban sprawl and the preservation of natural landscapes. These changes often involve increased urbanization and a reduction in green spaces, influenced by factors such as population growth and land management policies [7,10].
Therefore, examining the trends of LULC transformation is essential for creating effective, sustainable land management strategies and eco-environmental restoration plans. Urban development highlights the importance of a comprehensive understanding of LULC dynamics for effective socioeconomic and ecological management. As a European cross-border territory with numerous conflicts in land information and administration systems, an integrated suite of products to analyze interval changes is essential.
In particular, transboundary study cases demand accurate observations of shared landscapes or ecosystems that span multiple political borders. As discussed, these territories pose unique challenges in LULC change monitoring due to differing policies, management strategies, and data availability across borders. Monitoring in these areas requires a coordinated approach to accurately assess land dynamics over time, ensuring that policies consider the impacts that extend beyond administrative boundaries [11,12]. The CLC program provides a comprehensive inventory of LULC across Europe. It is designed for monitoring and analyzing land cover changes, providing essential data for environmental management. It provides a map at a 1:100,000 scale, covering all EU member states and associated countries, which is useful for cross-border mapping activities. These data support understanding transboundary LULC patterns and environmental monitoring [13].
Additionally, the GIS is a valuable tool for pre-processing, analyzing, and mapping LULC changes over time. It integrates remote sensing data to effectively visualize and evaluate shifts in land cover patterns, allowing for better understanding and management of environmental resources. Techniques employed within GIS facilitate the modeling, simulation, and prediction of these changes, making it a powerful tool for spatial analysis [14].
Built-up areas exhibit the most dynamic trends in landscape, influenced by various factors that lead to changes in LULC. Studies on these changes provide critical insights for local to regional governmental administrations and urban planning processes. Contextually, the present study primarily aims to map and monitor the changes in LULC in the France–Monaco cross-border territory between 2000 and 2018, with a primary focus on urban development. It comprises a spatiotemporal analysis of features in urban development during this period to identify the specific driving forces behind these changes.
The territory of Monaco, which comprises a dense cluster of hills, is a southward-extending promontory over the Mediterranean Sea. Monaco’s unique geographical characteristics have made it one of the most luxurious tourist resorts in the world [16]. This territory is a diverse host of wealth, with a rich tapestry of languages and more than 139 different nationalities. Thus, it is subject to several legal systems. The dynamic socioeconomic landscape, the wide diversity of opportunities and activities, stability, security, and quality of life have made the Principality of Monaco a unique and special place for both local and foreign investors [17].
On the other hand, the city of Nice is a functional urban area and commuting zone located in the southeastern part of France. It is a unique cross-border territory situated between the sea and the mountains. The Nice metropolitan area is a key territory in the Mediterranean Basin, with an ambitious innovation policy that involves sustainable development, health, and tourism [18]. As a genuine architectural and environmental asset, the extension of the urban regeneration model contributes to achieving ecological transition goals. Furthermore, a wide range of diversity in landscapes encompassed by the city of Nice makes it a rich land in resources [19]. Figure 1 visually depicts the location of the study area within the France–Monaco borderland, adapted by authors.
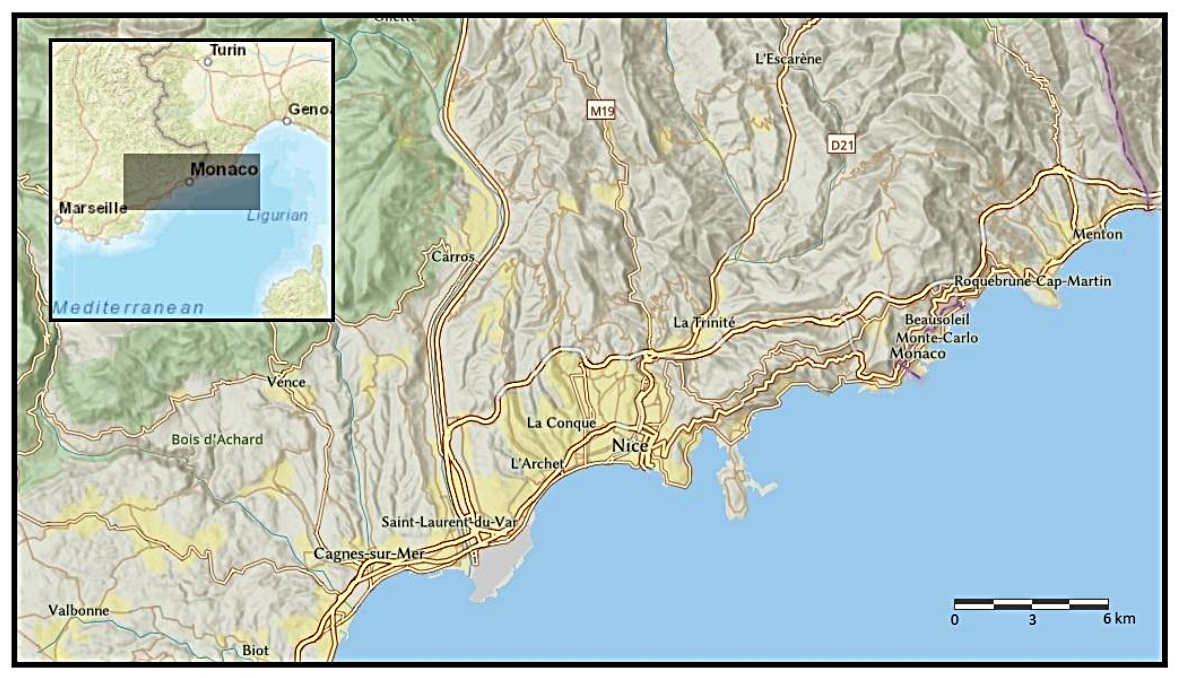 Figure 1. Location of the study area (Source: the authors).
The case of the Monaco–Nice cross-border territory faces challenges regarding the significant differences in GDP per capita among various cities. This issue is the primary obstacle to joint regional development [20,21]. Moreover, the analysis of urban–rural typology and multimodal accessibility potential in this territory indicates three types of regions based on population distribution: rural, intermediate, and urban regions. These features are of utmost significance for the impending redevelopment of derelict land in transboundary regions, particularly given the substantial and diverse natural elements [9].
Data FrameworkCLC has been selected as the dataset for LULC assessment in this study. The CLC program is a pan-European initiative that delivers an inclusive and widespread land cover inventory, classifying land into 5 main classes and 44 thematic categories. It was initiated in 1985 by the EEA, with the first inventory referenced in 1990, and the most recent dataset dating to 2018. The classification allows for a MMU of 25 hectares and minimum a mapping width (MMW) of 100 m. As a separate cartographic criterion, MMW implies that linear features narrower than 100 m are generally not mapped as distinct polygons. While this scale ensures consistency across EU member states, it may underrepresent small-scale urban changes in densely populated areas. For instance, fragmented urban developments below the threshold are aggregated into larger units or merged with adjacent classes. Despite this limitation, the CLC dataset remains the most comprehensive and standardized resource for cross-border studies, enabling comparative analysis of regional trends over time. The main aim of the CLC program includes providing a standardized inventory of LULC across Europe. It is an effective dataset that facilitates environmental monitoring and management and supports policymaking related to LULC and environmental protection at a continental scale [22].
As a pan-European LULC inventory, the CLC compiles information on the state of the environment with regard to priority topics for all the member states of the community. Moreover, it coordinates the compilation of data and the organization of information within the member states or at the international level to ensure that information is fully available, consistent, and compatible [23]. The level of detail and thematic scope have been adjusted to the needs of the EU, including the CAP and Environmental Policy conducted by the Directorate General XI and the EEA, as the accepted land cover nomenclature on the European continent. According to the project assumptions, CLC databases are commonly used both at the EU level and at the national level. For many countries, it is the only systematically updated land cover database covering the entire territory of the country, prepared according to uniform principles [24]. In CLC, land cover nomenclature is organized at three levels. There are five main classes of land cover, comprising the following:
●
●
●
●
●
Different land use types within each of the above groups are specified at the second and third levels of the inventory [14].
To ensure the reliability of the LULC classifications and subsequent change detection, a post-classification accuracy assessment was conducted for each classified year (2000, 2006, 2012, and 2018). Reference data were collected through a combination of high-resolution satellite imagery from the CLMS Coastal Zones and Google Earth, based on the location of the study area. A stratified random sampling approach was used to select validation points representing all major LULC classes (https://land.copernicus.eu/local/coastal-zones. Accessed on 22 Apr 2025).
The urban sprawl rate in the analyzed cities was assessed specifically in areas classified as artificial surfaces according to the CLC inventory at Level 1. This classification helps in understanding the extent of urbanization by focusing on built-up land.
To evaluate the reliability of our LULC classification, we conducted an accuracy assessment following established remote sensing and GIS protocols. High-resolution satellite imagery from the CLMS Coastal Zones and Google Earth was used as reference data. We applied a stratified random sampling strategy to select validation points, ensuring proportional representation of all major LULC classes. For each reference year, we generated a confusion matrix by comparing the classified LULC of each validation point with its true class in the reference data. From this matrix, we calculated standard accuracy metrics: overall accuracy, producer’s accuracy, user’s accuracy, and the Kappa coefficient. These metrics provide a quantitative measure of classification performance. Results are summarized in Tables 6 and 7, confirming the robustness and reliability of our LULC maps for subsequent change detection analysis.
Urban DevelopmentThe spatial distribution of urban development and expansion intensity differs substantially across different regions. Studies confirm that areas with high urban expansion intensity often have concentrated growth in UHIs and exhibit notable spatiotemporal changes, especially in borderlands with fragmented characteristics [25]. For instance, research indicates that urbanization intensity along the coastline is significant and has been a longstanding issue, with implications for local climates and ecosystems [26]. This region has experienced high levels of coastal urbanization, impacted by urban sprawl, specifically in areas near the Mediterranean, such as in our study area [27].
The AUEII was utilized to estimate the rate and intensity of urbanization. It measures the intensity of urban expansion within a given area over a designated period, reflecting how rapidly urban land is being developed or expanded. Specifically, it indicates the percentage of the expansion area of built-up land in a specific geographical unit compared to the total land area of its unit during a specific period, providing valuable insights into urbanization trends and their potential ecological impacts [28,29].
Moreover, the simplicity of the AUEII formula facilitates clear interpretation and comparison of urban growth dynamics, making it a practical tool for assessing urbanization trends in diverse geographic contexts. Numerous studies have employed AUEII to effectively capture the pace and spatial patterns of urban expansion, particularly in cross-border and metropolitan regions [30,31].
The strength, speed, and trend of built-up land development across different time periods, spatial extents, and directions can be compared by means of this index, calculated as follows in Equation (1):
where, TA(n+1) denotes the total area of the target unit at the time of n + 1. BU represents the function of built-up areas within the target unit. Therefore, BU(n+i) and BU(i), respectively refer to the built-up area at the time n + i and i. The interval of the calculation period is considered as n, indicating the number of years between two reference years of LULC changes [32].
We applied post-classification detection methods to examine the spatiotemporal dynamics of patterns in urban development and LULC in the study area. This technique can identify and analyze changes in LULC by comparing classified satellite or aerial imagery from different time periods [33]. This approach effectively highlights changes, such as urban development or environmental transformations, by employing statistical comparisons of previously classified images. These methods can also detect conversions from a particular land cover class to other land use categories and their corresponding areas at different points in time [34].
The main outcome of this stage, based on spatial changes in LULC, is the conversion area matrix, which offers a series of “from one to another” tables by comparing the LULC mappings on a pixel-by-pixel basis.
At the first step, we present the resulting LULC maps of the Nice–Monaco cross-border territory for 2000, 2006, 2012, and 2018, as shown in Figure 2. Additionally, the total extent of each LULC category and the percentage of each within the entire study area for the reference years have also been calculated (Tables 1–5).
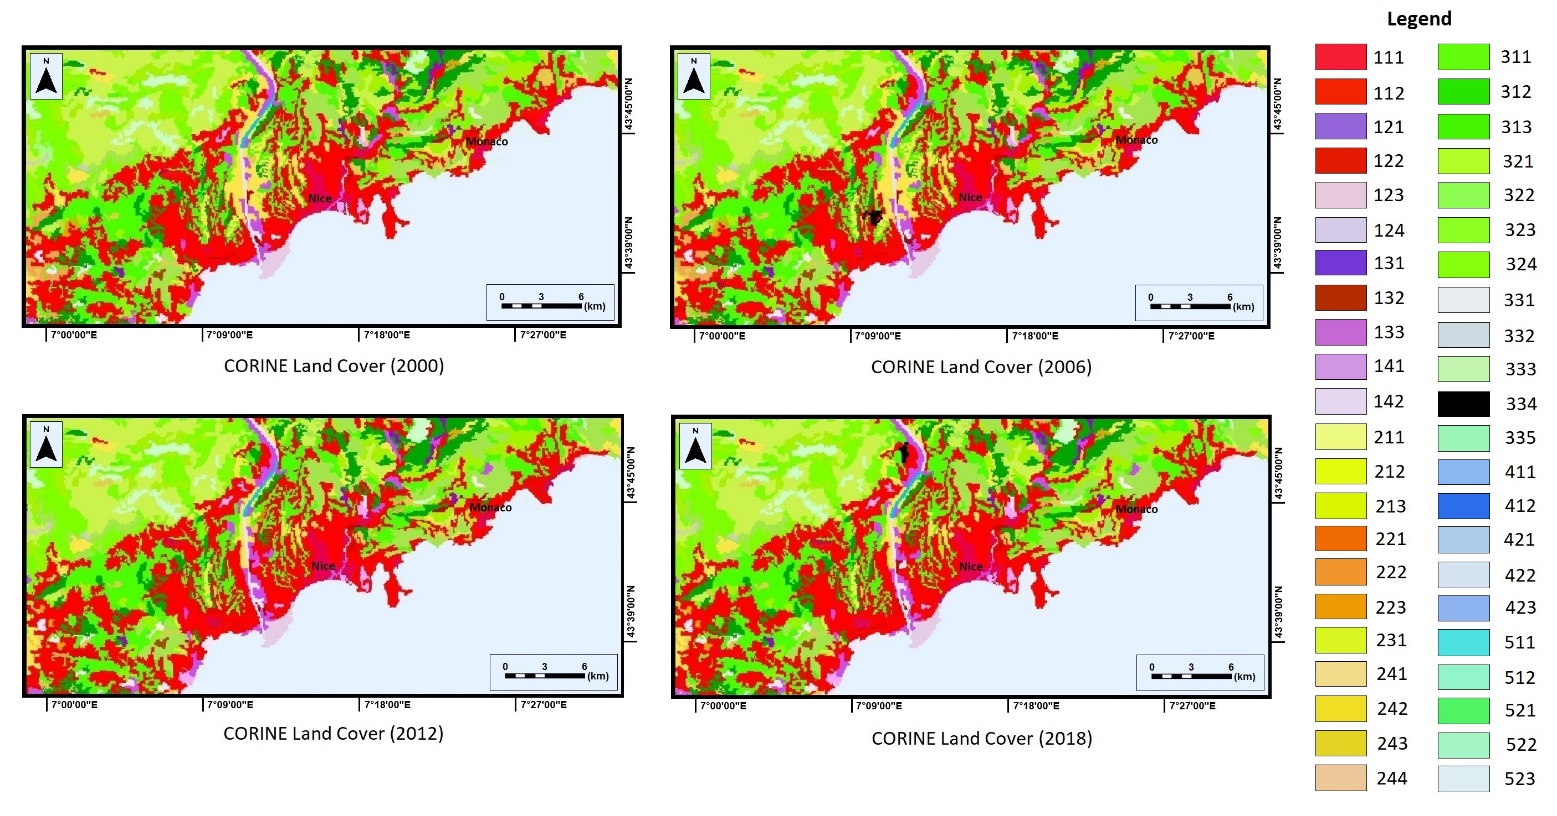 Figure 2. LULC maps of the Nice–Monaco cross-border territory in 2000, 2006, 2012, and 2018 (Source: the authors).
The LULC maps illustrate the spatiotemporal dynamics of urban expansion within the France–Monaco borderlands. They reveal that, prior to 2006, urban growth was limited, but between 2006 and 2012, there was a marked increase, with the most rapid expansion occurring from 2012 to 2018, as reflected by the AUEII as well. The map highlights that Monaco’s urban development has predominantly progressed southeastward, largely due to major projects such as the construction of an eco-district through land reclamation from the Mediterranean Sea. In contrast, urban growth in Nice has mainly extended northward, especially around the emerging Nice Meridia mixed-use district, which embodies the city’s shift toward greener urban planning. The map also indicates other ongoing urban initiatives, such as the extension of the Promenade du Paillon and the development of a new multimodal transport hub at the Port of Nice, underscoring strategies aimed at improving connectivity and sustainability in the region.
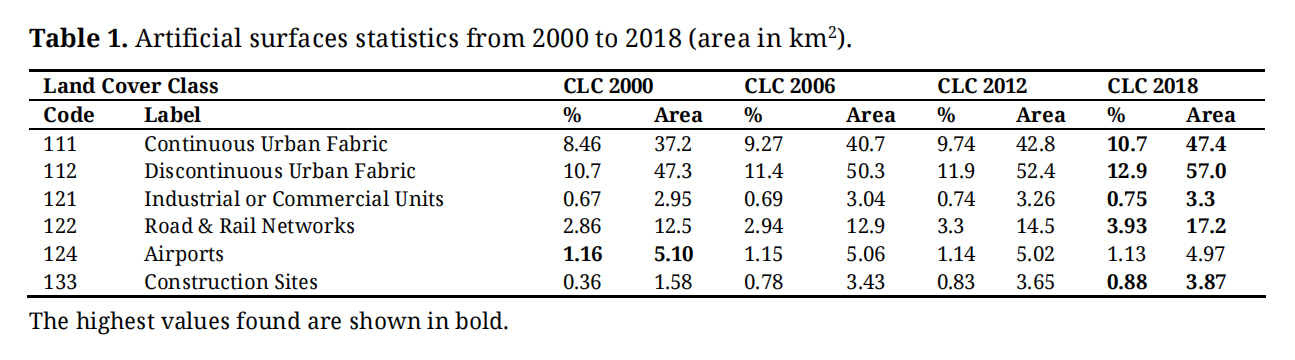 Table 1. Artificial surfaces statistics from 2000 to 2018 (area in km2).
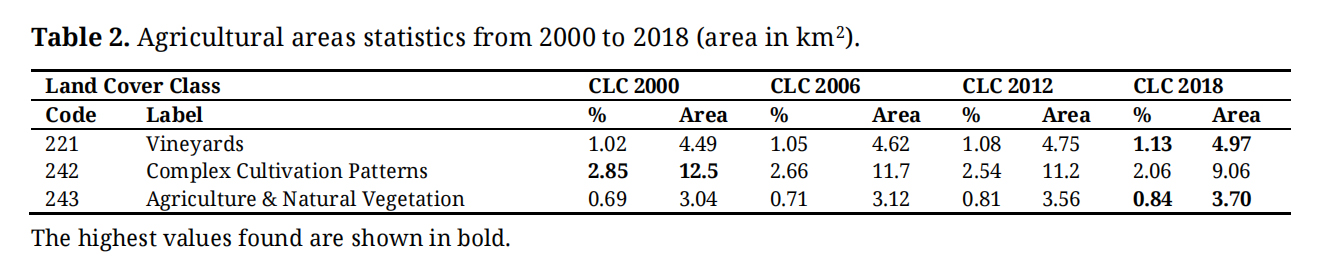 Table 2. Agricultural areas statistics from 2000 to 2018 (area in km2).
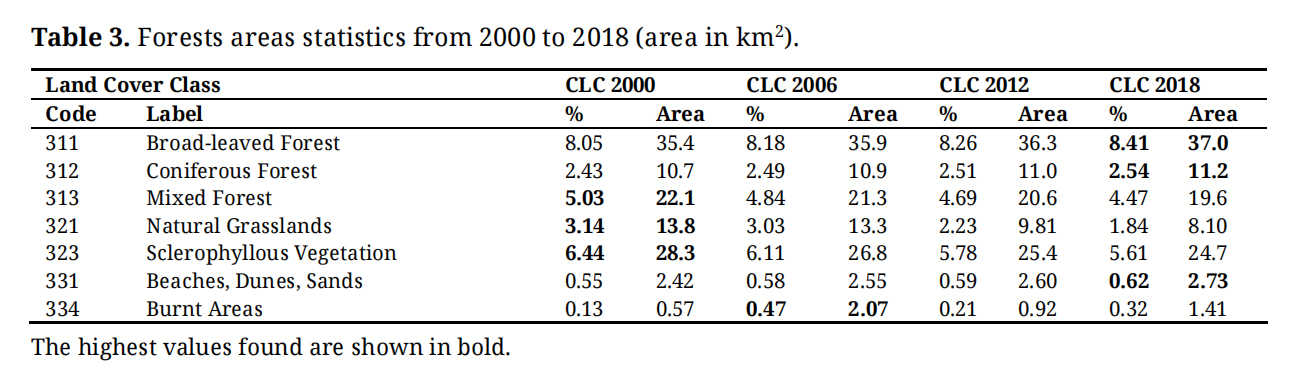 Table 3. Forests areas statistics from 2000 to 2018 (area in km2).
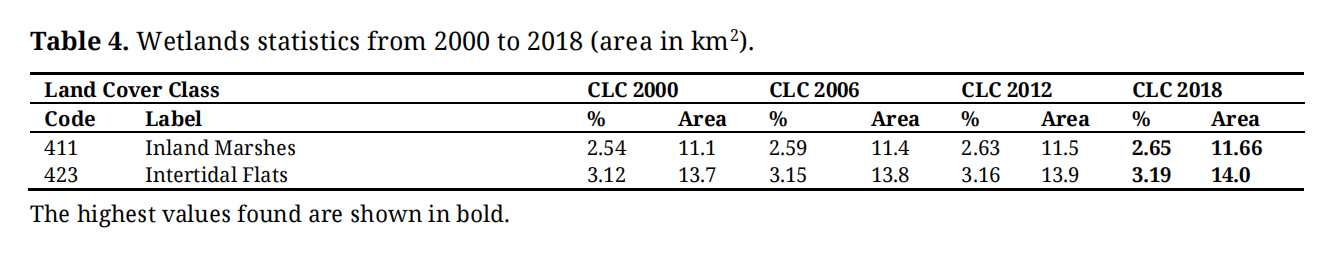 Table 4. Wetlands statistics from 2000 to 2018 (area in km2).
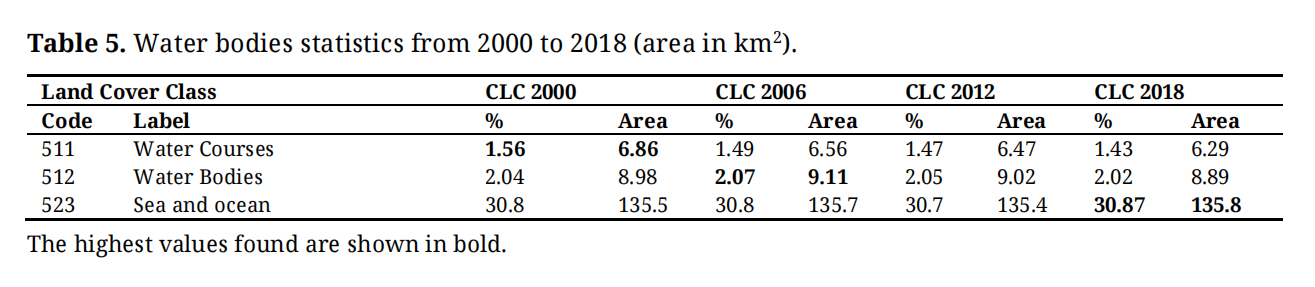 Table 5. Water bodies statistics from 2000 to 2018 (area in km2).
The results obtained from the LULC maps and statistics reveal a remarkable growth in the overall extent of both cities, while the total study area is about 440 km2. In terms of LULC classes, over the reference years of this study, built-up areas have increased by approximately 27.2 km2 at an average rate of more than 1.5 km2 per year. Additionally, agricultural areas have decreased by 2.4 km2, and forest and semi-natural areas have also decreased by 8.7 km2. Meanwhile, wetlands and water bodies remained almost stable during the study period-in this region.
The analysis of LULC changes reveals substantial urban expansion in the Nice–Monaco cross-border region between 2000 and 2018. Built-up areas increased by nearly 20 km², with continuous urban fabric growing from 37.22 km² (8.46%) to 47.48 km² (10.79%), and discontinuous urban fabric expanding from 41.45 km² (9.41%) to 52.07 km² (11.82%). This growth was most pronounced between 2012 and 2018, particularly in Monaco, where new residential, industrial, and infrastructure developments have contributed to the changing landscape. Transport infrastructure expanded significantly, with roads and rail networks increasing by approximately 37%, and construction sites growing by about 140%, reflecting ongoing urban development efforts.
Agricultural lands declined by 12%, from 20 km² to 17.7 km², driven by factors such as land conversion and changes in farming practices. Notably, complex cultivation patterns decreased by 27.7%, suggesting a shift toward less diverse or more industrialized agricultural systems. Conversely, vineyards and natural vegetation showed slight increases, indicating some stability in specialty crops. Forested areas experienced mixed trends, with an overall decline of 7.6%. While broad-leaved and coniferous forests increased modestly by 4.5%, mixed forests, natural grasslands, and sclerophyllous vegetation declined significantly, collectively reducing natural and semi-natural areas by approximately 12 km². This loss raises concerns about biodiversity and ecosystem health.
Coastal and sand dune areas increased by 12.7%, largely due to Monaco’s coastline extension projects. However, rare coastal vegetation along limestone cliffs remains under pressure from urbanization. Burnt areas exhibited variable trends, with an overall increase of 146%, particularly west of Nice, reflecting complex interactions between land use and natural disturbances. Wetlands and water bodies remained relatively stable, with minor fluctuations in coverage, indicating biological resilience despite urban pressures.
The AUEII index has been calculated for the three intervals of study period, based on the designed formulation. Values of 0.333 for 2000–2006, 0.235 for 2006–2012, 0.459 for 2012–2018, and overall value of 0.342 for 2000–2018 have been calculated and recorded. The acceleration of urban expansion, as indicated by the AUEII values, occurred during periods of notable policy changes and regional cooperation. While this temporal overlap suggests a possible link, direct attribution to policy changes was not statistically tested in this analysis.
The acceleration of urban expansion, as indicated by the AUEII values, coincided with several policy developments and regional initiatives. Notably, the implementation of the EU Cohesion Policy, the adoption of integrated urban planning strategies by local authorities, and participation in cross-border cooperation programs such as INTERREG have aimed to foster sustainable development and enhance regional connectivity. While this temporal overlap suggests a possible link, direct attribution to these policy changes was not statistically tested in this analysis [21].
It is important to note that the total increase in built-up areas (27.4 km2) does not directly match the combined decrease in semi-natural and agricultural areas (11.1 km2). This discrepancy is primarily due to land reclamation activities in Monaco, where new built-up land is created from the sea rather than from existing terrestrial land covers. Additionally, some built-up expansion occurs at the expense of other land cover types, such as forests, wetlands, or water bodies. Finally, the spatial resolution and mapping conventions of the CLC dataset, including its MMU and width, can result in the aggregation or omission of small or fragmented land cover changes. These factors together explain the observed difference and are important considerations when interpreting land use change (LUC) statistics in this region.
Finally, we calculated the conversion matrix using the post-classification comparison change detection method, where LULC mappings from various periods are categorized distinctly to facilitate effective comparison of changes. The results obtained for the periods 2000–2006, 2006–-2012, and 2012–2018, along with a summary of the highest LULC transformations, are displayed in Table 6.
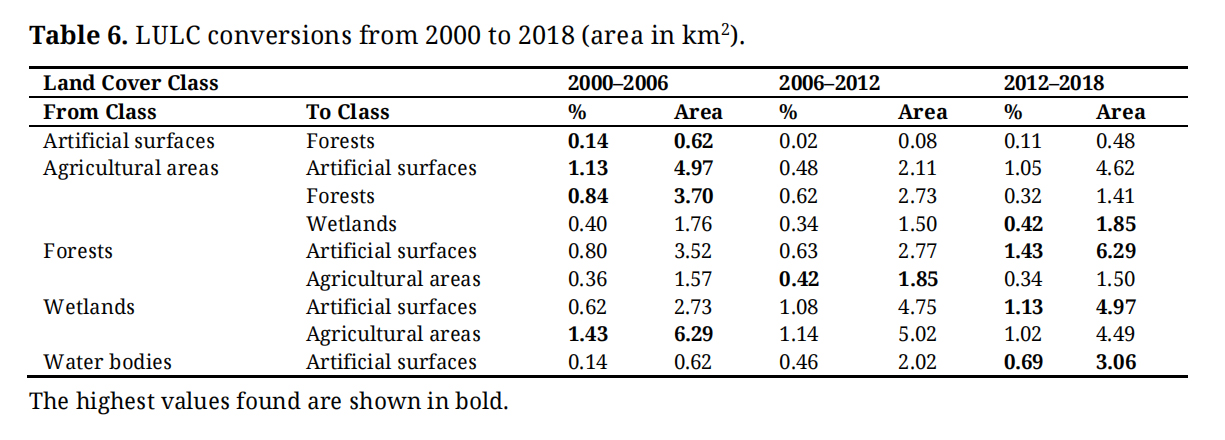 Table 6. LULC conversions from 2000 to 2018 (area in km2).
The findings from the LULC transformations indicate that the majority of built-up areas has been developed by transforming previously green land, farmland, bare land, and both wetlands and water bodies. Therefore, the most significant conversions in LULC can be observed in arable lands, complex cultivation lands, grasslands, and sclerophyllous vegetation. The transition from farmland to bare land occurred due to urban expansion and development, resulting in the abandonment of agricultural areas. As agricultural practices evolve, sustainable land use policies become essential to balance the need for food production with environmental conservation. Nevertheless, greening initiatives and the establishment of large-scale artificial forests have led to significant positive environmental shifts. This process not only enhances aesthetics but also provides essential environmental, social, and health benefits, contributing to sustainable urban development. Figure 3 illustrates the spatial distribution of these dynamics over the study period, distinctly visualized by each LULC category.
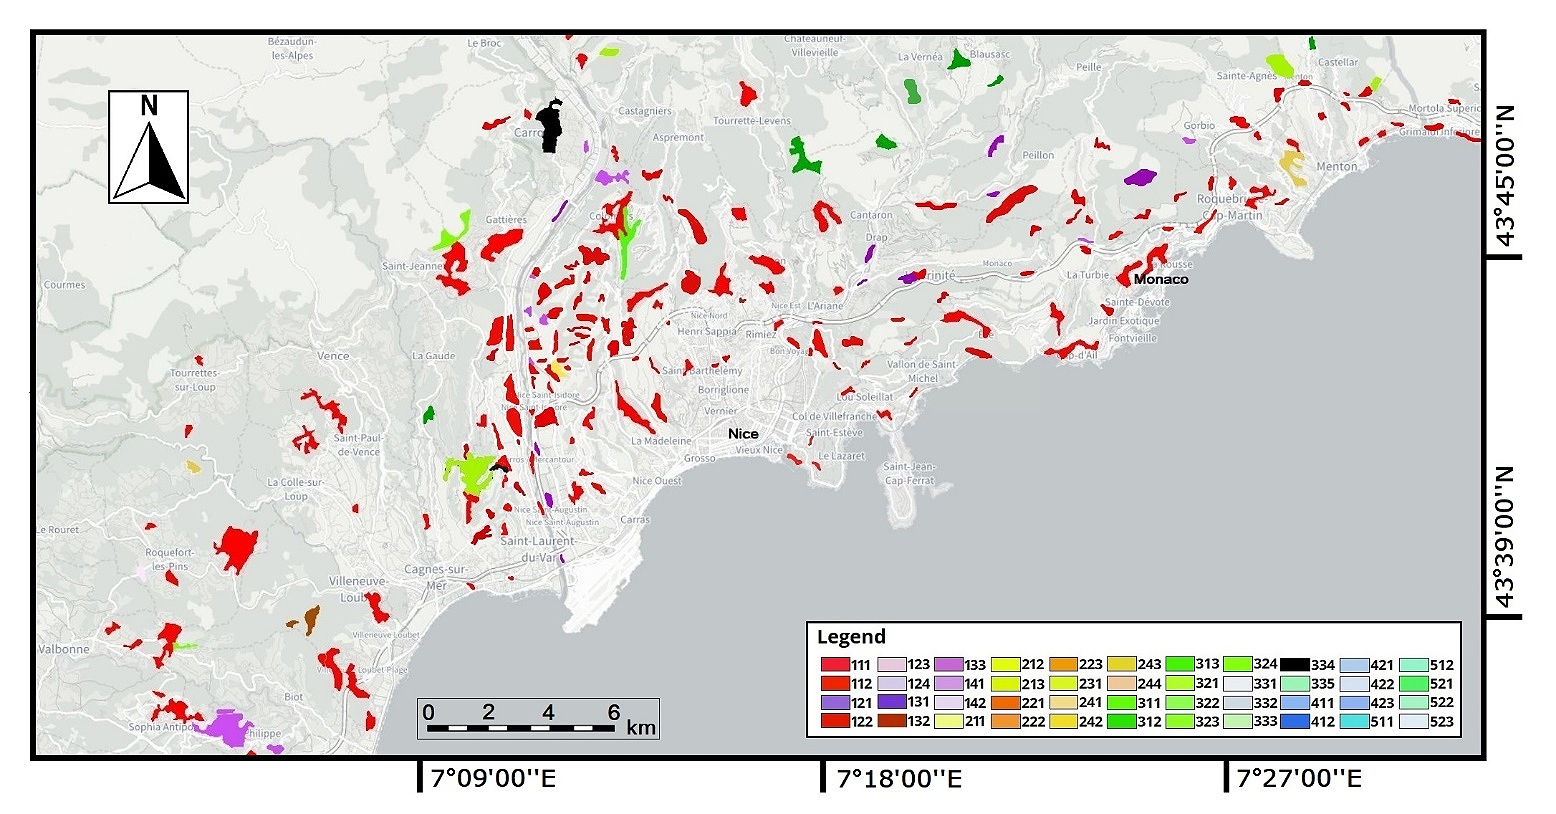 Figure 3. LULC dynamics between 2000 and 2018. (Source: the authors).
As a result, we aim to display the LULC dynamics of artificial surfaces based on the mean distance from urban centers, including the urban cores of Nice and Monaco. Figure 4 presents the main quantifications and urban expansion in the Nice–Monaco cross-border territory. The findings provide accurate evidence of urban development trends.
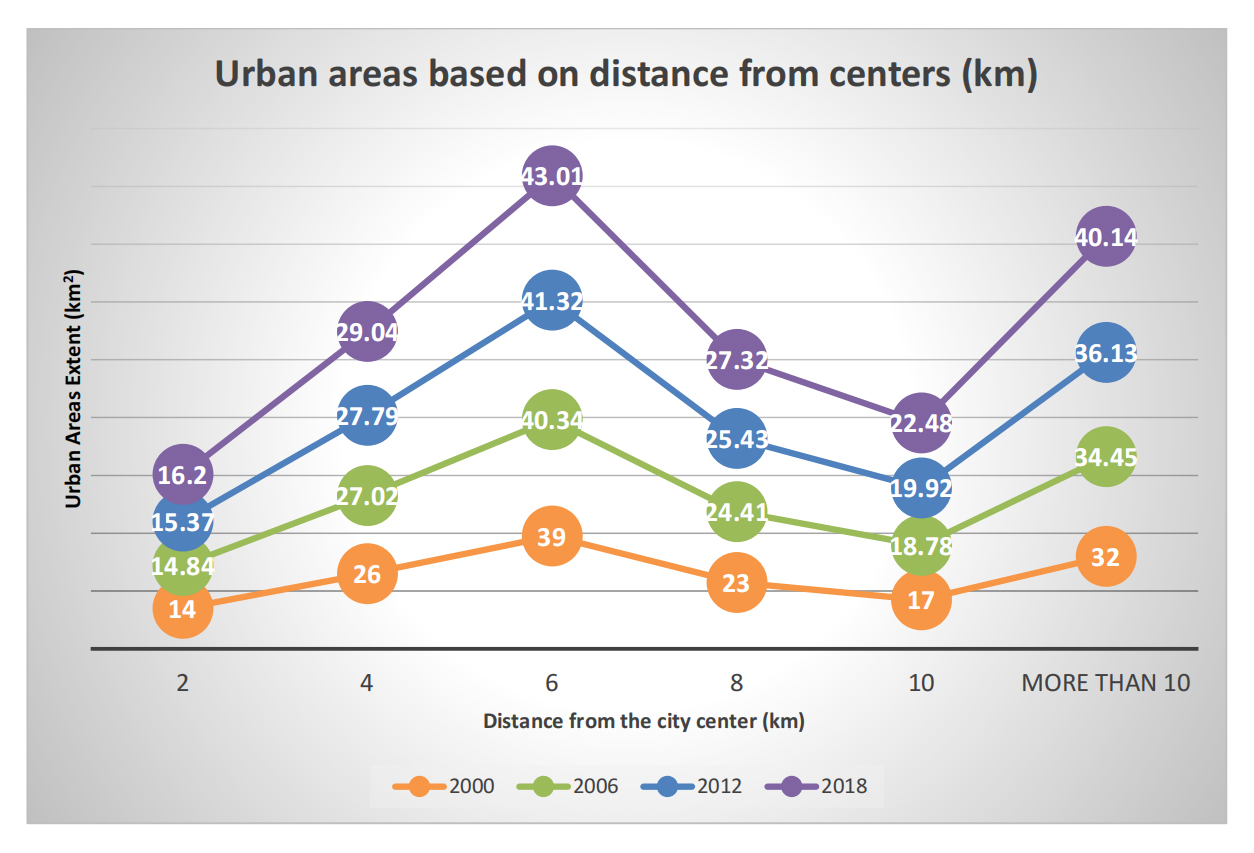 Figure 4. Distribution of built-up areas by distance from urban centers, 2000–2018. (Source: the authors).
The accuracy assessment process for our LULC classification followed established remote sensing and GIS best practices to ensure the reliability of the results. As previously mentioned, a combination of high-resolution satellite imagery from CLMS Coastal Zones and Google Earth was used. Furthermore, a stratified random sampling approach was applied to select validation points, ensuring that all major LULC classes present in the study area were proportionally represented. This strategy enabled us to minimize sampling bias and provided a robust basis for evaluating classification performance.
For each reference year, we generated a confusion matrix by comparing the LULC class assigned to each validation point in our classified maps with its actual class in the reference data. This matrix allowed us to calculate standard accuracy metrics: overall accuracy (the proportion of correctly classified points), producer’s accuracy (the probability that a reference pixel is correctly classified, measuring commission error), user’s accuracy (the probability that a classified pixel matches the reference, measuring commission error), and the Kappa coefficient (which accounts for agreement occurring by chance). These metrics quantitatively summarize the agreement between our classification and the reference data, providing a transparent measure of reliability. Overall accuracy values above 84% and Kappa coefficients above 0.79 were considered indicative of robust classification results, suitable for reliable change detection analysis.
The results demonstrate the robustness of our LULC classifications and support the validity of our change detection findings. For each distinct validation point, we recorded the assigned LULC class and the corresponding the true class from the reference data. As a result, the confusion matrix (see Table 7) represents classified classes as rows and reference classes as columns. In fact, each cell contains the count of pixels classified as the row class but actually belonging to the column class. Subsequently, we were able to calculate the proposed accuracy metrics as part of the LULC classification assessment (Table 8) [19].
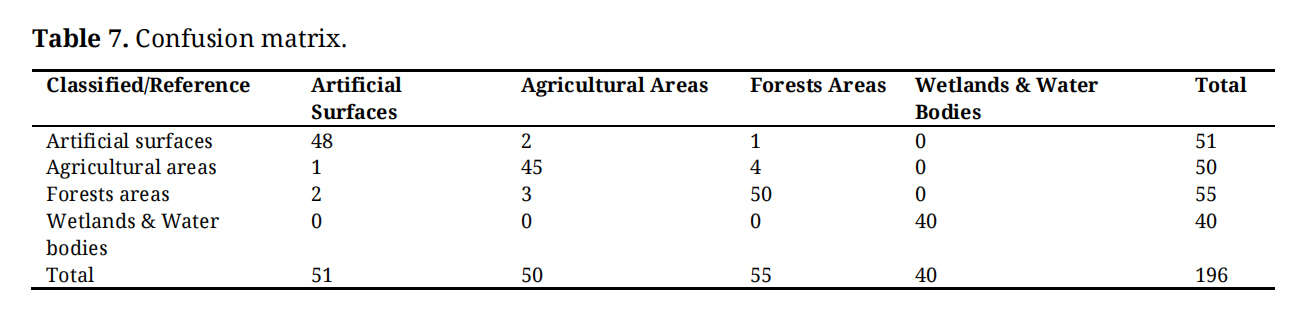 Table 7. Confusion matrix.
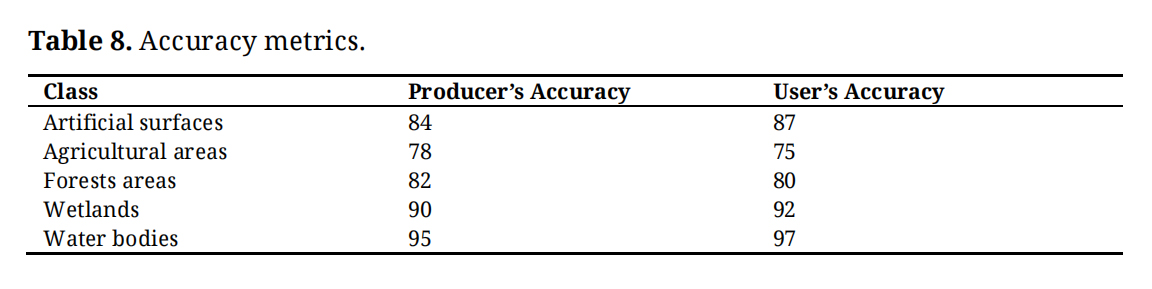 Table 8. Accuracy metrics.
Regional planning in the Nice–Monaco area has emphasized cross-border cooperation to harmonize infrastructure development and optimize urban networks. Early reforms (2000–2006) that relaxed restrictions on urban development triggered rapid urbanization. Subsequent planning shifted focus toward medium-density urban villages integrated with natural areas, reflecting European metropolitan design principles and addressing demographic and environmental challenges. During this intermediate phase, development rates moderated.
In the most recent period, strategies such as the “Metropole Nice–Monaco” initiative have prioritized sustainable development, aiming to balance increased housing with environmental protection. Notably, key projects such as the Portier Cove land reclamation exemplify this approach, combining urban expansion with eco-friendly design and the integration of renewable energy. This phase reflects the highest urban growth intensity, driven by a strategic transition from industrial-oriented development to the creation of functional, high-quality urban living spaces [35].
This rapid urbanization, coupled with population growth, is also reshaping the landscape of human settlement. The population of Nice was 342,800 at the beginning of the study period; however it increased to 353,700 by 2018 due to a combination of urban expansion, rural–urban migration, and natural growth. Additionally, the population density in the city rose from 4761 people/km2 in 2000 to 4913 people/km2 in 2018. On the other hand, Monaco recorded a population of 32,400 in 2000, which increased to 38,200 in 2018. As one of the most densely populated places in the world, Monaco had a population density of more than 16,000 people/km2 in 2000, rising to 18,910 people/km2 in 2018. These results indicate a population growth of 3.1% in Nice, while Monaco experienced an 18% increase between 2000 and 2018. The detailed population figures and densities for those two cross-border cities are shown in Figures 5 and 6, respectively.
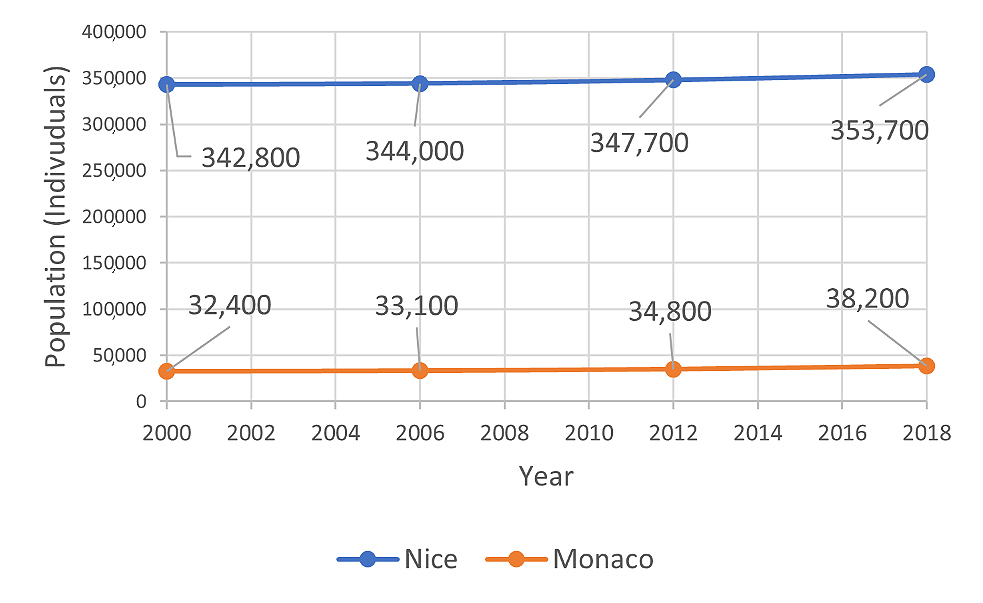 Figure 5. Population trends in the study area in 2000, 2006, 2012, and 2018. (Source: World Bank).
The increasing population trends in these two cities have led to the expansion of public infrastructure and the conversion of large land areas for housing, industrial, and commercial purposes. This pattern of urban sprawl is driven by the need to accommodate more residents, posing a growing challenge to sustainable development, particularly in cross-border territories.
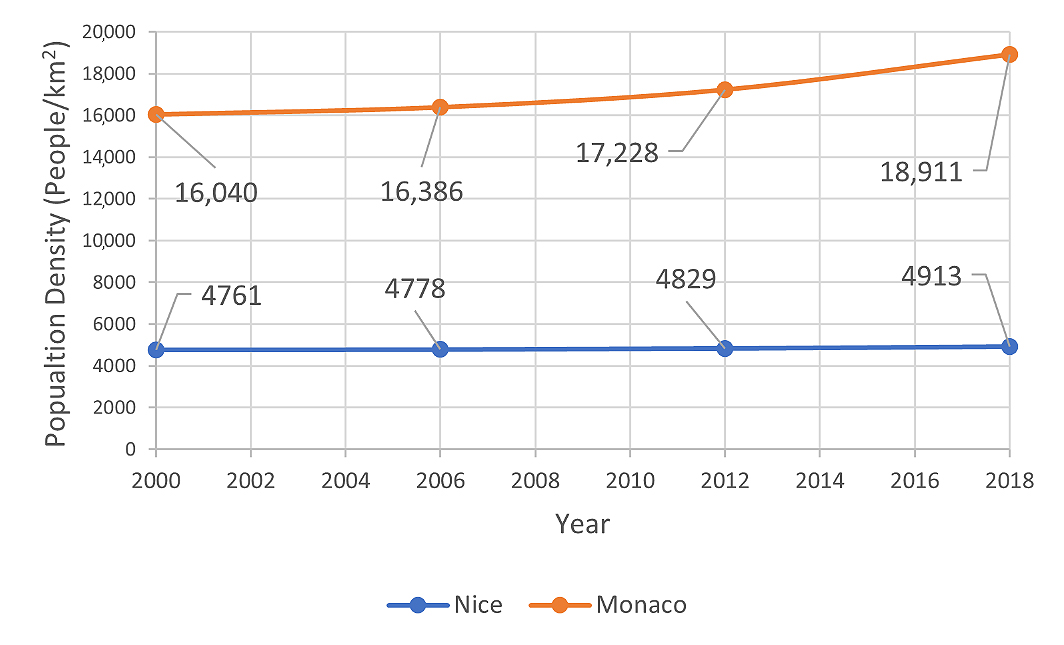 Figure 6. Population density in 2000, 2006, 2012, and 2018 (people per km2). (Source: World Bank).
LULC changes typically reflect the strongest trends in urban development and built-up areas near population centers and infrastructure. For instance, previous studies have confirmed that LULC changes tend to intensify with proximity to urban areas, with a marked pattern of net deforestation occurring within 4 km of these features [36]. Additionally, rural areas farther from urban centers often experience limited development, making them potential candidates for future expansion as new waves of urban growth emerge [37].
Returning to the distance-based analysis of urban development, as illustrated in Figure 4, urban development increases with distance from the urban center across all three time periods. This trend is more pronounced in the most recent years (2012–2018) compared to earlier periods (2000–2012).
Between 2000 and 2006, the growth rate in urban areas was slow and approximately linear, indicating modest urban expansion during this period. For instance, within a 2 km radius of urban centers, urban development was just above 1 km², rising slightly to about 2 km² at distances greater than 10 km. This trend reflects limited urban expansion, likely concentrated near core urban centers. A steeper slope compared to the previous period suggest that development was more pronounced between 2006 and 2012. Urban expansion reaches nearly 4 km² beyond 10 km mark, suggesting that suburban or peri-urban areas experienced higher development rates. This trend may point to increasing urban sprawl, potentially driven by economic growth, population pressures, or infrastructure developments. The following period (2012–2018) shows the sharpest rise in urban development, with the slope of urban land cover transformation significantly steeper than in the two previous periods. Urban expansion surpasses previous rates beyond 10 km, highlighting a surge of activity in outer urban areas. Such rapid growth may be attributed to factors such as expanded connectivity, rising demand for affordable housing, or policy incentives encouraging development in peripheral regions.
Distance-based insights suggest grouping the findings into three catergories. In urban cores, areas within 2 to 4 km from city centers, urban expansion remains relatively stable across all periods, with limited variation. Growth in these zones may be constrained by space limitations or shaped policies favoring densification over outward expansion. Transitional areas, located 4 to 10 km from urban centers, began to show evident transformations across the three periods, with the most pronounced growth occurring in the most recent one. Finally, the outer areas, those farthes from urban cores, exhibit the most significant LULC conversions and the highest rates of urban expansion. Between 2012 and 2018, development in these peripheral zones more than doubled compared to the 2000–2006 baseline. This trend reflects a significant shift toward suburbanization or even exurban development.
Urban expansion in the Nice–Monaco cross-border area has been influenced by improved transportation networks, rising property prices, and changing residential demands, all of which have encouraged growth in suburban and peripheral zones. Policy measures aimed at promoting sustainable and balanced development, particularly after 2012, have supported this outward expansion, although some efforts also aim to encourage urban densification as a means to reduce environmental impacts.
Population growth has further driven urban sprawl, as central areas have become overcrowded, leading to significant LUC that threaten agricultural lands and natural habitats. Between 2000 and 2018, urban expansion occurred in all directions along major transportation routes, with the most significant growth observed to the north, west, and northwest in France, and more broadly around Monaco, particularly in its northern areas. This spatial pattern reflects regional planning priorities oriented along the east-west axis.
These urbanization trends have resulted in socio-economic and environmental challenges, including increased urban heat island effects due to proliferation of impervious surfaces and significant impacts on biodiversity through habitat loss and fragmentation. Rapid urban growth in this ecologically sensitive Mediterranean region poses persistent risks to ecosystem health and long-term sustainability [38,39].
As a result, urbanization has likely led to a decrease in local ecosystem service value (ESV), as natural and agricultural areas were replaced by urban landscapes and wetlands were converted into agricultural land. For instance, the ESV in this region has declined significantly, with projections indicating a continued decrease in natural land cover over the last two decades. This trend highlights the urgent need for conservation and sustainable management practices to mitigate further losses [40,41]. Additionally, rapid land subsidence, particularly in Monaco, has been attributed to factors such as groundwater overexploitation, high-rise construction, and municipal engineering activities. These actions have led to significant geological challenges, resulting in infrastructure damage and increasing risks to urban environments. Continuous groundwater withdrawal is particularly problematic, as it causes notable declines in water levels, thereby exacerbating subsidence [42]. Urbanization also contributes significantly to increased surface runoff in both metropolitan areas, making them more susceptible to flooding, as reported in the literature [43]. Nonetheless, hydrological impacts were not directly modeled or quantified in this study.
In this study, we designed and employed a hybrid approach that combines multi-temporal LULC data analysis with GIS tools to quantitatively assess the dynamics of urban expansion and land use in the metropolitan areas of Nice and Monaco between 2000 and 2018. The findings indicate that this cross-border territory has undergone significant transformations in LULC. Over the past two decades, built-up areas have increased 28 km², approximately three times the average growth rate observed in European border regions, resulting in a considerable decrease in natural and semi-natural landscapes. Consequently, the pace of urbanization has accelerated to unprecedented levels.
Urban expansion in this cross-border territory was minimal prior to 2006, showed notable growth between 2006 and 2012, and significantly accelerated from 2012 to 2018, as indicated by a comparative analysis of the AUEII during the study period. In particular, the dominant direction of urban expansion in Monaco has been toward the southeast, primarily driven by development efforts such as the construction of an eco-district through land reclamation from the Mediterranean Sea. On the other hand, urban expansion in Nice has predominantly occurred to the north, especially in the emerging mixed-use district of Nice Meridia, which reflects the city’s transition toward a greener urban environment. Additionally, ongoing projects, such as the extension of the Promenade du Paillon and the development of a new multimodal transport hub at the Port of Nice, underscore strategic planning efforts focused on improving connectivity and promoting sustainable urban growth.
Urban sprawl in the Monaco metropolitan area is characterized by extensive development radiating outward from existing urban centers and along major transportation routes, similar to patterns observed in similar urban context across Europe. This phenomenon poses substantial challenges to both environmental and economic sustainability. In the Nice metropolitan area, urban sprawl follows a comparable trajectory, expanding outward from the city center and significantly affecting adjacent zones. These patterns of urbanization present challenges similar to those observed in other parts of the French Mediterranean coast, where urban sprawl is also a significant concern.
The subsequent LULC changes derived from urban expansion in the Nice and Monaco borderlands have been significantly influenced by policy reforms aimed at economic development and accommodating population growth. These changes have led to various forms of eco-environmental degradation, including land exploitation, reduced agricultural productivity, disturbances to forested areas, increased air pollution, and alterations to water resources. Monitoring these changes is crucial to address the environmental issues they generate. Adaptation options based on past and present LUC trends in the southern borderlands of France and Monaco should include integrated land management practices that consider logging, demographic pressure, and infrastructural development, as well as collaborative approaches between neighboring regions to address climate change mitigation. Strategies may involve monitoring changes in LULC and ecosystems to enhance resilience against climate extremes, such as droughts and floods. Additionally, fostering cooperation in policy-making and resource management can lead to more effective adaptation responses.
Current regional developmental ideology focuses on “economic development first”, but this should indeed be adjusted to “sustainability first”. Cooperation has been proactive in initiating sustainable development policies to maintain the quality of life in urban areas, aligning with broader goals set by the United Nations. Transitioning to a sustainability-first model would ensure that economic growth does not compromise environmental and social well-being, which is particularly important in a densely populated and ecologically sensitive region like the Mediterranean.
The cross-border territory between Monaco and Nice is characterized by its proximity to vast and numerous water bodies, wetlands, and vegetation, forming an eco-environmentally sensitive region that contributes to a rich aquatic and marine ecosystem. It has a historical commitment to preserving these marine ecosystems, emphasizing the importance of environmental protection in the area. Therefore, urban expansion in such a delicate-complex extent should be restrained to prevent ecological degradation, habitat loss, and increased pressure on urban ecological resources. The expansion can lead to the deterioration of vital ecosystems and the services they provide, highlighting the need for careful planning and regulation.
This study provides valuable insights into long-term LULC changes and urban expansion patterns in the Nice-Monaco cross-border region; however, several limitations should be noted. First, the temporal resolution is limited to four discrete time points (2000, 2006, 2012, and 2018), which may overlook short-term fluctuations or episodic events occurring between these years. Second, while spatial and temporal correlations between urbanization and LULC changes are described, the study does not establish statistical causality. Regression analyses and other modeling approaches would be necessary to rigorously test these relationships. Moreover, even with such analyses, disentangling the complex causal mechanisms linking urbanization, policy interventions, environmental impacts, and land cover dynamics remains a challenging task. Future research should aim to incorporate higher-frequency temporal data and advanced statistical and hydrological modeling to better understand these interactions and support sustainable urban planning.
CLMS provides the LULC data that were utilized in this research. All mappings represented in this study can be viewed and obtained from https://land.copernicus.eu/. Furthermore, other data and statistics used in this study (population, population density, and other related indicators) have been derived from the World Bank Open Data Platform at https://data.worldbank.org/indicator/SP.POP.TOTL.
Conceptualization, AB and RAC; Methodology, AB and RAC; Software, AB; Validation, AB, RAC, and PF; Formal Analysis, AB and RAC; Investigation, RAC and PF; Resources, AB, RAC, and PF; Data Curation, AB and PF; Writing—Original Draft Preparation, AB; Writing—Review & Editing, RAC and PF; Visualization, AB; Supervision, RAC and PF; Project Administration, RAC and PF; Funding Acquisition, RAC and PF.
The authors declare that there is no conflicts of interest.
This work was supported by national funds through the Fundação para a Ciência e a Tecnologia, I.P. (Portuguese Foundation for Science and Technology) by the project UID/05064/2023—Research Centre for Endogenous Resource Valorization.
1.
2.
3.
4.
5.
6.
7.
8.
9.
10.
11.
12.
13.
14.
15.
16.
17.
18.
19.
20.
21.
22.
23.
24.
25.
26.
27.
28.
29.
30.
31.
32.
33.
34.
35.
36.
37.
38.
39.
40.
41.
42.
43.
Behradfar A, Castanho RA, Ferreira P. Urban development and land use/land cover changes in the European Borderlands of Nice and Monaco. J Sustain Res. 2025;7(3):e250053. https://doi.org/10.20900/jsr20250053.

Copyright © Hapres Co., Ltd. Privacy Policy | Terms and Conditions


