Location: Home >> Detail
J Sustain Res. 2025;7(3):e250060. https://doi.org/10.20900/jsr20250060
 ,
Alexandre Morais Nunes 2,* ,
João Ricardo Catarino 2 ,
Ana Catarina Kaizeler 3 ,
Vanda Martins 1
,
Alexandre Morais Nunes 2,* ,
João Ricardo Catarino 2 ,
Ana Catarina Kaizeler 3 ,
Vanda Martins 1
1 School of Business and Administration, Universidade Politécnica de Setúbal, Campus do IPS, Estefanilha, Setúbal 2910-761, Portugal
2 CAPP—Centre for Public Administration and Public Policies, Institute of Social and Political Sciences, Universidade de Lisboa, Rua Almerindo Lessa, Lisboa 1300-663, Portugal
3 SOCIUS—Research Centre in Economic and Organizational Sociology, School of Economics and Management, Universidade de Lisboa, Rua do Quelhas, nº 6, Lisboa 1200-781, Portugal
* Correspondence: Alexandre Morais Nunes
The study aims to define a composite indicator capable of assessing the ability of municipalities to attract tourists to their territories, considering a series of factors related to tourism. The proposed index integrates variables such as tourist infrastructure, the cultural and tourist offer, the flow of tourists, environmental sustainability, and quality of life in healthcare, with the aim of providing a comprehensive measure of municipal tourist attractiveness. The analysis is based on quantitative data from official sources such as the National Statistics Institute (INE). To define the index, statistical methods were applied and specific weights defined for each of the components, according to their relevance to tourist attractiveness. The index was calculated using a weighted sum of the normalised values, allowing comparison between municipalities. In addition, a sensitivity analysis was carried out to test the robustness of the index and assess the consistency of the results. The index introduces a practical tool for assessing and comparing the capacity of municipalities to attract tourists, guiding public policies and sustainable development strategies in the tourism sector.
IMAT, Tourism Attractiveness Index; INE, National Statistics Institute
In the Portuguese context, tourism is seen as one of the most important socio-economic development factors and currently occupies a prominent place in the national economy [1,2]. Portugal is one of the most visited countries, and the tourism sector accounts for an exceptional share of Portugal's GDP [3,4] and plays a key role in job creation and regional development [5,6]. On the other hand, the sector has served as a tool for promoting countries [7,8]. However, the ability of municipalities to effectively attract and retain tourists is still far from uniform [9,10]. While municipalities such as Lisboa, Porto and Funchal boast high levels of tourists, many others, more rural and less developed, struggle with lower levels of tourism development. This disparity in the level of development between municipalities emphasises the need to produce a method for measuring the factors that stimulate tourist attractiveness [11,12].
In Portugal, the concept of tourist attractiveness is multifaceted and encompasses both traditional factors (infrastructure, networks and access) and modern factors (cultural and historical offerings, environmental sustainability and quality of life in healthcare). A municipality's ability to attract tourists is moulded by an intricate web of elements, with varying levels of relevance and intrinsically dependent on municipal and regional characteristics [13,14]. In other words, urban municipalities tend to prioritise infrastructure, access and entertainment options [15,16], while rural municipalities seek to emphasise landscape features, sustainability and cultural offerings [17,18]. However, despite the relevance of some of these factors, municipalities in Portugal lack an inclusive and standardised tool for assessing the tourism potential of each municipality [19,20]. The gap is particularly visible in less visited regions, where local authorities often need information [21,22] and timely guidelines for identifying and capitalising on tourism assets.
Studies on the competitiveness and attractiveness of tourism have contributed to a broad understanding of the factors that influence tourists' destinations. Hassan [23] and Munir et al. [24] in their studies, emphasised the role of infrastructure, access and economic performance in determining municipal attractiveness. Munar and Ooi [25] and Dugulan et al. [26] emphasise the importance of cultural and heritage offerings in tourism competitiveness, claiming that municipalities with higher levels of historical assets are those that exhibit better conditions for attracting visitors.
Gössling and Peters [27] and Baloch et al. [28] who defend the importance of environmental sustainability as an essential factor in tourism and emphasise the need for municipalities to adopt ecological preservation and the best practices of responsible tourism as factors in developing the competitiveness and attractiveness of regions, highlight another relevant factor. In terms of the tourist attractiveness of municipalities, tourists' perceptions are essential [29,30], and theory tends to treat the factors that attract tourists individually and in isolation [31,32], rather than examining them in a broader and more interconnected way. In Portugal, where the dynamics of the tourism sector can vary significantly between municipalities, the adoption of fragmented approaches has not been able to provide a broad and rigorous analysis of municipalities' levels of tourist attractiveness [33,34].
One of the most prominent problems with tourism indices is that most of the indicators were developed with the purpose of producing assessments at the national level [35,36] and without the detail needed to carry out analyses at the municipal level [37,38] Although the indices assess indicators such as the number of tourists, available beds and overnight stays, they often neglect other aspects such as environmental sustainability [39,40] or quality of life in healthcare [41,42], which are increasingly recognised as essential for attracting tourists [43,44]. In doctrine, the indices undervalue regional diversity [45,46] and the unique characteristics of municipalities [47,48], which produces a significant gap in the ability to comprehensively analyse and compare municipal tourist attractiveness.
The study aims to address the methodological gap and suggest a probable tourism attractiveness index, specifically designed for municipalities. By integrating various dimensions of tourist attractiveness, including infrastructure, access, cultural and recreational offerings, tourism heritage, environmental sustainability and quality of life in healthcare, the index provides a holistic tool for assessing the level of attractiveness of municipalities in attracting tourists. According to the literature, attractiveness factors should be selected based on their relevance to the country's context [49,50]. The index should provide a standardised methodology [51,52] and be based on statistical data [53,54] that allows tourism performance to be compared and municipal tourism strategies to be improved.
The study's contribution is twofold. Firstly, because it suggests a practical index for political actors and agents in the sector, supporting the process of evaluating tourist attractiveness and the possible identification of areas for intervention. Secondly, the study reveals an innovative proposal for synthesising the various factors that influence municipal tourism, providing a more rigorous measure of attractiveness. The index also contributes to the development of the literature on the attractiveness of tourism in Portuguese municipalities.
By offering a more demanding analysis, the study contributes to the discourse on the levels of tourist attractiveness of municipalities, especially those located in rural or less visited areas. By incorporating environmental sustainability and quality of life in healthcare, the study emphasises the need to adopt more balanced models for tourism development, which take into account the socio-economic development of local communities.
Finally, the study aims to develop a comprehensive tourism attractiveness index based on statistical data, capable of estimating the capacity of Portuguese municipalities to attract tourists and which will serve as a decision-making tool, helping municipalities to identify their strengths and weaknesses and to devise more targeted strategies for increasing tourist attraction.
The approach consists of a case study, with a quantitative methodological framework, through the analysis of the available tourist offer in the municipalities (infrastructure, available services and municipal expenditure) and excluding demand (individual perceptions and tastes of tourists), with the aim of verifying the possibility of constructing a possible tourist attractiveness index for Portuguese municipalities. The starting point is to verify which municipalities are most efficient in terms of tourism offerings. The index aims to measure and compare the potential capacity of municipalities to attract tourists through the available offer.
The analysis is based on secondary data collected from national and institutional sources. The primary source of the data was the National Institute for Statistics (INE), supplemented by data from PORDATA. The reference interval for the data is 2020–2024, selected due to the availability of information. The study covers all municipalities in Portugal.
To define the Index of Municipal Tourist Attractiveness (IMAT), five main dimensions were defined, and each dimension includes a set of indicators that reflect the different aspects of the attractiveness of a given municipality, all of which are standardised and weighted equally.
The indicators were selected through a literature review and validated based on their availability, relevance and alignment with the context of the Portuguese tourism sector. The dimensions defined and the indicators selected were as follows:
1.
2.
3.
4.
5.
To enable inter-municipal comparability between variables with different scales and units, min-max normalisation was applied:
Where x'ij is the composite score of indicator j for municipality i and xij is the value of the municipality's indicator. The index is analysed and interpreted using a scale between 0 and 1. In terms of weights, each indicator contributes equally to the index score.
The tourist attractiveness index for each municipality was obtained using the following weighted linear aggregation method:
Where wj translates the weight given to each of the j indicators in the final composition of the index. The weights vary between 0 and 1, and the sum of all is equal to 1 (Σwj = 1), in order to ensure that all the indicators contribute proportionally.
Finally, in order to analyse the robustness of the index, the study includes a sensitivity analysis of the results with the aim of assessing the influence of municipal options and the consistency of the conclusions. For this purpose, the analysis was carried out with the limits (0, 1) for the year 2024, using the following expression:
Where parameters α and β represent the lower and upper limits of the new analysis intervals. In preparing the index, we chose to assign identical weights to all indicators. This model is adopted in the literature when there is insufficient empirical evidence and/or theoretical consensus regarding the relative importance of indicators, ensuring neutral and transparent weighting [55,56].
The index calculations were all carried out using Excel.
This section aims to present and analyse the results obtained from the construction of a Composite Index of Tourist Attractiveness (IMAT), applied to all Portuguese municipalities and based on data for the period 2020–2024. The index was developed to enable a comparison of the tourist attractiveness of the different municipalities, using standardised statistical indicators aggregated in a weighted manner.
The IMAT was developed using secondary data from the INE and PORDATA. The indicators included were selected through a literature review, taking into account their relevance to tourism and the availability of information at the municipal level.
In 2020, the results obtained suggest that the level of attractiveness of the municipalities varies between 0.894% (Corvo municipality) and 48.216% (Lisboa municipality), with an average attractiveness of 4.269%. The results reflect an asymmetrical distribution of the tourist offer, activities and facilities, with a very small number of municipalities concentrating quite high levels of tourist attractiveness and the majority showing significantly lower levels.
As can be seen from Table 1 and Figure 1, the 10 municipalities with the best levels of tourist attractiveness, both due to their tourist offer and the availability of assets and environmental awareness, were Lisboa, Porto, Coimbra, Évora, Sintra, Funchal, Setúbal, Cascais, Almada and Santarém. These municipalities are well above the population average (μ > 4.269%) and are mainly located in the Lisboa area, which reflects a strong concentration of tourism assets, infrastructures, accessibility and local tourism enhancement policies.
Conversely, the results show that the 10 municipalities with the lowest levels of attractiveness are Santa Cruz Graciosa, Machico, Povoação, Castanheira de Pêra, Santana, Lagoa, Lajes das Flores, Corvo, Ribeira Brava and Nordeste, which are below the population average (μ < 4.269%) and have a lower tourism offer, notoriety, population density, cultural, environmental and heritage facilities and a municipal policy of low tourism value.
In 2021, the data suggests that the level at which municipalities attract tourists varies between 0.892% (municipality of Nordeste) and 48.039% (municipality of Lisboa), with an average attractiveness of 4.494%. The estimated levels thus reflect an asymmetrical distribution of the tourist offer throughout the territory. This means that there is a high concentration in a very small number of municipalities of tourism assets, available infrastructures and accessibility, and municipal policies for tourism development. On the other hand, the majority of municipalities have significantly low levels of tourist attractiveness.
By reading Table 2 and Figure 1, it is possible to analyse the 10 municipalities with the best levels of tourist attractiveness, as they provide the best range of tourism assets, equipment, access and environmental awareness: Lisboa, Porto, Coimbra, Évora, Sintra, Funchal, Almada, Cascais, Setúbal and Vila Nova de Gaia. These municipalities are well above the population average (μ > 4.494%) and are particularly located in the Lisboa metropolitan area, which reflects a strong concentration of the available tourist offer.
Conversely, the 10 municipalities with the lowest levels of tourism offer are Vila Nova da Barquinha, Valpaços, Arruda dos Vinhos, Murtosa, Santa Cruz da Graciosa, Vila Franca do Campo, Ribeira Brava, Castanheira de Pêra, Corvo and Nordeste. These, in turn, are situated below the population average (μ < 4.494%), and have a lower tourism offer, renown, population density, cultural, environmental and heritage assets and policies of reduced valorisation.
In 2022, the results suggest a level of tourist attractiveness that varies between 1.675% (municipality of Nordeste) and 52.354% (municipality of Lisboa), for an average national attractiveness of 4.975%. The figures reflect an asymmetrical distribution of the tourist offer. As can be seen, the data shows a high concentration of tourism in a very small number of municipalities. Due to the limited supply of tourism assets, infrastructure and accessibility, most municipalities have relatively low levels of attractiveness.
According to the data (Table 3 and Figure 1), the 10 municipalities with the best levels of tourism offer were Lisboa, Porto, Coimbra, Sintra, Almada, Évora, Funchal, Lagoa, Vila Nova de Gaia and Aveiro, as they have the best tourism offer and are well above the population average (μ > 4.975%). These municipalities are located in the Lisboa metropolitan area and reflect a strong concentration of the available tourist offer.
On the other hand, the 10 municipalities with the lowest levels of tourism offer are Vila Nova de Poiares, Carregal do Sal, Paços de Ferreira, Lajes das Flores, Vila Nova da Barquinha, Santa Cruz da Graciosa, Arruda dos Vinhos, Corvo, Ribeira Brava and Nordeste. These municipalities are situated below the population average (μ < 4.975%) and have, in comparison to the others, a lower tourism offer, relevance in the sector, heritage and cultural assets and local policies of low tourism appreciation.
In 2023, the estimated results suggest a level of tourist attractiveness that ranges between 1.131% (municipality of Corvo) and 62.615% (municipality of Lisboa), for an average national attractiveness of 5.280%. The figures reflect an asymmetrical distribution of the tourist offer. The results show a marked asymmetry in the distribution of the tourist offer, demonstrating a high concentration in a very small number of municipalities. The majority of municipalities have low levels of tourist attractiveness due to the lack of relevant tourist assets, adequate infrastructure and accessibility conditions that favour the development of the sector.
The data shows that the 10 municipalities with the best tourism offers are Lisboa, Porto, Coimbra, Sintra, Almada, Funchal, Vila Nova de Gaia, Ponta Delgada, Loulé and Cascais. This territorial concentration of tourist attractiveness demonstrates a marked spatial asymmetry, reflecting the high centralisation of tourist activity in a very small number of municipalities.
Conversely, according to the methodology, the 10 municipalities with the lowest levels of tourist attractiveness were Santa Cruz da Graciosa, Penalva do Castelo, Alpiarça, Vila Nova da Barquinha, Murtosa, Lajes das Flores, Santa Comba Dão, Salvaterra de Magos, Arruda dos Vinhos and Corvo (Table 4 and Figure 1). The municipalities are distributed below the population average (μ < 5.280%) and have, in comparison with the others, a lower tourism offer, relevance in the sector, heritage and cultural assets and local policies to increase tourism.
In 2024, the estimated results show that the 10 most attractive municipalities for tourists are Lisboa, Porto, Coimbra, Sintra, Almada, Funchal, Vila Nova de Gaia, Ponta Delgada, Loulé and Cascais. The municipalities are above the population average (μ > 5.334%), and the situation shows the existence of high levels of tourist attractiveness, an effect of the availability of tourist facilities, infrastructures and accessibility. These inequalities between municipalities pose a challenge for the planning and balanced development of the tourism sector at the national level (Table 5 and Figure 1).
Conversely, the 10 least attractive municipalities for tourism were Santa Cruz da Graciosa, Penalva do Castelo, Alpiarça, Vila Nova da Barquinha, Murtosa, Lajes das Flores, Santa Comba Dão, Salvaterra de Magos, Arruda dos Vinhos and Corvo. These municipalities are below the population average (μ < 5.334%) and have a lower tourism offer and availability.
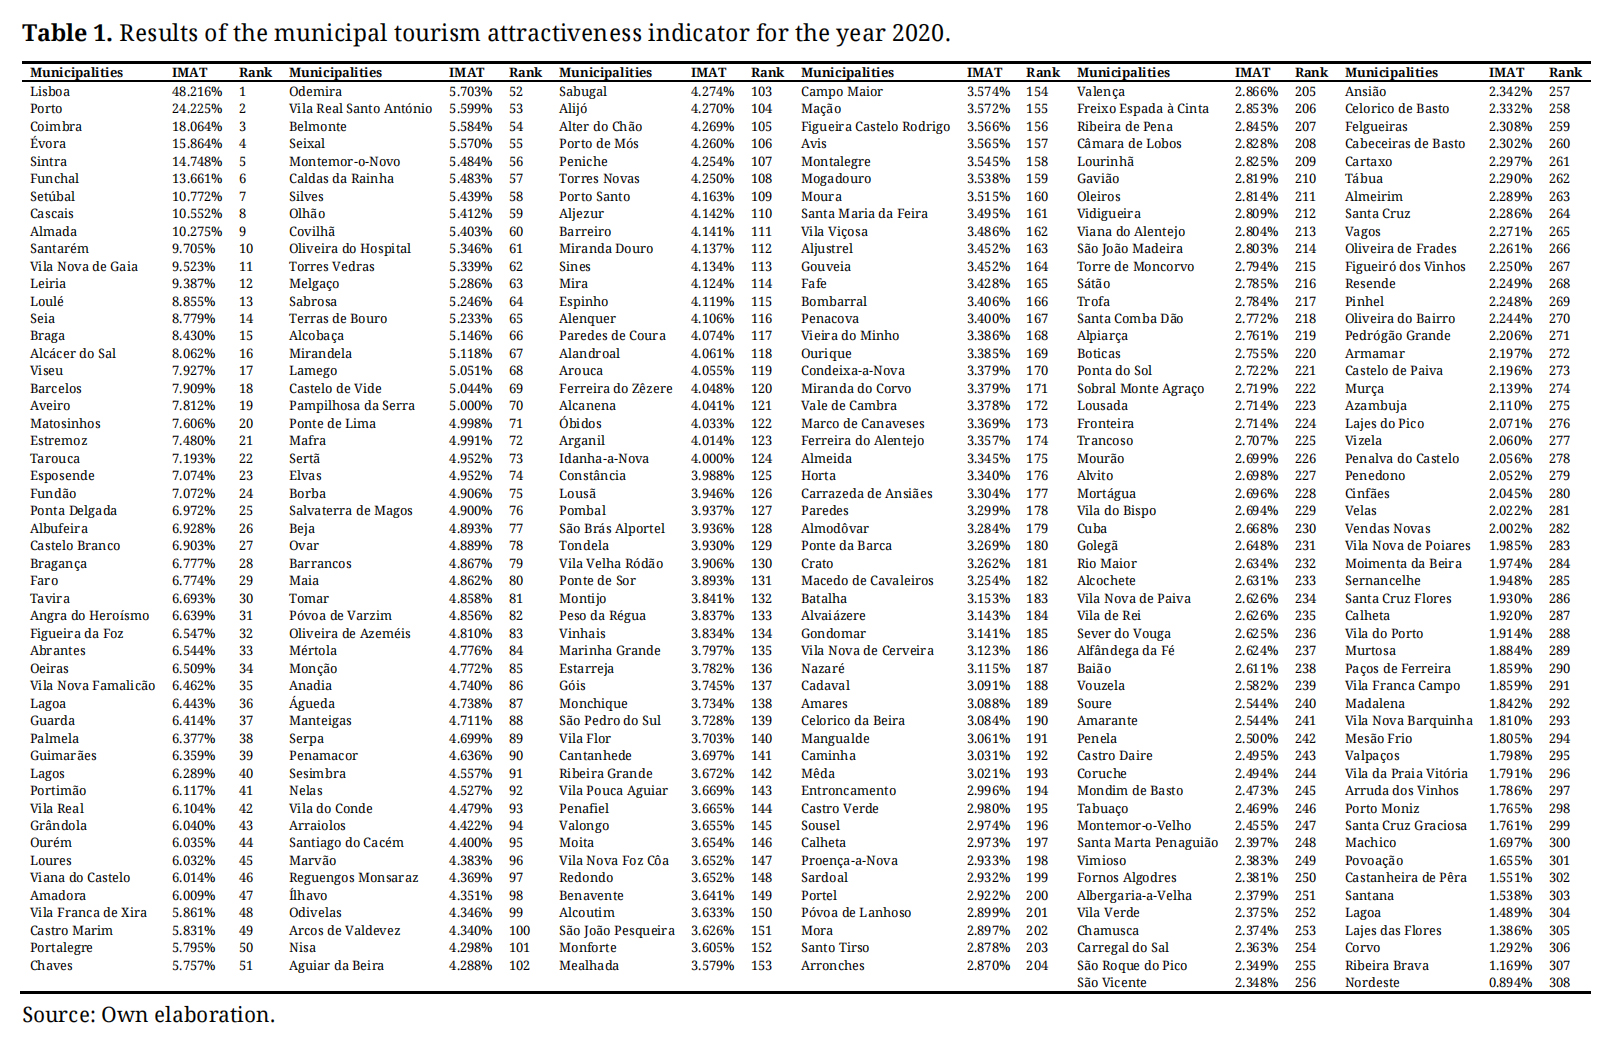 Table 1. Results of the municipal tourism attractiveness indicator for the year 2020.
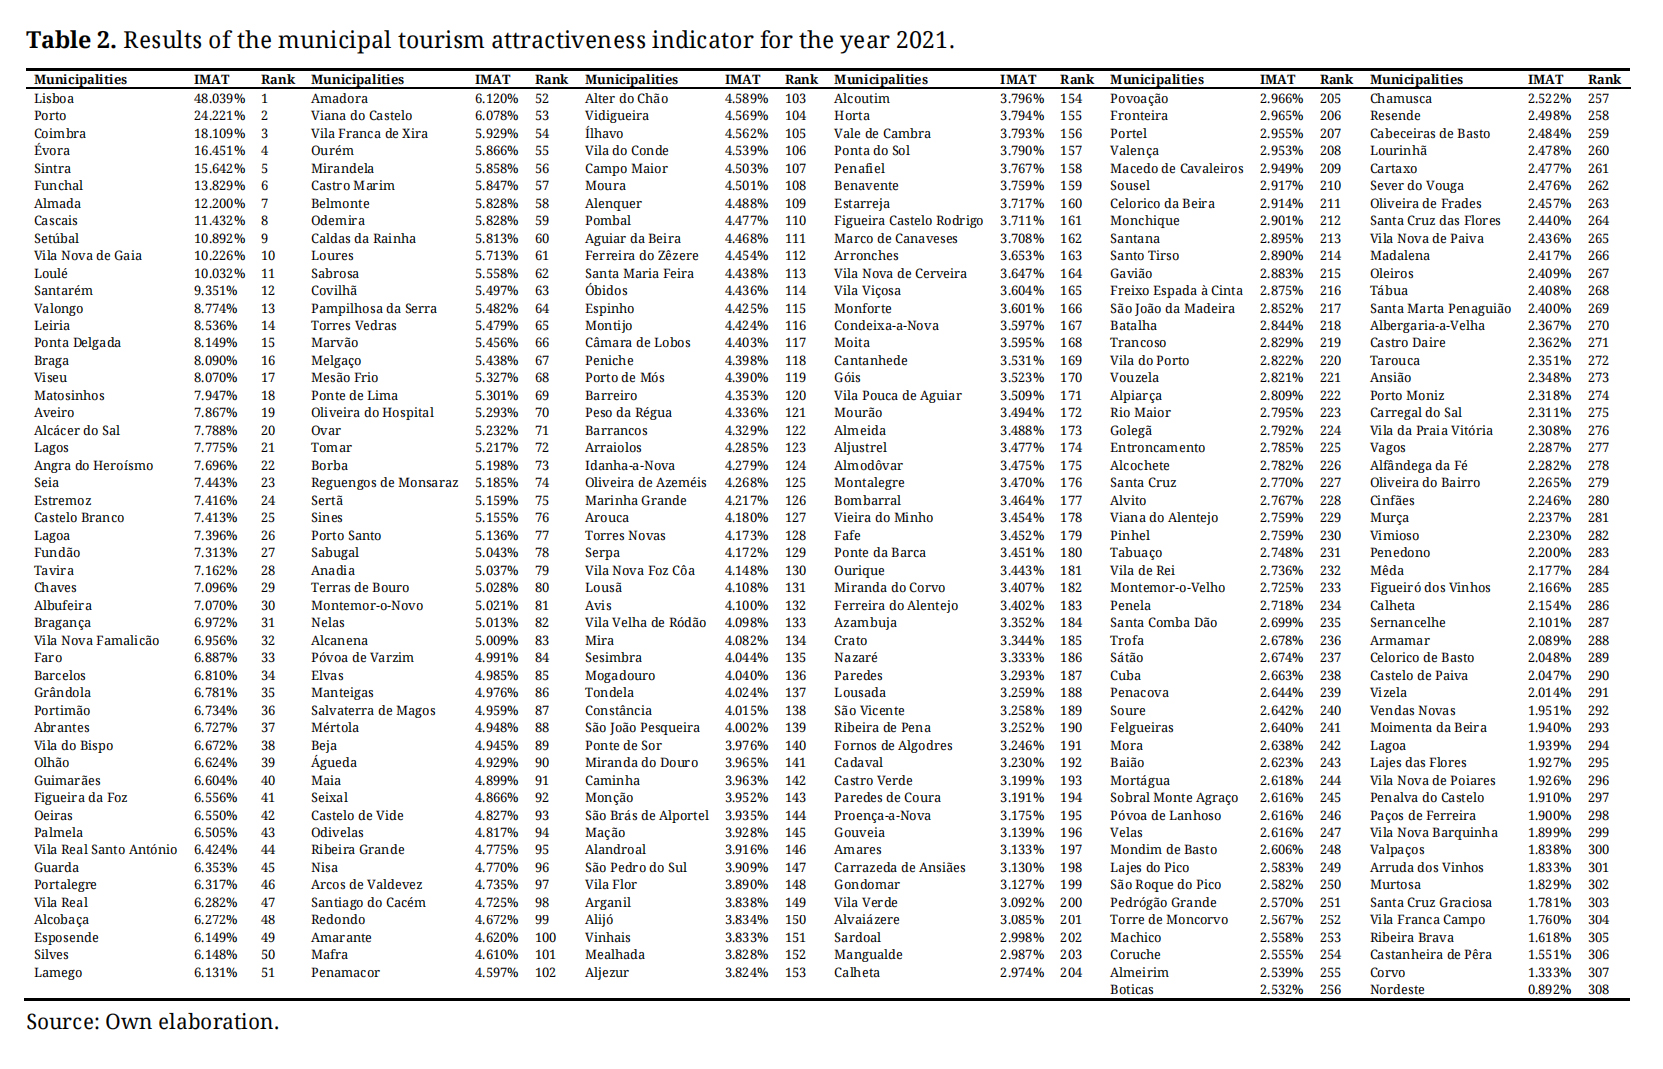 Table 2. Results of the municipal tourism attractiveness indicator for the year 2021.
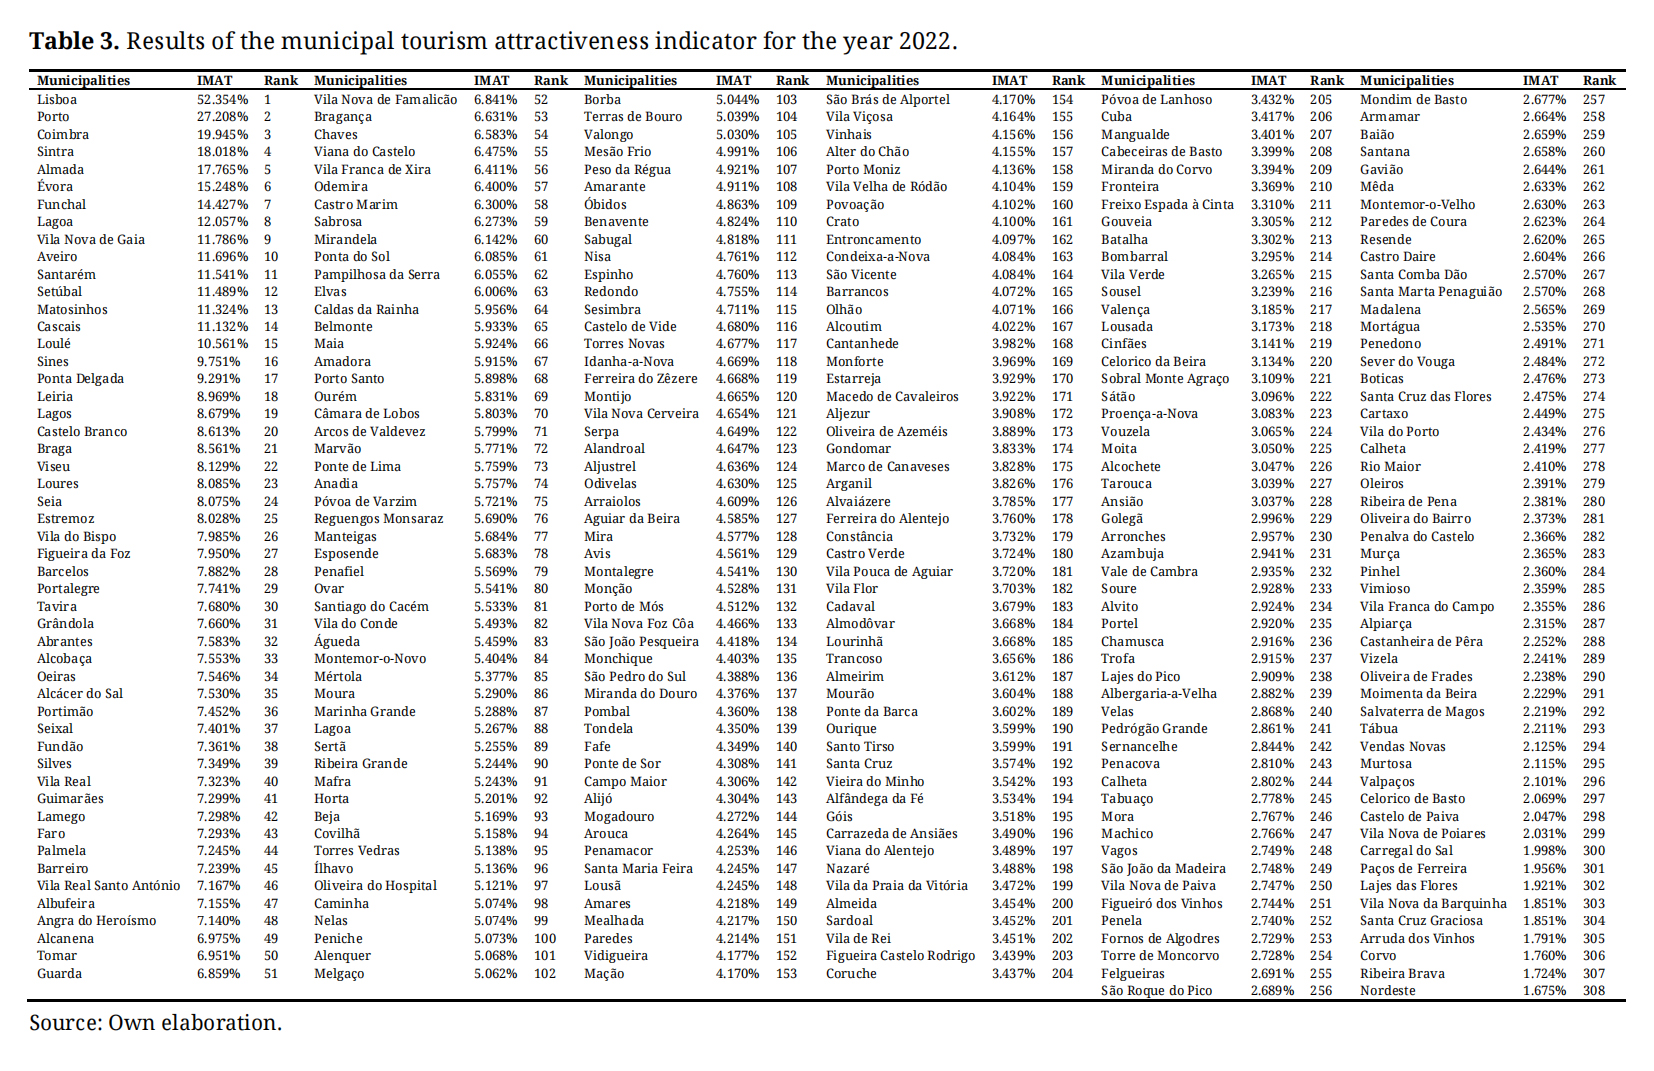 Table 3. Results of the municipal tourism attractiveness indicator for the year 2022.
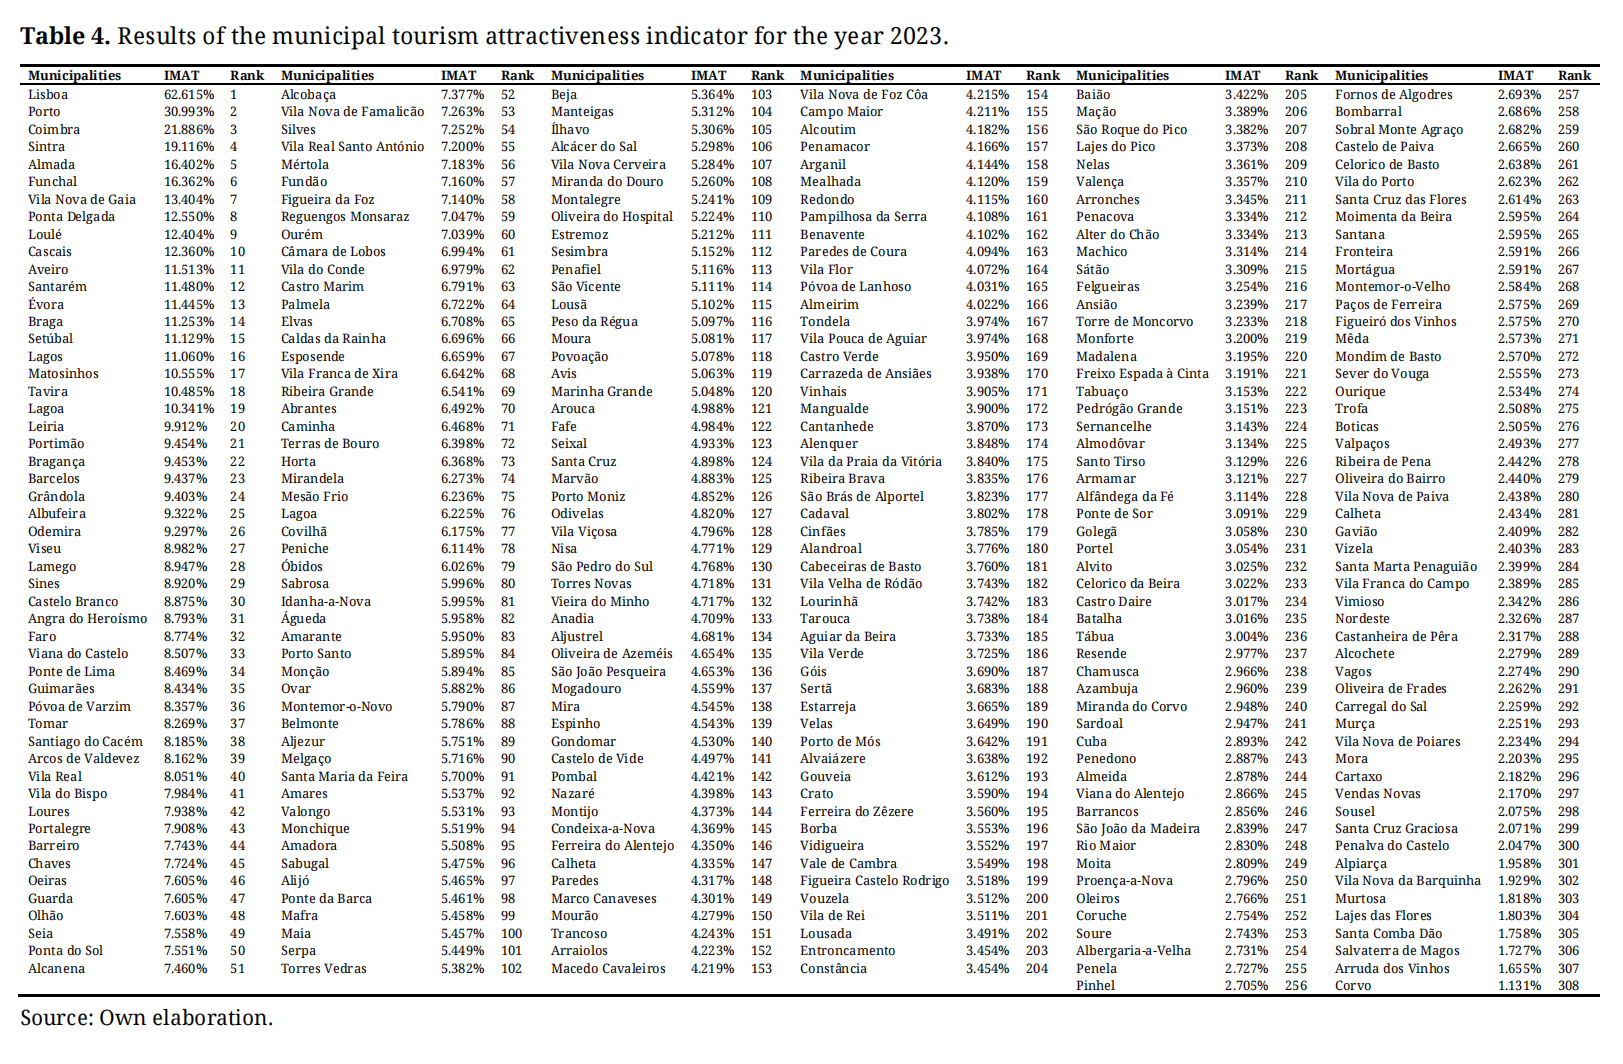 Table 4. Results of the municipal tourism attractiveness indicator for the year 2023.
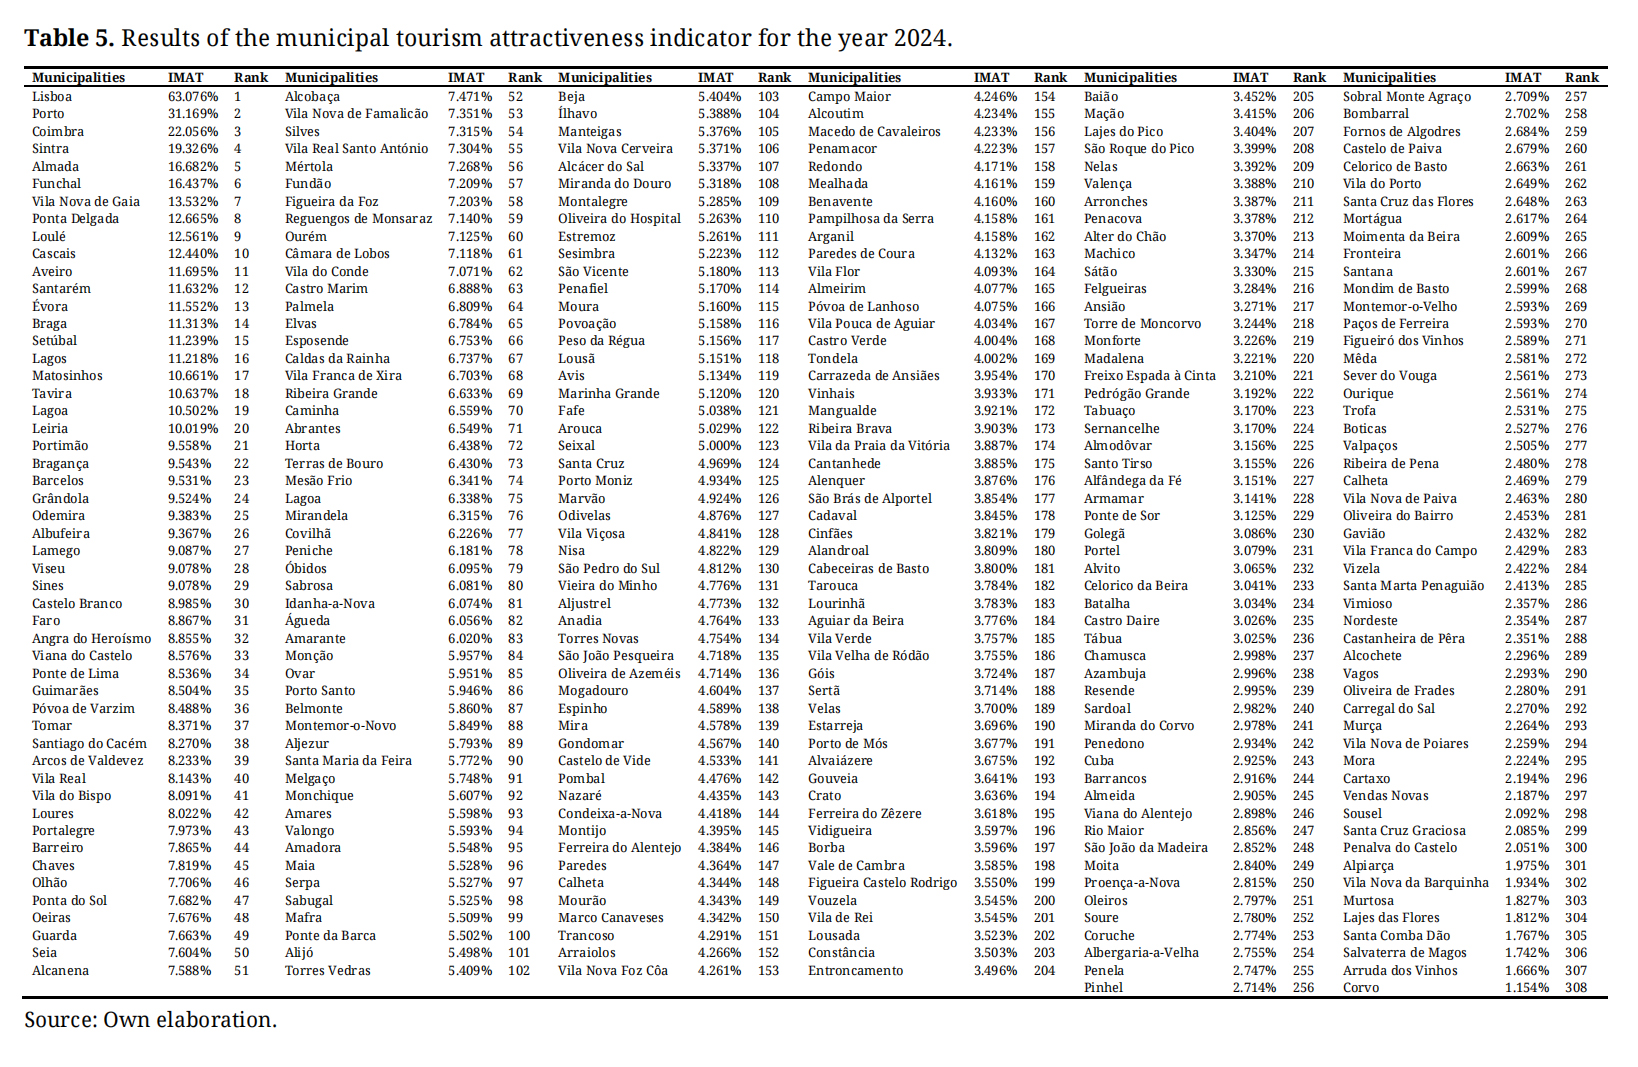 Table 5. Results of the municipal tourism attractiveness indicator for the year 2024.
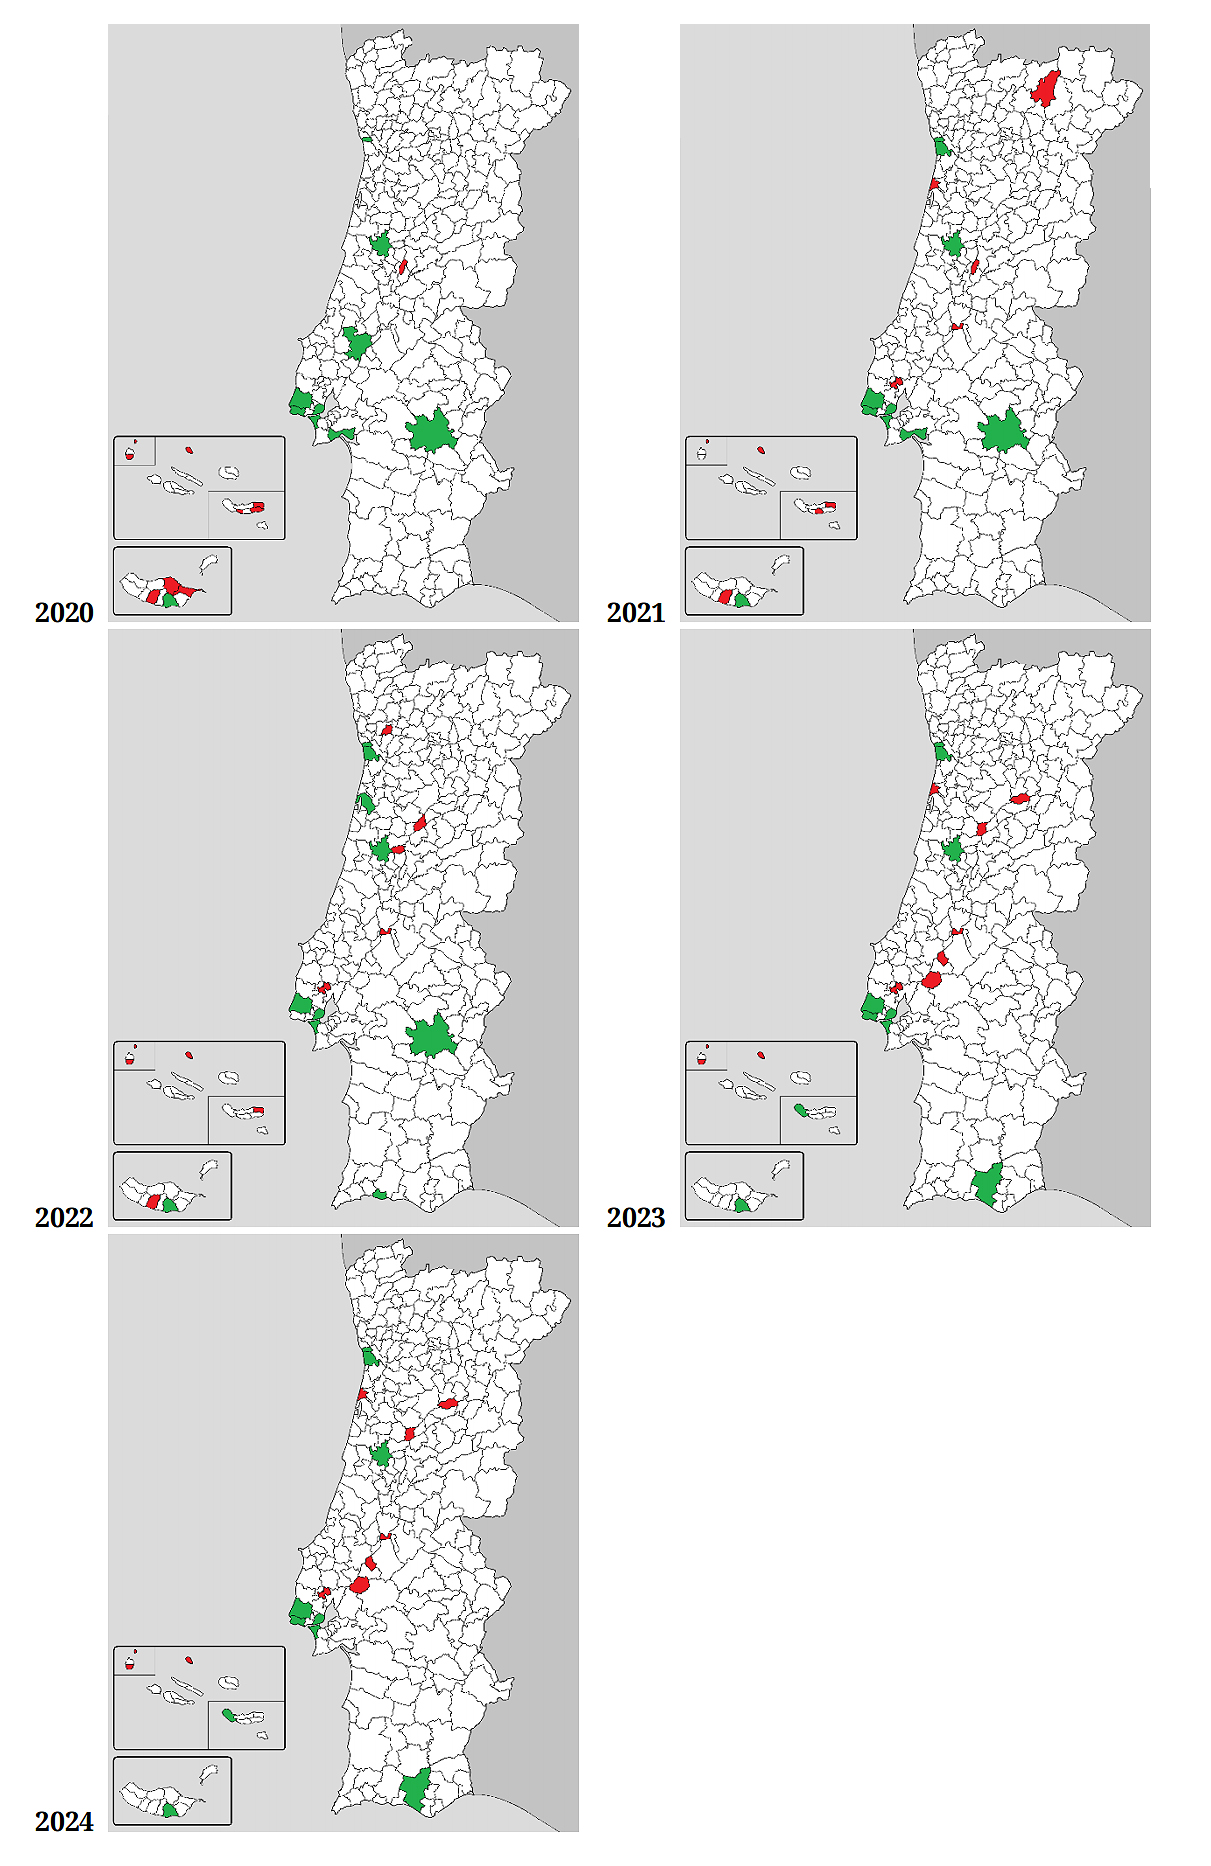 Figure 1. The 10 municipalities with the best (green) and lowest (red) levels of tourist attractiveness (2020–2024); Source: Own elaboration.
In order to observe the robustness of the index and validate the results, a sensitivity analysis was performed with the aim of analysing the effects of changes in municipal choices of tourist offerings for the interval (0, 1), i.e., if a given city has an S > 0.5, its level of attractiveness is closer to that of the pivot municipality (the city with the highest level of attractiveness); conversely, if the city has an S < 0.5, its level of attractiveness is closer to that of the municipality with the lowest levels of tourist attractiveness.
The sensitivity analysis of the attractiveness index results for 2020, carried out for the interval (0, 1), suggests that there are significant differences in the levels of attractiveness of tourism offerings between Portuguese municipalities. The analysis confirms the municipality of Lisbon as the reference point (S = 1), which corroborates, for the national context, the city's dominant position in terms of relative attractiveness. At the opposite extreme, the municipality of Nordeste represents the point with the lowest level of relative attractiveness (S = 0) and assumes the lower limit position on the scale.
In the national context, it can be observed that most cities are below S = 0.2, such as Santarém (S = 0.18619), Vila Nova de Gaia (S = 0.18235) and Leiria (S = 0.17948), which fall within the range of municipalities with low relative attractiveness. The distribution suggests that as tourists move away from urban centres, the levels of attractiveness of the tourist offer decrease sharply (Table 6).
From the point of view of sensitivity analysis, it should be noted that small changes in attractiveness levels (pre-normalisation) can cause fluctuations in the relative positions of municipalities with very similar values, as can be seen between Setúbal (S = 0.20874) and Cascais (S = 0.20410) in relation to the transition from 2020 to 2021.
In 2020, the sensitivity analysis suggests a notable polarisation of the attractiveness of tourism in Portugal, concentrated especially in Lisbon, a second tier of municipalities with intermediate attractiveness (Porto, Coimbra, Évora and Sintra) and a large group of municipalities whose relative attractiveness is quite low (Figure 2).
For 2021, the sensitivity analysis for the interval (0, 1), carried out on all 308 Portuguese municipalities, shows that the municipality of Lisbon is the reference point (S = 1), while the municipality of Nordeste represents the city with the lowest levels of tourist supply (S = 0), assuming the lower limit of the distribution scale (Table 7).
The results show a strong territorial polarisation, with a very small group of municipalities having high levels of tourism supply while the majority have low levels. The municipality of Lisbon stands out as the benchmark (S = 0.10000), followed by the municipalities of Porto (S = 0.49481) and Coimbra (S = 0.36518). The results attest to the presence of decreasing levels of attractiveness, markedly asymmetrical, between the city of Lisbon and the other municipalities. Municipalities such as Évora (S = 0.33000), Sintra (S = 0.31286) and Funchal (S = 0.27439) consolidate important positions in 2021 but remain particularly distant from the municipality of Lisbon. Larger urban municipalities such as Almada (S = 0.23986), Cascais (S = 0.22355) and Setúbal (S = 0.21210) confirm and reinforce the doctrine's view of a high metropolitan concentration of levels of attractiveness of the tourist offer.
The vast majority of Portuguese municipalities have indices below S = 0.10, which reflects a reduced tourism offer when compared to the dominant urban centres. The pattern of tourism offers confirms the existence of high inter-municipal heterogeneity and a distribution of attractiveness characterised by high dispersion and positive asymmetry between municipalities (Figure 2).
With regard to sensitivity analysis, we highlight that municipalities with approximate values between the intervals (0.03 ≤ S ≤ 0.09) are those most exposed to marginal changes in ordering due to variations in municipal supply and choice (variations in index parameters). However, the structural hierarchy between Lisbon, the larger urban centres and the peripheral municipalities remains stable, suggesting the methodological robustness of the proposed approach.
In 2021, the distribution of results reveals a clear concentration of attractiveness in the municipality of Lisbon and in some urban centres, which contrasts with the situation in most municipalities (low tourist attractiveness). The results reinforce the notion of urban macrocephaly in Portugal and reveal the relevance of sensitivity analysis to validate the consistency and stability of the observed hierarchies.
With regard to 2022, the results of the sensitivity analysis achieved using the min–max normalisation method, between the interval (0, 1), suggest the municipality of Lisbon as the reference point (S = 1), while the municipality of Nordeste is the municipality with the lowest tourist offer available (S = 0), i.e., it corresponds to the lower end of the scale.
With regard to the distribution of levels of attractiveness of tourist offerings, the data reveal a distinct territorial asymmetry, with the municipality of Lisbon standing out in a dominant position and as a centre of gravity. In contrast, the municipalities of Porto (S = 0.50382) and Coimbra (S = 0.36050), although close in terms of the attractiveness of their tourist offer, remain notably distant from Lisbon's offer. This disparity reinforces the perspective of concentration of tourist attractiveness around the capital, with the other municipalities, even the larger ones, having levels of attractiveness below S = 0.50, which accentuates urban macrocephaly.
The distribution suggests the existence of a second line of urban centres consisting of the cities of Sintra (S = 0.32249), Almada (S = 0.31750), Évora (S = 0.26783) and Funchal (S = 0.25162), which play important roles in the tourist network but remain structurally distant from the reference municipality. Other municipalities, such as Vila Nova de Gaia, Aveiro, Setúbal and Braga, have tourism supply levels between (0.10 ≤ S ≤ 0.20), which translates into important sub-regional hubs, but whose performance still remains far from the levels observed in the city of Lisbon.
In the national context, the vast majority of municipalities have tourism attractiveness indices below S = 0.10, which reflects the low levels of tourism supply and attests to the existence of high inter-municipal heterogeneity. The results show that the distribution of supply is remarkably uneven and suggest that as potential tourists move away from large urban centres, the relative attractiveness of tourism supply decreases sharply (Figure 2).
From the point of view of sensitivity analysis, it should be noted that municipalities with similar values in small intervals (0.03 ≤ S ≤ 0.09) are particularly susceptible to marginal changes in standardisation parameters, which can cause fluctuations in relative ranking. However, the hierarchy of relative attractiveness levels, marked by the primacy of the city of Lisbon, followed by the main regional urban centres and the vast periphery of municipalities with low attractiveness, is stable, which attests to the methodological soundness of the approach.
The results for 2022 attest to the persistence of urban macrocephaly in Portugal, characterised by the centralisation of the attractiveness of the tourist offer in the capital and the presence of a considerable number of secondary hubs (Table 8).
From a methodological point of view, the sensitivity analysis confirms two key points: (i) the structural soundness of the urban hierarchy, since the municipalities of Lisbon, Porto and Coimbra retain their top positions, regardless of variations; and (ii) the competitive fragility of most cities, whose relative position changes little and remain largely distant from the major demographic and economic centres.
With reference to 2023, the sensitivity analysis suggests the persistence of an extensively hierarchical structure in the levels of attractiveness of the tourist offer available in Portuguese municipalities. As in previous periods, the city of Lisbon once again retains its position as the benchmark municipality (S = 1) and consolidates its position as the national benchmark, while the municipality of Corvo (S = 0) occupies the bottom position on the scale, representing the minimum limit of the index and reflecting the city with the lowest tourism offer (Table 9).
The municipality of Porto, after Lisbon, is the second most relevant urban area (S = 0.48569), despite the material difference in relation to the capital, not reaching half the levels of Lisbon's tourist offer. The municipalities of Coimbra (S = 0.33756), Sintra (S = 0.029252), Almada (S = 0.24836) and Funchal (S = 0.24773) are also important centres of tourist attraction but are clearly below the levels of the two main urban centres.
Among medium-sized municipalities, we highlight Vila Nova de Gaia (S = 0.19960), Ponta Delgada (S = 0.18573), Loulé (S = 0.18334) and Cascais (S = 0.18263), which consolidate the attractiveness levels of regional tourism. However, the sensitivity values of these municipalities remain far from the Lisbon-Porto core, attesting to the high concentration of attractiveness around the largest metropolitan areas.
The vast majority of Portuguese municipalities have indices below S = 0.10, which reveals the presence of reduced relative attractiveness and confirms a high spatial asymmetry in the national tourism offer. Municipalities such as Alcobaça, Vila Nova de Famalicão, Silves and Vila Real de Santo António are at the upper limit of the range (0.09 ≤ S ≤ 0.10), but the vast majority of territorial units, especially small and medium-sized ones, are below the range, which attests to the reduced competitive capacity of municipalities (Figure 2).
At the methodological level, the 2023 results suggest that small changes in the standardisation parameters may marginally alter the relative position of municipalities in the range (0.03 ≤ S ≤ 0.07).
However, in the national context, marked by the hegemony of the municipality of Lisbon, followed by Porto, and the existence of a vast set of regional hubs, the positions of tourism supply levels have remained stable, thus ensuring the validity of the analysis.
With regard to 2024, sensitivity analysis in the range (0, 1) suggests that the municipality of Lisbon is the pivotal municipality (S = 1), while the municipality of Corvo represents the municipality with the lowest tourism supply (S = 0) and, at the same time, represents the lower end of the scale.
The analysis of the interval (0 ≤ S ≤ 1) confirms the existence of serious disparities between the levels of attractiveness of the tourist offer among Portuguese municipalities and points to the city of Lisbon as the reference point, consolidating its hegemonic position over the other municipalities (Table 10). The municipality of Lisbon is the most attractive to tourists, as it also offers the widest range of tourist assets.
In terms of the distribution of the attractiveness of the offer, the results suggest the existence of a notable territorial asymmetry, with the city of Lisbon standing out as the dominant position and reference point. On the other hand, the municipalities of Porto (S = 0.48473) and Coimbra (S = 0.33756) are also very important urban centres, but they are still relatively far from the levels of tourist offer in the city of Lisbon. This disparity reinforces the view that Lisbon's tourist appeal is highly concentrated in comparison with other Portuguese municipalities. The data show that the other larger municipalities also have levels of tourist appeal below S = 0.50, which reflects a genuine urban macrocephaly.
In fact, the distribution for 2024 suggests the existence of a second tier of cities consisting of the municipalities of Sintra (S = 0.29347), Almada (S = 0.25077) and Funchal (S = 0.24682), which also play important roles in the local tourism sector but still remain considerably below the levels of the reference municipality. Other municipalities, such as Vila Nova de Gaia (S = 0.19990), Ponta Delgada (S = 0.18591), Loulé (S = 0.18423), Cascais (S = 0.18227) and Aveiro (S = 0.17024), have tourism supply levels in the range (0.10 ≤ S ≤ 0.20) and correspond to relevant regional hubs, but their performance still remains far from Lisbon's levels.
Most municipalities, in the national context, exhibit levels of attractiveness below S = 0.10, which reflects reduced levels of tourism asset availability and attests to the presence of high inter-municipal heterogeneity. In fact, the distribution of supply is uneven, and levels of disparity tend to increase as active demand tends to move away from large urban centres (Figure 2).
It is worth mentioning, in terms of sensitivity analysis, that municipalities with very similar levels, in the range (0.03 ≤ S ≤ 0.09), are susceptible to marginal fluctuations in relative ranking, resulting from small variations in supply parameters. However, the classification of relative attractiveness, marked by the primacy of Lisbon, followed by the main urban centres and the vast periphery of municipalities with low attractiveness, remains stable, which ensures the robustness of the model.
The 2024 data thus attest to the persistence of urban macrocephaly, marked by the centralisation of tourist attractiveness in the capital and a vast number of marginal hubs. From a methodological point of view, the analysis highlights two central points: (i) the solidity of the urban hierarchy, since the municipalities of Lisbon, Porto and Coimbra maintain their top positions, regardless of marginal variations; and (ii) the competitive fragility of the vast majority of municipalities, whose relative position is irrelevant, remaining largely distant from the major demographic and economic centres.
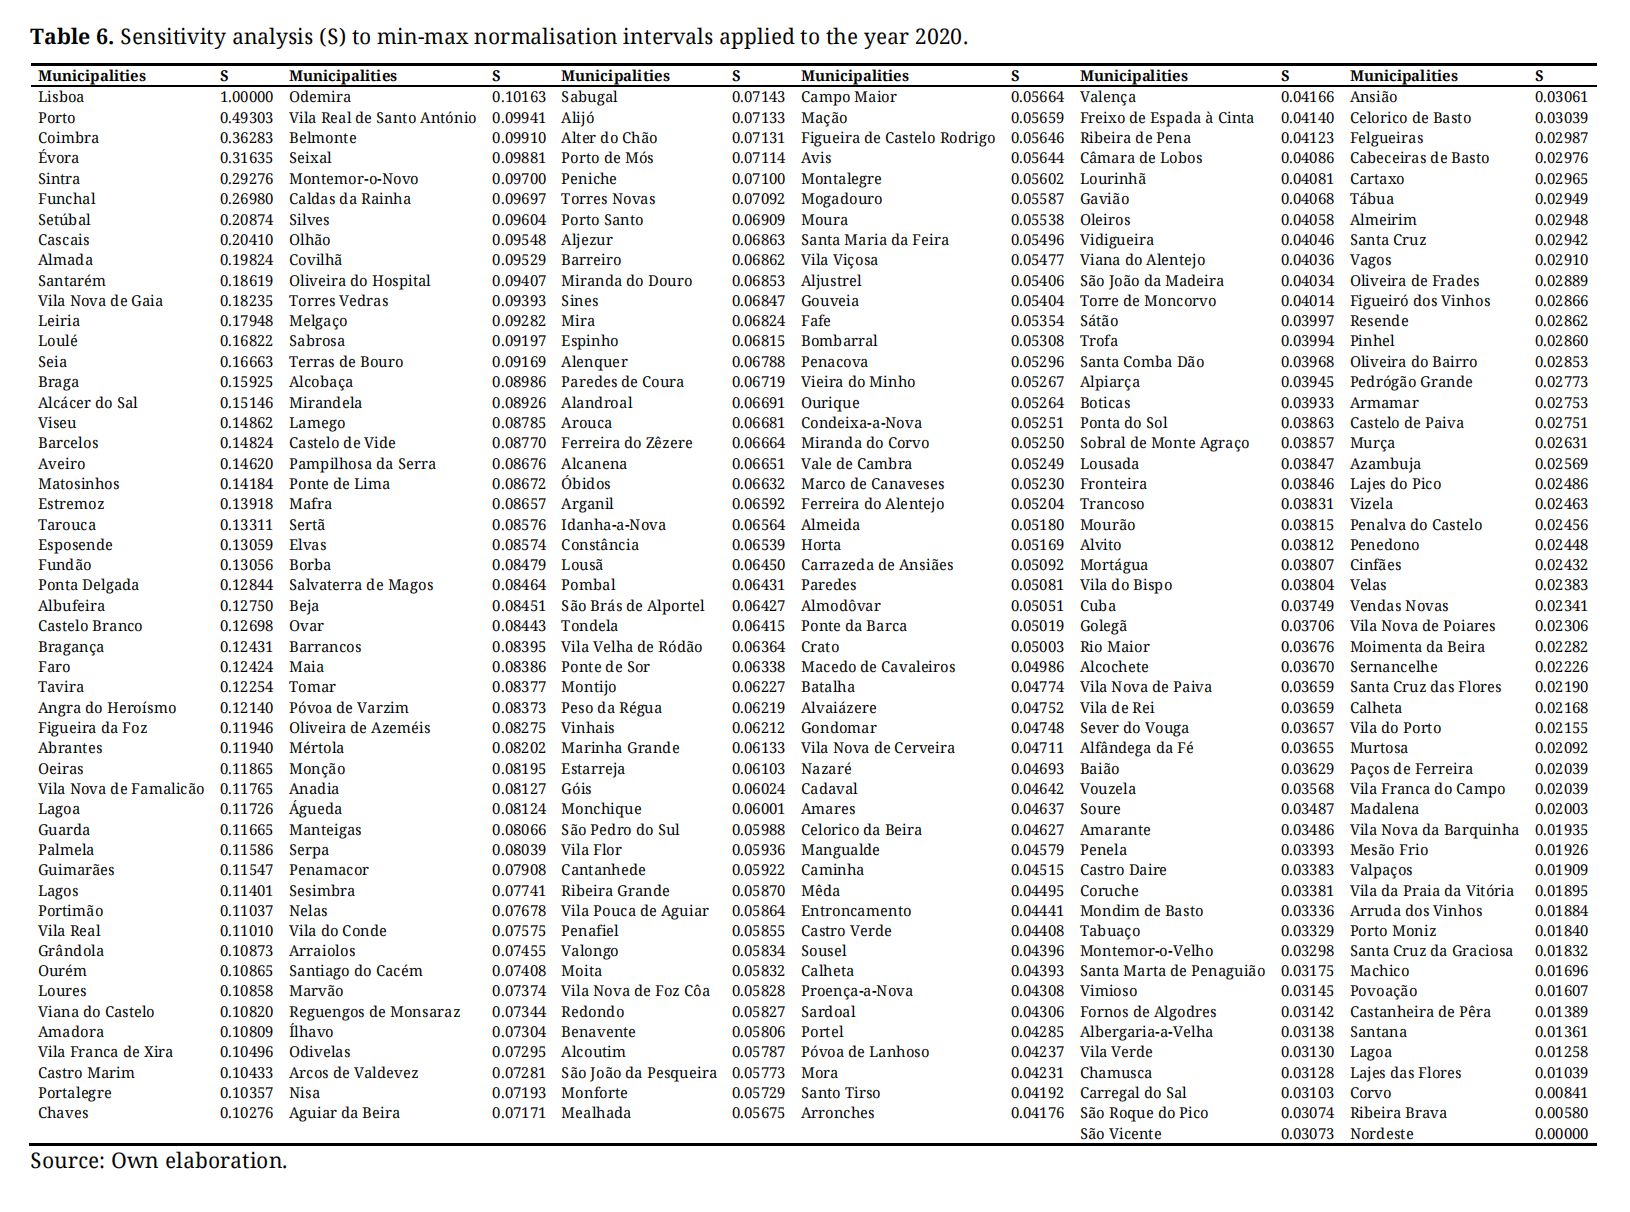 Table 6. Sensitivity analysis (S) to min-max normalisation intervals applied to the year 2020.
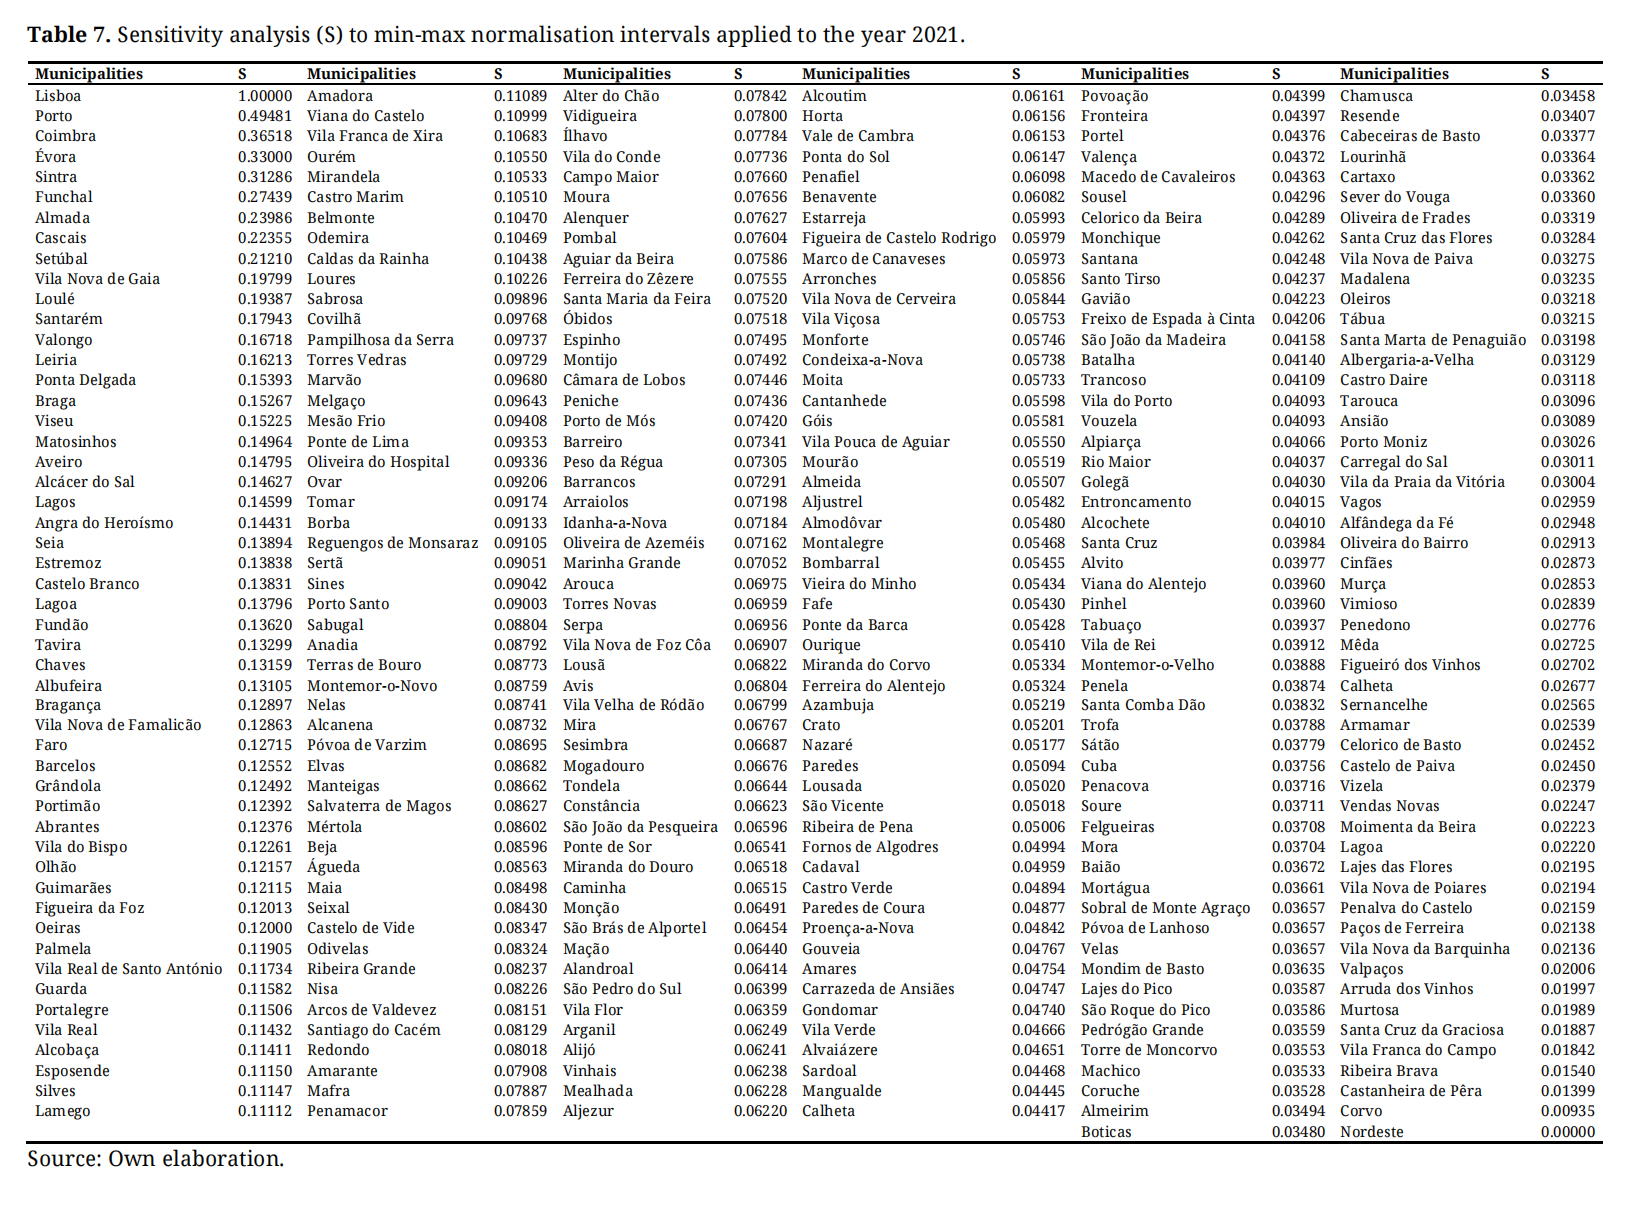 Table 7. Sensitivity analysis (S) to min-max normalisation intervals applied to the year 2021.
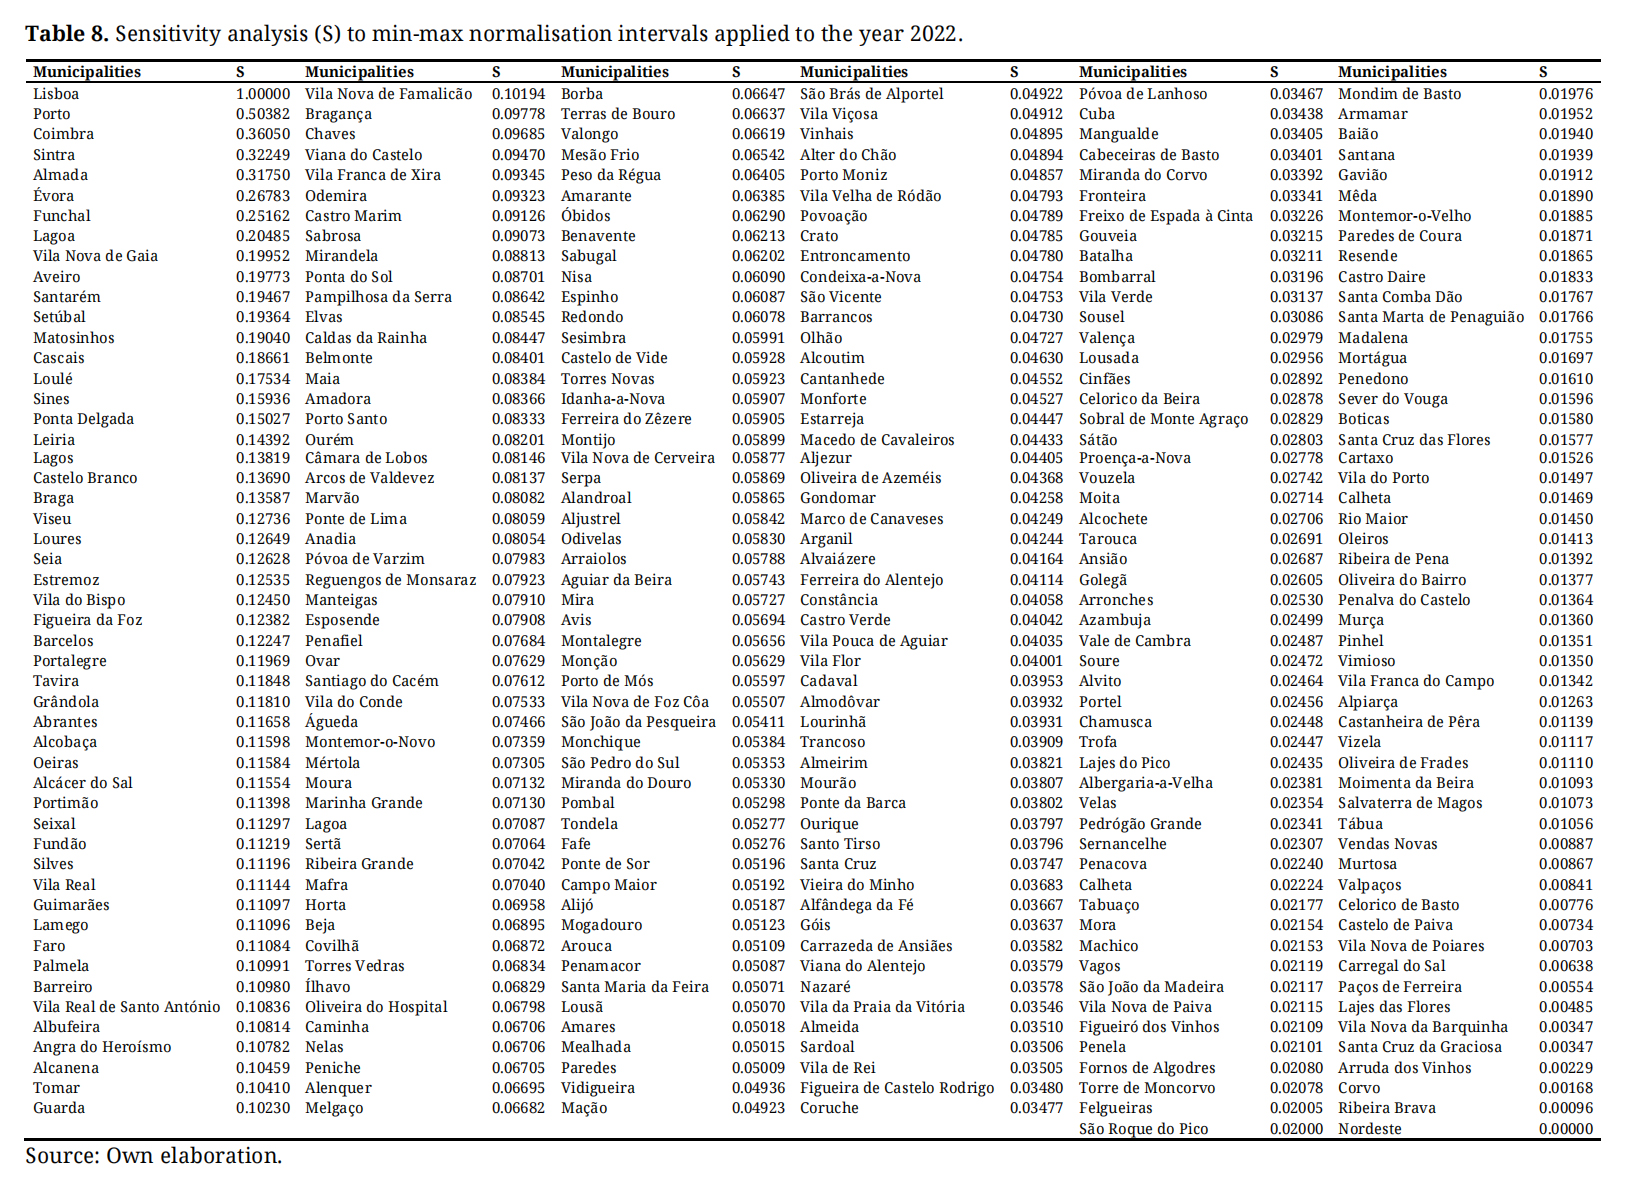 Table 8. Sensitivity analysis (S) to min-max normalisation intervals applied to the year 2022.
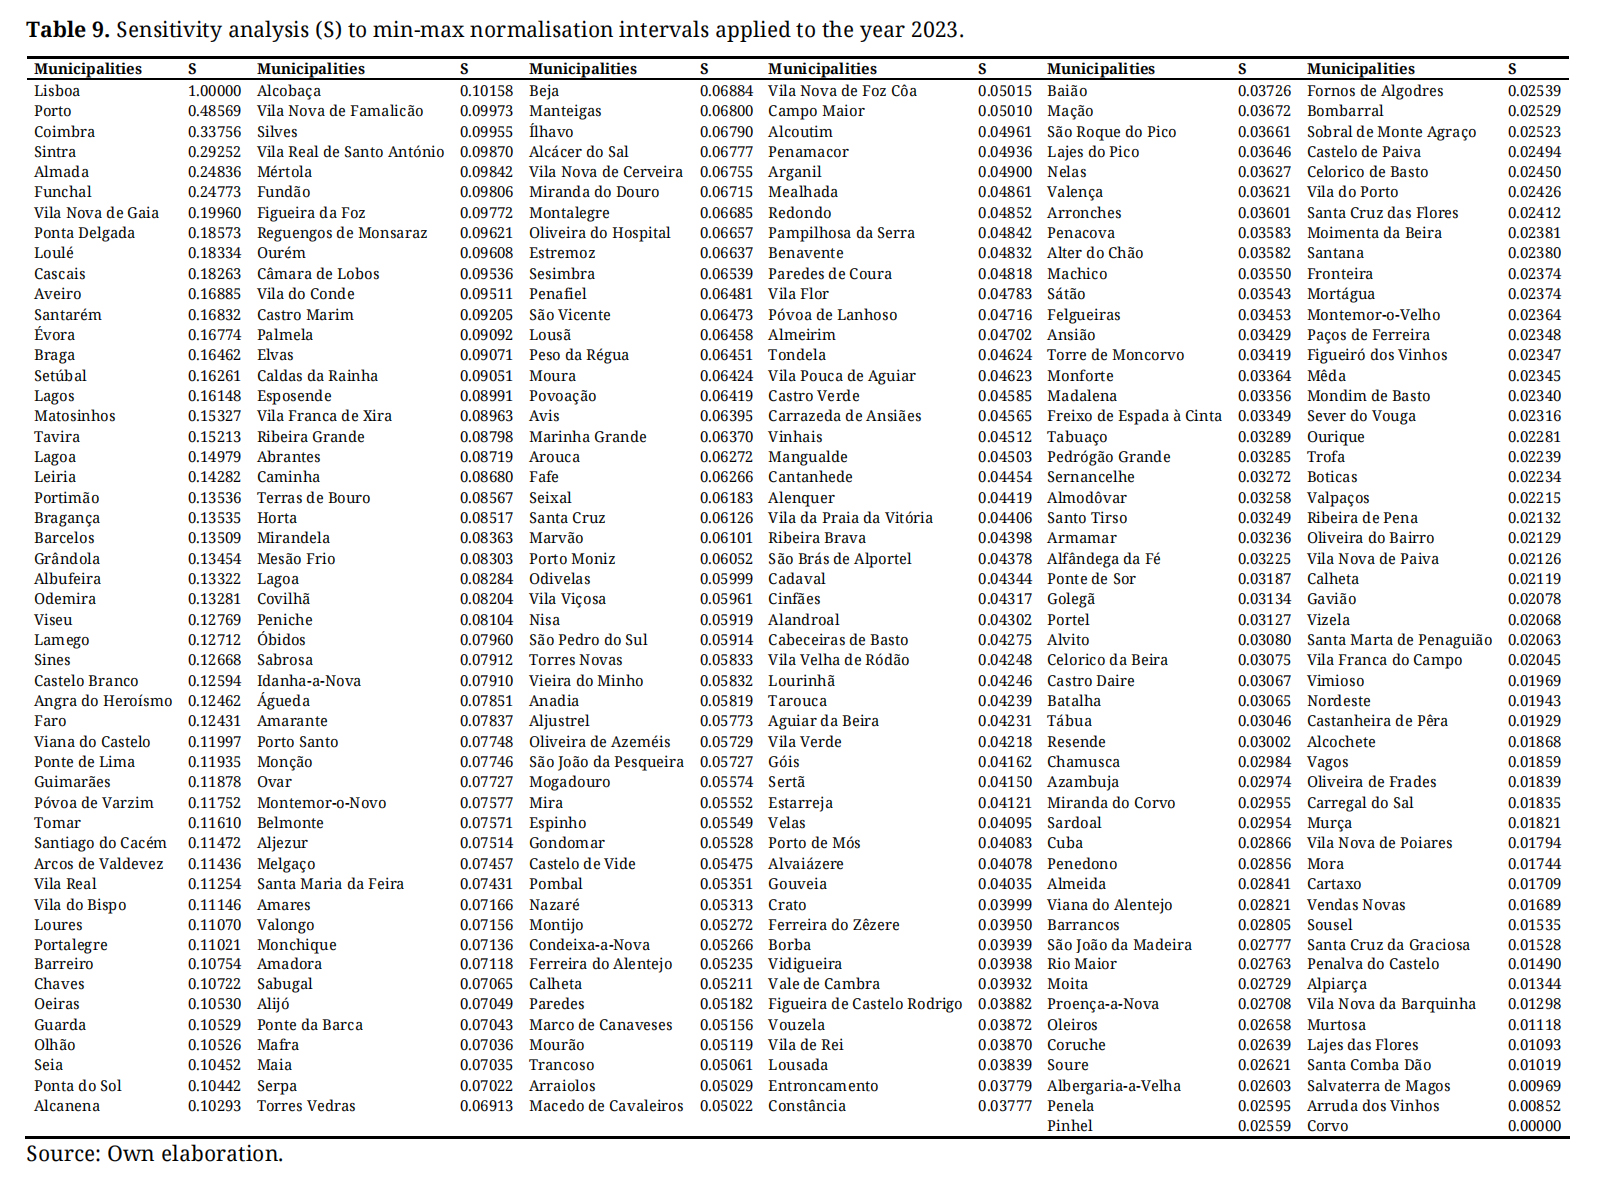 Table 9. Sensitivity analysis (S) to min-max normalisation intervals applied to the year 2023.
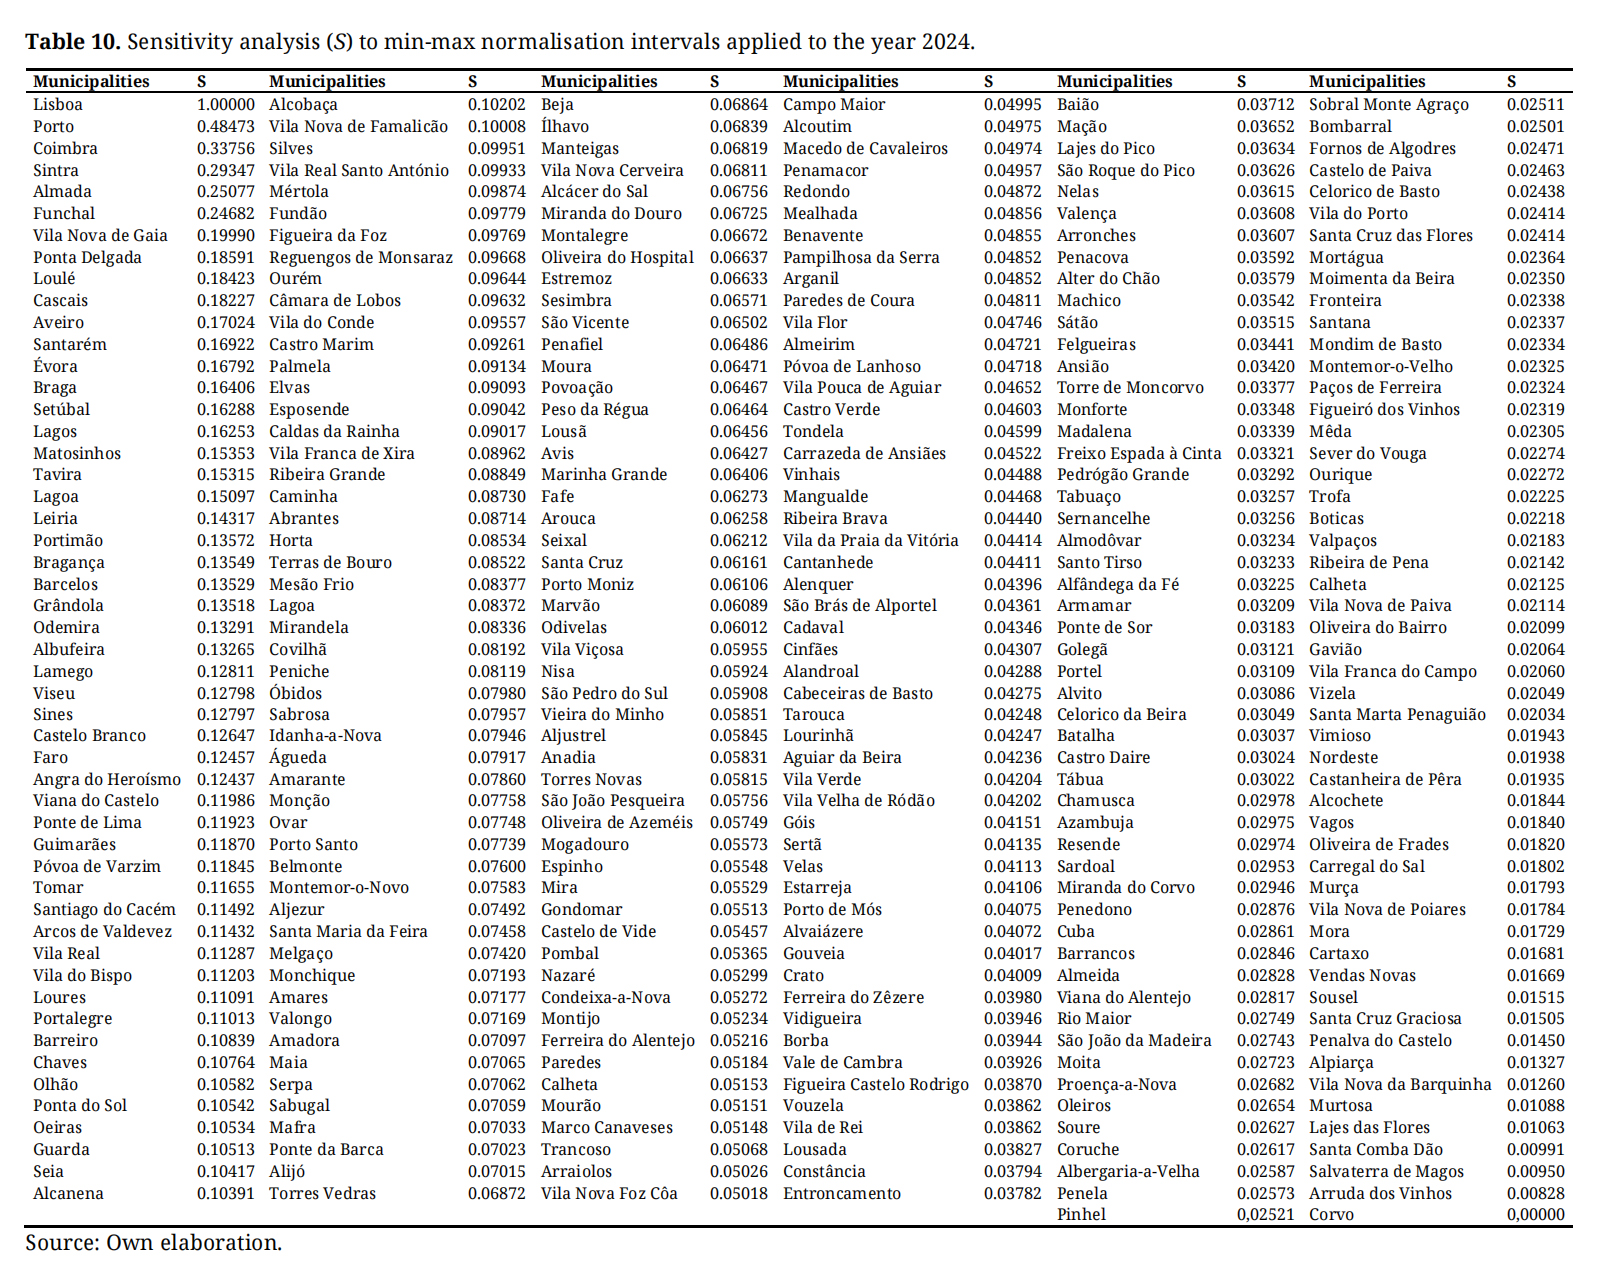 Table 10. Sensitivity analysis (S) to min-max normalisation intervals applied to the year 2024.
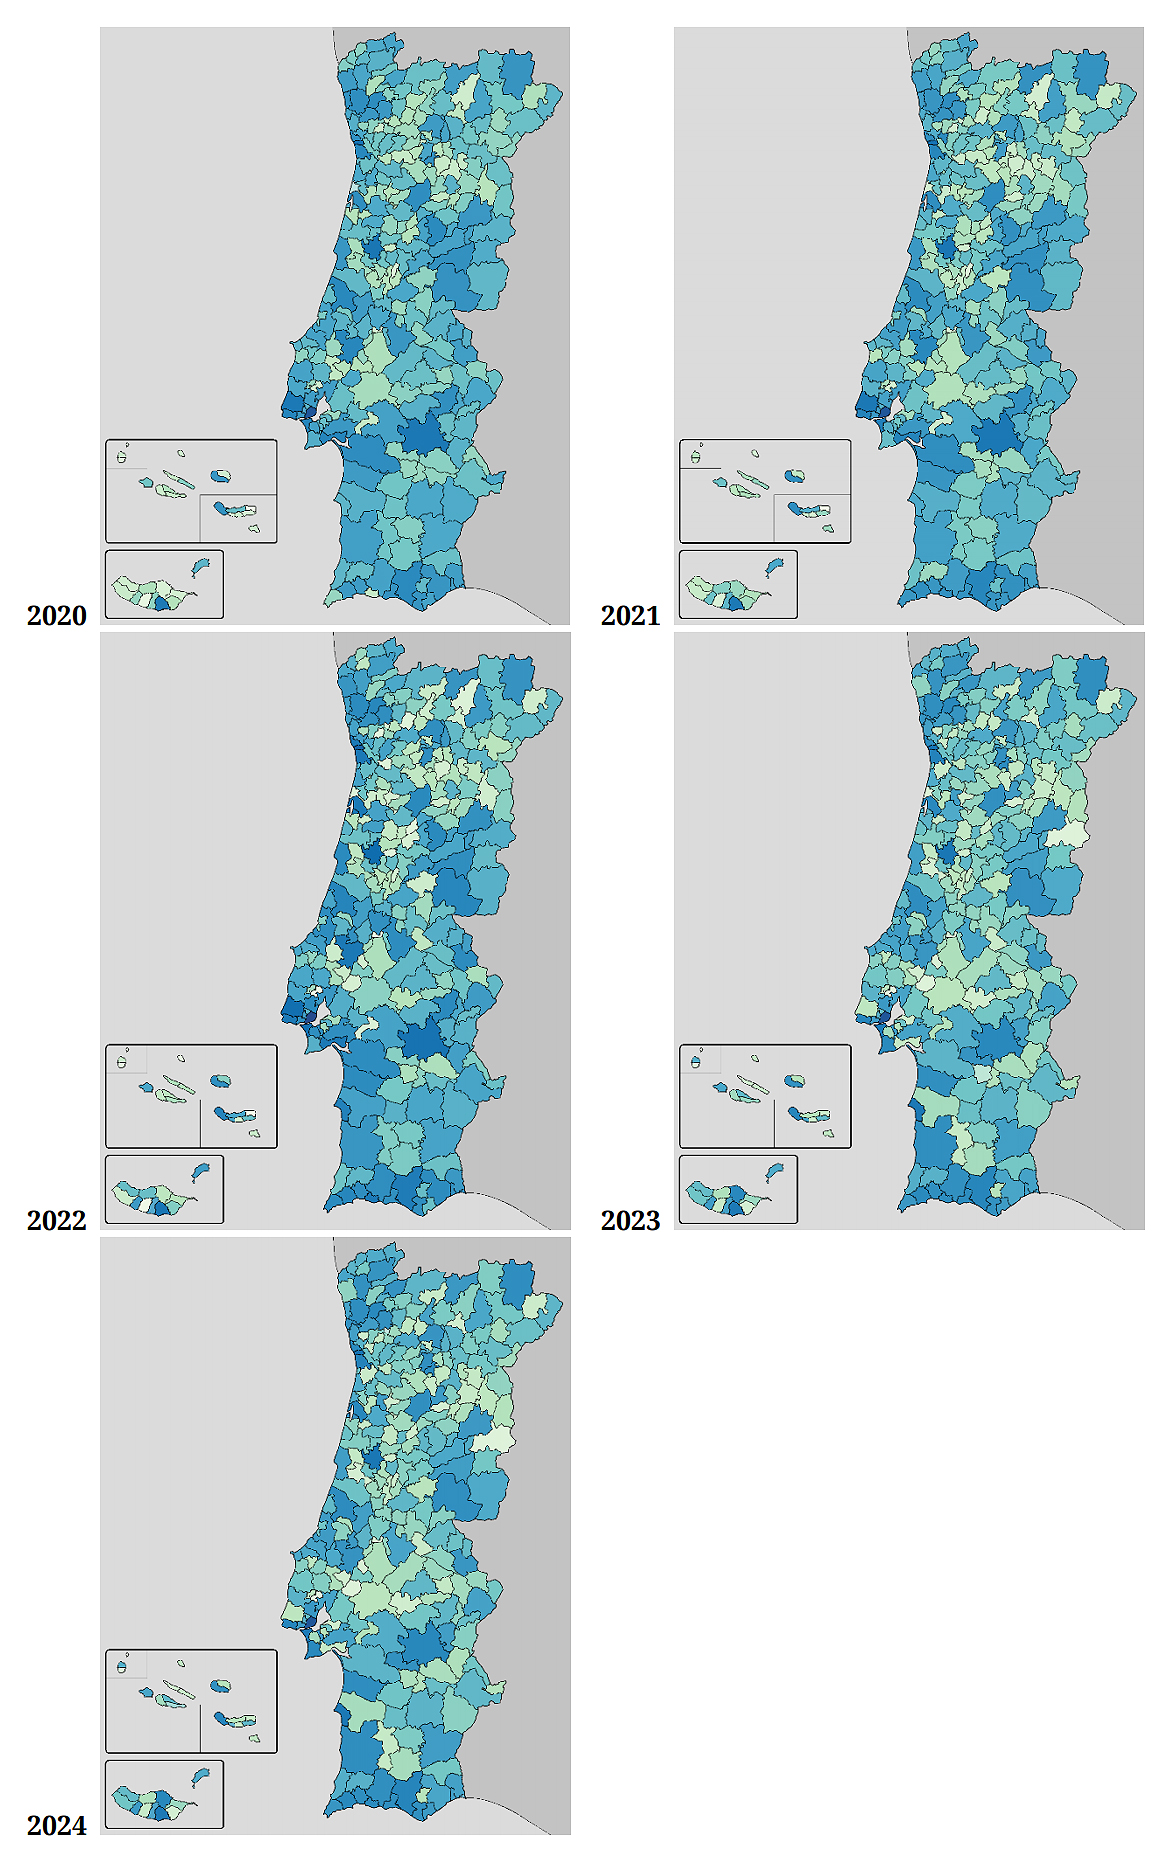 Figure 2. Choropleth maps of the levels of tourist attractiveness of Portuguese municipalities (2020–2024); Source: Own elaboration.
The data estimated using the tourist attractiveness index, applied to all Portuguese municipalities between 2020 and 2024, shows considerable territorial inequalities in terms of the ability to attract tourists. The discussion aims to critically interpret the results by relating them to existing literature and exploring the effects on territorial development, suggesting ways forward for the process of formulating public policies and research.
One of the most visible results concerns the concentration of tourist attractiveness in a restricted group of municipalities, namely Lisboa, Porto, Coimbra, Sintra, Almada, Funchal and Cascais. Throughout the five-year series, these municipalities have maintained their leading positions with values significantly above the national average. In contrast, a wide range of municipalities, especially smaller ones located in peripheral and island areas, have consistently shown low levels of attractiveness.
These results corroborate the doctrine that points to the strong centralisation of the tourist offer in large metropolitan areas [57,58]. The concentration of assets, infrastructures, accessibility, tourist services and institutional and environmental promotion in these urban centres develops a strategic advantage [59,60], which strengthens tourist attractiveness. In fact, tourism, as a geographically selective phenomenon, tends to produce territorial asymmetries [61,62]. On the other hand, the fact that the municipality of Lisboa solidly leads the ranking, with the indicator rising from 48.2% in 2020 to 63.1% in 2024, reinforces the prospect of tourist concentration in the major metropolitan centres [63,64]. As the data shows, the capital Lisboa is in fact a central point in the country's tourist network, as it benefits from heritage facilities, access, cultural and artistic services and marketing capacity [65,66].
The factors that explain levels of attractiveness vary between contexts, but the literature tends to emphasise the interaction between tourism assets (heritage, culture, nature), infrastructure, access, quality of services and municipal policies [14,67]. In the case of Portugal, the results suggest that municipalities with a higher level of attractiveness are also those that invest more in tourist facilities, have higher levels of population density and income and better access. On the other hand, the municipalities with the lowest rates, such as Corvo, Santa Cruz da Graciosa, Arruda dos Vinhos and Vila Nova da Barquinha, suffer from structural asymmetries, such as geographical isolation, low population density, a shortage of tourist assets and less notoriety. According to doctrine, these territories are classified as a paradox of unrealised tourism potential [68,69], in which the existence (or not) of a tourism offer does not necessarily translate into attractiveness or an effective tourist flow [70,71].
An essential element in understanding the disparity between municipalities is the role of public policies and local governance. Municipalities that have consistent strategies for valuing, promoting and developing the tourism sector tend to have better levels of attractiveness. In the Portuguese context, Lisboa, Porto and Sintra have organisational units dedicated to tourism management, public-private partnerships and, in some cases, help in developing consolidated territorial brands. Municipalities, on the other hand, often lack the technical and financial capacity to implement policies to attract and retain tourists [72,73].
The period under analysis covers the COVID-19 pandemic crisis, which, between 2020 and 2021, affected the tourism sector and forced the adoption of limitations on mobility, temporary closures of facilities and changes in tourist preferences. However, the results suggest that municipal attractiveness levels have remained relatively stable; even during the most critical years of the pandemic (Tables 1–5). The data attests to the theory that municipalities with consolidated tourism structures and national and international notoriety show greater levels of resilience [74,75]. In the case of the municipality of Lisboa, it can be seen that it has held on to the top spot in all the years analysed, even during periods of a sharp downturn in tourism, such as the pandemic. This resilience is in line with the literature. Studies show that municipalities with a more diversified tourism offer tend to recover more quickly from exogenous shocks [76,77].
Conversely, the results suggest that there has not been a significant increase in the attractiveness of rural and less densely populated municipalities. In fact, the results do not corroborate the view of Brouder [78] or Briedenhann and Wickens [79], who are apologists for the continuous and growing ‘ruralisation of tourism’. According to the doctrine, this is the result of a lack of facilities [80,81], marketing [82,83] and services linked to the tourism sector [84,85], which makes it impossible to attract, captivate and potentially interest a potential demand interested in less mass-market environments.
Over the five-year period, there is a gradual increase in the national average, from 4.269% in 2020 to 5.334% in 2024. This development suggests a strengthening of the tourism sector, probably related to the post-pandemic recovery, the improvement of the tourism offer and investment by municipalities and private agents in tourist destinations. However, the increase has not translated into a territorial redistribution of tourist attractiveness. The difference between the municipality with the highest level of attractiveness and the one with the lowest has increased significantly [86,87], signalling a possible increase in territorial inequalities [88,89].
While in 2020 the difference was 46.9 percentage points, in 2024 it reached 61.9 points. This pattern corroborates the perspective of some authors, who categorise the phenomenon as ‘polarised growth’, in which municipalities with a consolidated tourism offer tend to expand, while those on the periphery face stagnation [90,91].
The data points to the urgent need for a more balanced and territorially sensitive tourism policy. The excessive concentration of attractiveness in a few municipalities not only limits the development potential of other regions but also creates risks of overtourism [92,93] in destinations such as Lisboa, Porto and Sintra. The results point to the need to promote and implement strategies to deconcentrate tourism demand by investing in emerging destinations with high potential.
The diversification of the offer, the valorisation of heritage, ecotourism and rural and creative tourism are some of the possible ways of promoting a more equitable distribution of tourist flows [94,95]. To this end, greater institutional capacity building is needed in less attractive municipalities through the definition of municipal tourism plans and the creation of collaborative networks between territories. Tourism must be articulated with other sectors (agriculture, culture, and environment) in order to produce economies of scale effects. The concept of smart tourism destinations [96,97] also offers a promising approach by integrating technology, sustainability and social inclusion as pillars of territorial tourism development.
However, its limitations must be recognised. The construction of the index depends above all on the availability and quality of the statistical data available, which can limit the inclusion of relevant indicators [98,99]. The index focuses mainly on potential attractiveness but does not directly capture the number of visitors or their subjective perception of the tourist experience [100,101].
In future studies, we have also noted the relevance of analysing the fiscal effect on attractiveness [102,103], making comparisons with municipalities in other countries [104,105] or carrying out multivariate analyses to isolate the effects of different variables on attractiveness [106,107].
Analysing the index between 2020 and 2024 shows that tourism attractiveness in Portugal is excessively concentrated, reproducing historical patterns of centralisation in metropolitan areas. The most attractive municipalities are those with the highest levels of tourism offers, equipment, notoriety, access and active municipal policies, while the least attractive lack resources, recognition and promotion capacity.
In order to overcome inequalities and foster effective territorial cohesion in the tourism sector, it is crucial that public policies adopt an integrated and inclusive approach [108,109] that takes into account the specificities of the territories [110,111] and promotes the valorisation of local resources.
This research focuses on the existence of asymmetries in the attractiveness of tourism offerings in Portuguese municipalities. The results show a clear territorial asymmetry in the levels of tourist attractiveness of municipalities.
According to the data, the concentration of tourist attractiveness in the major urban centres is substantially higher than that observed in peripheral territories with low population density, which confirms the existence of persistent territorial inequality throughout the period from 2020 to 2024.
The municipalities of Lisboa, Porto and other urban centres stand out as the main centres of tourist attraction, maintaining a stable hierarchy that is unlikely to change significantly. This stability suggests that the tourist appeal of these areas stems from a structural concentration of tourist assets and services, which tends to reinforce dominant positions in the national tourism system. In contrast, mobility within the hierarchy is more visible among smaller municipalities, where small investments or fluctuations in supply can lead to more immediate changes in relative position. On the other hand, the peripheral and island regions continue to face serious structural and geographical challenges that limit their capacity for local tourism development, reflected in the low levels of attractiveness. The analysis also shows the resilience of municipalities with consolidated tourism structures, which, even in the face of the COVID-19 pandemic, maintained their relative position, indicating the existence of robust bases capable of mitigating the adverse effects of the economic and social context.
The results also point to the importance of local public policies, institutional capacity and municipal spending as determining factors in maintaining and increasing the tourist attractiveness of municipalities. Although it was possible to observe a positive trend in the national average attractiveness index, showing a slight strengthening of the country's tourist attractiveness, no empirical evidence was identified to support the existence of a significant decentralisation of tourism or the ruralisation of attractiveness.
In summary, the results emphasise the need to adopt and implement specific and distinct strategies that promote the inclusion of peripheral territories in tourism development and, at the same time, that are capable of consolidating the competitive advantages of large urban centres.
As far as future studies are concerned, they could explore in depth the institutional mechanisms and municipal public policies that intensify tourist attractiveness in order to produce the construction of a more balanced model for the tourism sector in Portugal.
The dataset of the study is available from the authors upon reasonable request.
Conceptualization, RdMeS and AMN; Methodology, RdMeS and AMN; Software, RdMeS; Validation, RdMeS, AMN, JRC, ACK and VM; Formal Analysis, RdMeS, AMN, JRC, ACK and VM; Investigation, RdMeS; Resources, RdMeS; Data Curation, RdMeS; Writing—Original Draft Preparation, RdMeS; Writing—Review & Editing, RdMeS, AMN, JRC, ACK and VM; Visualization, JRC, ACK and VM; Supervision, RdMeS; Project Administration, RdMeS and AMN.
The Authors Declare that they have no conflicts of interest.
1.
2.
3.
4.
5.
6.
7.
8.
9.
10.
11.
12.
13.
14.
15.
16.
17.
18.
19.
20.
21.
22.
23.
24.
25.
26.
27.
28.
29.
30.
31.
32.
33.
34.
35.
36.
37.
38.
39.
40.
41.
42.
43.
44.
45.
46.
47.
48.
49.
50.
51.
52.
53.
54.
55.
56.
57.
58.
59.
60.
61.
62.
63.
64.
65.
66.
67.
68.
69.
70.
71.
72.
73.
74.
75.
76.
77.
78.
79.
80.
81.
82.
83.
84.
85.
86.
87.
88.
89.
90.
91.
92.
93.
94.
95.
96.
97.
98.
99.
100.
101.
102.
103.
104.
105.
106.
107.
108.
109.
110.
111.
Moraes e Soares Rd, Nunes AM, Catarino JR, Kaizeler A, Martins V. An index of municipal tourist attractiveness: A possible methodological approach applied to Portugal. J Sustain Res. 2025;7(3):e250060. https://doi.org/10.20900/jsr20250060.

Copyright © Hapres Co., Ltd. Privacy Policy | Terms and Conditions


