Location: Home >> Detail
J Sustain Res. 2025;7(4):e250078. https://doi.org/10.20900/jsr20250078
 ,
Hitoshi Takehara 2,*
,
Hitoshi Takehara 2,*
1 Financial Research Department, NLI Research Institute, Tokyo 102-0073, Japan
2 Graduate School of Business and Finance, Waseda University, Tokyo 169-8050, Japan
* Correspondence: Hitoshi Takehara
This study examines the relationship between climate-oriented innovation and equity market valuation in Japanese manufacturing firms. In response to increasing regulatory and societal pressure to address climate change, manufacturing firms are expected to invest in technologies that advance environmental sustainability. To evaluate firm-level green innovation, we construct a Green Transformation Score (GXS) using a proprietary scoring method. Using panel data on publicly listed manufacturing firms in Japan, we find that a higher GXS is associated with a statistically significant decline in both stock market valuation and accounting profitability. In contrast, a higher Non-Green Transformation Score (NGXS) is positively associated with stock prices and profitability. These findings suggest that investors may place greater emphasis on the broader technological transformation captured by NGXS than on its environmentally focused counterpart. However, further analysis reveals that in several manufacturing industries, GXS has a positive and significant effect on equity value, attributable to its risk-mitigation mechanisms.
In response to intensifying global demands for climate accountability, the Japanese government and its financial regulatory institutions have undertaken a series of reforms aimed at enhancing transparency and mitigating greenhouse gas (GHG) emissions among publicly listed firms. These reforms reflect a convergence of statutory mandates, market-based governance mechanisms, and international disclosure standards, with implications for firm-level valuation, risk assessment, and capital market efficiency.
At the regulatory level, the Financial Services Agency (FSA) has initiated the integration of climate-related disclosure requirements into Japan’s statutory reporting framework. In July 2025, the FSA’s Working Group on the Disclosure and Assurance of Sustainability-related Financial Information released a formal roadmap for adopting the Sustainability Standards Board of Japan (SSBJ) climate disclosure standards, which are aligned with the International Sustainability Standards Board (ISSB) framework. These standards mandate firm-level reporting across governance, strategy, risk management, and quantitative metrics. They will be phased into statutory filings under the Financial Instruments and Exchange Act (FIEA) beginning in fiscal year 2026. Full compliance will be required by 2027 for firms listed on the Prime Market segment of the Tokyo Stock Exchange (TSE), operated under the Japan Exchange Group (JPX).
In parallel, the TSE has revised its Corporate Governance Code to encourage listed firms to address climate-related risks and opportunities explicitly. Although the Code operates on a comply-or-explain basis, it urges Prime Market firms to adopt disclosure practices consistent with the Task Force on Climate-related Financial Disclosures (TCFD) or equivalent frameworks. These revisions are complemented by JPX-led initiatives, including the establishment of the ESG Knowledge Hub and the publication of technical guidance materials aimed at enhancing disclosure quality and comparability across firms.
Beyond disclosure, Japan’s Green Transformation (GX) legislation introduces a mandatory emissions trading scheme scheduled to commence in 2026. Firms emitting over 100,000 tons of CO2 annually will be subject to direct regulatory pricing of carbon emissions, thereby internalizing environmental externalities into corporate cost structures. This development marks a shift from voluntary reporting toward enforceable decarbonization commitments, with potential implications for firm-level investment, innovation, and asset pricing.
Collectively, these institutional changes signal a structural reorientation of Japan’s financial and corporate governance architecture toward climate-conscious capital allocation. For empirical researchers, the evolving regulatory landscape presents a natural experiment to examine how firms adjust their disclosure behavior, investment policies, and risk exposure in response to climate-related mandates. It also raises broader questions about the informational efficiency of capital markets in pricing environmental liabilities and the extent to which regulatory interventions shape firm-level incentives for decarbonization.
The recent expansion of climate-related disclosure mandates in Japan, driven by statutory reforms, revisions to the governance code, and the introduction of emissions pricing, has significantly altered the strategic environment in which listed firms operate. For manufacturing firms in particular, which face disproportionately high exposure to carbon-intensive production processes, regulatory pressure has intensified the need to develop credible decarbonization strategies. Within this context, green innovation, proxied by the development and acquisition of environmentally oriented patents, has emerged as a salient mechanism through which firms can mitigate regulatory risk, enhance operational efficiency, and signal long-term value creation. The shift from voluntary sustainability reporting to mandatory climate disclosures, coupled with the anticipated launch of a national emissions trading scheme, has elevated the strategic importance of innovation investments that contribute to measurable reductions in GHG emissions.
This study examines the relationship between firm-level green innovation and equity market valuation, focusing on the extent to which climate-oriented patenting activity is reflected in investor pricing. While prior research has documented the financial implications of general innovation and intellectual property, the valuation effects of green patenting remain underexplored, particularly in the context of Japan’s evolving regulatory architecture. To identify the channels through which green innovation may influence firm value, we further analyze its impact on three core financial dimensions: profitability, growth expectations, and the cost of capital. Specifically, we test whether firms engaged in green patenting exhibit superior operating performance, higher forward-looking growth metrics, and lower equity financing costs relative to non-innovating peers. By disentangling these effects, the study contributes to a growing literature on the intersection of environmental regulation, innovation strategy, and asset pricing and offers empirical insights into the capital market consequences of climate-oriented technological investment.
In this study, we develop the GXS as an indicator of the competitiveness of green innovation of Japanese manufacturing firms based on the Green Transformation Technology Inventory (GXTI) published by the Japan Patent Office (JPO) and the patent portfolio information held by listed firms. Then, we examine the relationship between the GXS and stock prices (more precisely, the Market-to-Book ratio). The analysis revealed no statistically significant positive correlation between GXS and the MB ratio. However, the results of the moderator model on the degree of influence of GXS on MB for each industry indicate that GXS has a positive influence on MB in several manufacturing industries.
The remainder of this paper is organized as follows. The next section reviews previous studies in this field and presents our research hypotheses. Section 3 describes the measurement and validation methods of the GXS and the data used in this study. Section 4 reports the results using the portfolio and industry moderator models. Finally, Sections 5 and 6 conclude the paper and discuss future issues.
Firm-level innovations can be broadly categorized into technological innovations (products and production processes) and non-technological innovations (organizational and marketing practices) [1,2]. Among technological innovations, product innovation aims to develop new or improved products and services, meet external user requirements, and enhance the efficiency of production and operational processes [3].
Within this broader framework, green innovation has emerged as a critical dimension of technological progress. Green innovation encompasses the development of environmentally friendly products, the adoption of sustainable technologies in production, energy conservation, prevention of natural resource depletion, reduction of emissions to mitigate pollution and global warming, and the protection of biodiversity. In the literature, the term “green innovation” is often used interchangeably with “eco-innovation” and “environmental innovation” [1]. In this study, however, the term is employed specifically to highlight firm-level innovations related to green products and green innovation processes.
Although research on green innovation was relatively limited in earlier decades, recent years have seen a notable increase in scholarly attention and empirical findings. Several studies [4–6] have examined the relationship between green innovation and financial performance. Additional work has broadened the focus to include sustainability innovation, eco-innovation, and the green premium in capital markets, further studies have been conducted [7–10]. Research has investigated stock market reactions, notably in the works by [11,12]. These studies suggest that green innovation provides firms with a cost-competitive advantage by reducing direct production costs (e.g., energy savings) and indirect costs (e.g., regulatory compliance). Moreover, increasing social pressure for corporate sustainability fosters innovation, which in turn strengthens competitive advantage [13]. From the perspective of the resource-based view (RBV) in CSR research, successfully developed green innovation capabilities represent intangible assets that reduce environmental costs and enhance cash-flow generation.
Building on this RBV perspective, prior studies suggest that green innovation capabilities function as intangible assets and as strategic signals to external stakeholders. When combined with signaling theory and stakeholder theory, the likelihood that green innovation capability conveys credible information about corporate sustainability to capital markets and society becomes significant. In this way, green innovation serves a dual role: internally, as a source of competitive advantage, and externally, as a signal that enhances stakeholder confidence in both products and production processes. Such signaling helps firms mitigate perceptions of reputational risk and reduce uncertainty regarding future cash-flows [14–16].
Nevertheless, a critical challenge remains. If investors can correctly identify and assess the green innovation capabilities of individual firms, their risk exposure is reduced. Yet, there is no assurance that such evaluations are accurate; misperceptions may cause stock prices to diverge from a firm’s intrinsic value. To address this gap, the present study isolates the components of a company’s patent portfolio associated with GX and develops a GXS. This score serves as a quantitative indicator of the economic value of patents and is employed to examine how GXS contributes to increases in stock price.
The validation model used in this study was derived from the following residual income model [17–19].
In the above model (1), IV0 denotes the current intrinsic value of the firms, BVt is the book value of assets at the end of year t, NIt is the net income in year t, and rE denotes the firm’s equity cost. Let denote PVRI0 as a summation of the present value of future streams of residual income as of today; we obtain Equation (2).
While BV0 is the net asset value recognized in the financial statements, PVRI0 is the asset value not recognized in the financial statements. As shown in Equation (2), the firms’ intrinsic value is the sum of the book value on the balance sheet and the present value of the future residual income streams. In this study, we assume that PVRI0 is the sum of the economic value of technological competitiveness and other intangible assets (OTH) of the firm. We use YK value, a measure of the econometric value of patents developed by Kudo and Associates (The YK value of a patent, representing the total cost spent by competitors to prevent its grant, offers a lower bound for its economic value. Given that YK values are expected to decrease over time, a decay factor is formally applied to compute them, thereby controlling for the economic depreciation of patents. Let YKxit denote the YK value of the i-th patent owned by firm x at time t, and Nxt be the number of patents acquired by firm x. Then, the YK value of the firm at time t is defined as .). If the economic value of technological competitiveness is a linear function of the YK value, the following Equation (3) is derived.
Because the YK value of all patents held by the firm is decomposed into the total YK value of green patents (GXS) and that of non-green patents (NGXS), we obtain model (4) when the current market value of equity, MV0, is equal to its intrinsic value, IV0.
If the market does not distinguish between green and non-green patents, then β1 = β2 in Equation (4). However, if firms are strongly demanding responses to climate change and environmental risks, then the signs required for β1 and β2 are positive, and β1 > β2 is expected.
From the residual income model (1) and the regression model (4), we derive the following four hypotheses. As previously mentioned, firms are expected to value green patents more heavily than non-green patents because they are required to cope with environmental risks and contribute to sustainability as global citizens. Therefore, we propose H1 as follows:
Hypothesis (H1). In the regression model (4), β1 > 0, β2 > 0, and β1 > β2.
Here, we set our research hypotheses 2 through 4. Assume Hypothesis 1 is valid, meaning that GXS (and/or NGXS) contributes to higher stock prices. Why might GXS has a positive impact on stock prices? As shown in the residual income model (1), GXS can influence stock prices through either the numerator—the present value of future residual income—or the denominator—the cost of equity capital—or through both. We refer to the effect operating through the numerator as the (A well known study that examines separately how available information affects stock prices (or firm value) through the cash-flow channel and the risk factor channel is [20]. In this study, we adopt a similar approach by explicitly considering three paths from GXS to stock prices and setting H2 through H4 accordingly.) cash-flow channel, and the effect operating through the denominator as the risk factor channel. The cash-flow channel can be further divided into current profitability (return on equity, ROE) and growth potential (GDiv) (When clean surplus accounting holds, the dividend discount model and the residual income model are essentially the same. Therefore, we use the dividend growth rate (GDiv) here as a proxy for the growth potential of cash-flows.).
If a positive correlation exists between GXS and stock prices, it must arise either because GXS is positively correlated with profitability and growth, or because it is negatively correlated with the cost of equity capital. Based on this expectation, we propose the following hypotheses:
Hypothesis (H2). Green patents are positively associated with ROE.
Hypothesis (H3). Green patents are positively associated with the growth rate of dividends.
Hypothesis (H4). Green patents are negatively associated with the cost of equity.
H2 and H3 are designed to test the effects via the cash-flow channel, while H4 is intended to test the effects via the risk factor channel.
Finally, the coefficient β1, which captures the effect of green patent holdings on the market-to-book ratio, is expected to vary across industries. In certain sectors, efforts to reduce, eliminate, or repurpose GHG emissions may be positively perceived by investors, thereby enhancing firm valuation. In contrast, firms operating within the capital goods sector may face adverse financial consequences, as research and development expenditures directed toward acquiring green patents can lead to reductions in both profitability and stock prices. In light of this industry-specific heterogeneity, we formulate the following hypothesis (H5):
Hypothesis (H5). The sensitivity of MB to green patents, β1, differs across industries.
Green innovation refers to applying innovative technologies, processes, product development, and techniques that positively impact the environment while promoting sustainability. Such activities have led to the creation of solutions that reduce resource consumption and environmental pollution and mitigate the negative impacts of human activities on the planet. In recent years, green innovation has gained increasing importance due to concerns about climate change and environmental issues. Increased individual and corporate awareness of global climate change, environmental pollution, and resource depletion highlight the need for innovative approaches to address these societal challenges.
Domestic investors perceive Japanese companies as being at the forefront of environmental technology worldwide. However, no objective evidence has been presented to determine whether this is a fact or an illusion. In 2020, the government unveiled its Green Growth Strategy in response to a series of proposals by the European Commission aimed at enhancing the EU’s climate, energy, transportation, and tax policies. Therefore, the transition of Japanese firms to a green growth economy, the impact of climate change on businesses, and the examination of green innovation are important research topics in the field of finance.
To analyze the impact of green innovation on firms’ enterprise value and financial performance, we introduce a measure of GX tailored to Japanese firms. This measure is based on a qualitative patent evaluation method—the YKS method—formulated by Kudo and Associates, along with its corresponding metric, the YK value. The YK value has been previously applied in empirical research on Japanese firms, notably in [21], to assess the relationship between innovation and corporate value. By leveraging patent portfolio data, our approach enables firm-level assessment of green innovation outcomes using objective criteria. While patent portfolios do not capture all innovations and inventions, they are publicly accessible to investors and can be systematically analyzed using International Patent Classification (IPC) codes [22]. This Japan-specific framework offers a novel lens for understanding the financial implications of environmental innovation in the Pacific Basin region.
In June 2022, the JPO created and published its technology classification table [23], known as the “GXTI.” GXTI comprises the five technological perspectives depicted in Figure 1. The IPC codes corresponding to each Level 1 perspective are disclosed, and objective criteria are defined as patents owned by individual companies that are considered green innovation patents. The GXS is measured using the GXTI classification table, and Kudo and Associates calculate the YK value.
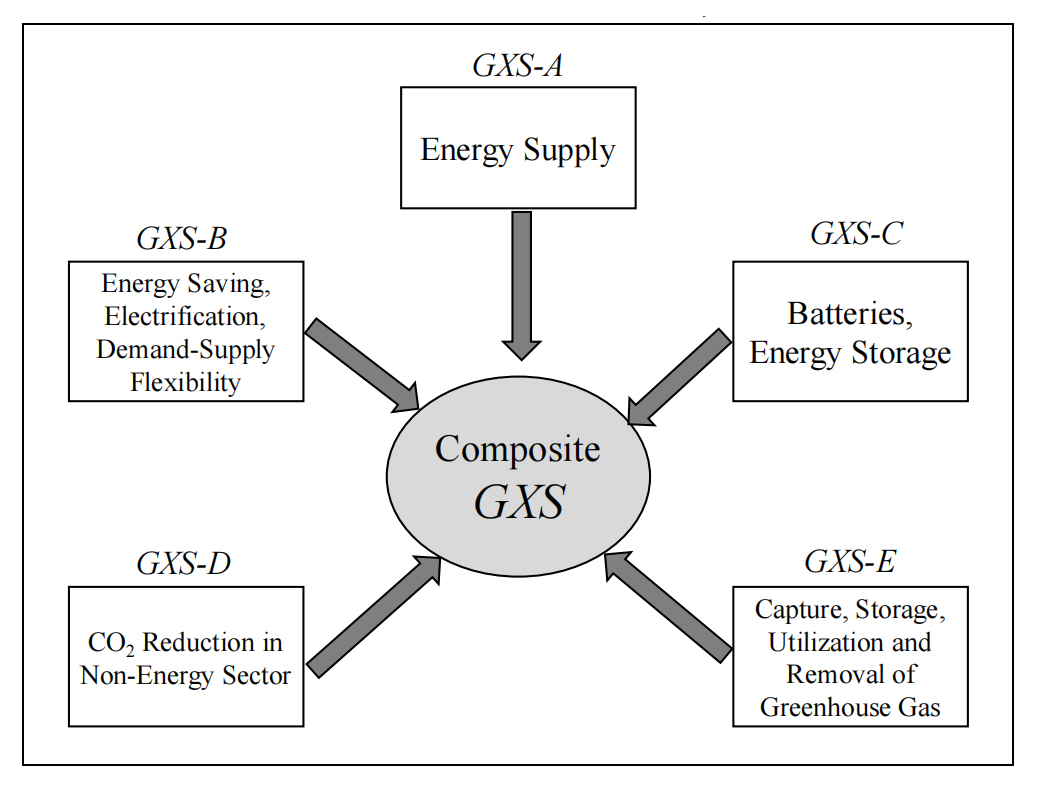 Figure 1. Five perspectives in GXTI Level 1.
First, we calculated the total YK value of patents held by individual firms from the five perspectives of gxA (energy supply) to gxE (capture, storage, utilization, and removal of GHGs) at the end of each month from January 2016 to June 2024. The results are GXS-A to GXS-E, corresponding to the five Level 1 perspectives in the GXTI. Finally, the sum of GXS-A through GXS-E represents the GXS of the firm, indicating the overall green innovation capability of individual firms. The sum of the YK values of patents in force that are not classified as green patents in GXTI is the NGXS (Non-GX Score), and YK is the sum of the YK values of all patents owned by the firms on a consolidated basis. Using this definition, YK = GXS + NGXS.
MethodologyWe use the portfolio formation method combined with regression analysis to investigate the relationship between the GXS, NGXS, MB, ROE, GDiv, and the cost of equity capital. The portfolio-formation method was first applied because it is unclear whether a linear relationship exists between GXS and MB. Before running the regression analysis, we should examine whether there is a monotonous positive or negative correlation between GXS and the dependent variables. If the relationship between GXS and MB is U-shaped (or reverse U-shaped), a polynomial and/or nonlinear regression model should be considered. (The empirical results from the portfolio method will be reported in a subsequent section.)
After applying the portfolio method but before fixing the regression model specification, we first fit a linear model and examined the relationship between the fitted values and the regression residuals to verify the linearity assumption. The residuals were distributed without noticeable bias around zero, suggesting that the regression model’s linearity—after including interaction terms, control variables, and dummy variables—was not a major concern. On the other hand, the distribution of residuals deviated from normality and did not exhibit homoscedasticity. In other words, the assumptions of the Gauss–Markov theorem were not satisfied, and the parameter estimates cannot be guaranteed to be BLUE (Best Linear Unbiased Estimators). Therefore, we analyzed the impact of GXSBV and NGXSBV on stock prices using the following model (5), in which the dependent variable was log-transformed (In regression model (5), the dependent variable is log-transformed; however, homoscedasticity of the residuals is not necessarily guaranteed. Therefore, the t-statistics are calculated using robust standard errors estimated via the Huber-White method [24,25].).
In regression model (5), the dependent variable yjt before the log-transformation is the MB, (1 + ROE), (1 + GDiv), or cost of equity (CostE). As shown in Equation (4), GXS and NGXS should be deflated by net assets to examine the impact of GXS and NGXS on the MB. Thus, the key independent variables are GXSBV and NGXSBV, deflated by net assets (BV). In addition, we consider that the impact of GXSBV and NGXSBV on MB differs by industry in H5; i.e., industry, as categorical data, modifies the association between GXSBV (or NGXSBV) and MB. We include cross-terms between the industry dummy variables IndustD and GXSBV (or NGXSBV) to test H5.
We used six control variables: debt ratio (DR), net cash ratio (NCBV), foreign dependency on sales (FDR), bank dependence on debt (BankD), and, current interest-bearing debt ratio (WCL). The debt ratio, DR, is defined as debt/total assets and controls for capital structure because aggressive R&D expenditures are often financed by debt. The net cash ratio (NCBV, net cash/net assets) accounts for the fact that, following the global financial crisis in 2008, some Japanese firms became reluctant to invest in R&D to avoid financial risks, while others continued R&D activities to support future corporate growth. The degree of dependence on foreign sales, FDR, is the ratio of foreign sales to total sales. For this variable, it is assumed that global firms with a larger share of foreign sales are required to cope with climate change and environmental risks. BankD is defined as bank loans/total interest-bearing debt, which controls for the degree of dependence on banks for financing. The current liabilities ratio WCL, is the ratio of interest-bearing liabilities classified as current liabilities to total interest-bearing liabilities. R&D and capital investment, including investment in green innovation, should be financed by fixed capital. However, this variable controls the possibility of financing through fixed debt.
We must also account for potential reverse causality between GXSBV and NGXSBV and the dependent variables, suggesting that GXSBV and NGXSBV may be endogenous. Therefore, we introduced the two-stage least squares (2SLS) method to estimate the parameters included in the regression model (5). As instrumental variables for GXSBV and NGXSBV, we used the annual industry averages of GXSBV and NGXSBV [26,27] and firms age (Age) which is defines as number of years from the foundation of the firm. Since there are samples with GXSBV = 0 and NGXSBV = 0, the instrumental variables were also set to zero in those cases. For samples with GXSBV > 0 and NGXSBV > 0, the averages were calculated by year and industry.
DataTo calculate the GXS and NGXS, YK values for patents held by firms are necessary, as provided by Kudo and Associates. The patent dataset covers the period from January 2016 to December 2024. However, because the analyses require variables, such as ROE, which are calculated based on the financial statements available at the end of May of each year, the constructed panel dataset covers the period from 2016 to 2024 (nine years).
The primary data sources for financial statements are the Nikkei NEEDS Financial DVD and, for stock prices, the Nikkei NEEDS Daily Stock-Return Database. We calculate the cost of equity capital by employing the Fama and French three-factor model [28] (In estimating the cost of equity capital, we calculated betas from monthly returns over the past 36 months and used the average values (annualized) of the market, SMB, and HML factor risk premiums for 1978–2024. We also employed the Fama–French five-factor models [29] as well as the Carhart four-factor model [30] to estimate the cost of equity capital and conducted similar analyses. However, the choice of estimation method for the cost of equity did not exert a substantial influence on the empirical results. For the construction of the Fama and French three factors in the Japanese market, as well as for model comparisons, readers may refer to [31].).
Table 1 presents, for each year t = 2016, …, 2024, the number of firms with at least one green patent (#Firms) as defined by GXTI, together with the mean and standard deviation of GXSBV. It also reports the number of firms with at least one non-green patent, along with the mean and standard deviation of NGXSBV. Additionally, Table 1 presents the average GXS-to-YK ratio for each year. As shown in Table 1, although the number of firms holding at least one green patent decreased over the sample period, GXSBV increased monotonically. In contrast, both the number of firms holding non-green patents and NGXSBV declined by approximately 15% over the nine years. Furthermore, the ratio of GXS to YK rose by 5.746 percentage points, from 14.507% in 2014 to 20.253% in 2024. This suggests that Japanese firms have increasingly concentrated their resources on green patents with higher competitiveness.
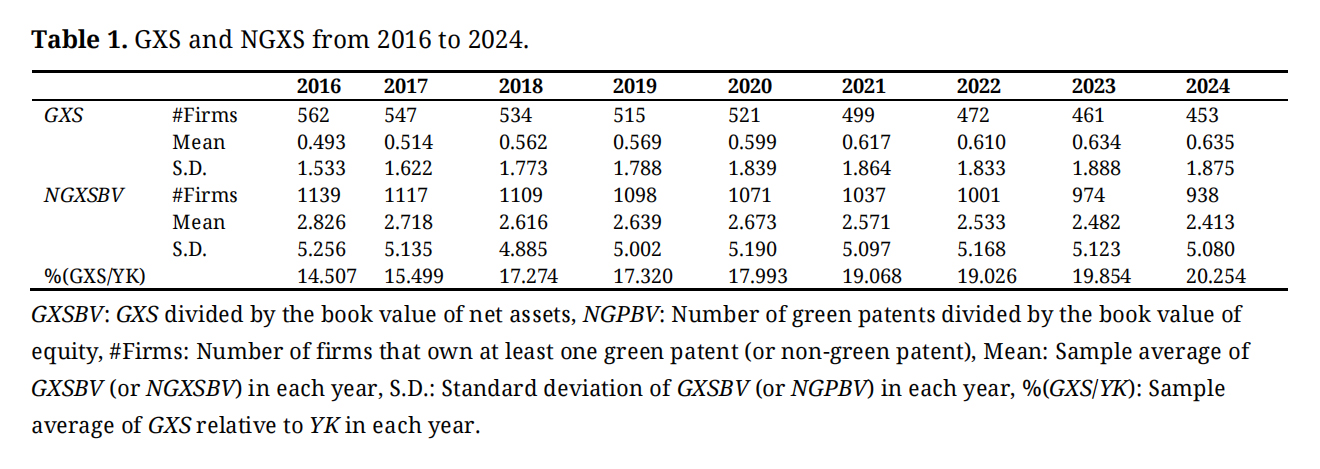 Table 1. GXS and NGXS from 2016 to 2024.
The Pearson correlation coefficients and their corresponding probability values for the key variables are presented in Table 2. First, recall from the definitions that YKBV = GXSBV + NGXSBV. Moreover, Table 1 shows that GXS accounts for 15–20% of YK, which implies that NGXS accounts for 80–85% of YK. Consequently, the correlation between NGXSBV and YKBV is extremely high at 0.940. However, in the regression model (5), we never use NGXSBV and YKBV simultaneously, so there is no need to worry about multicollinearity. Also, the Pearson correlation between GXSBV and NGXSBV, which are used simultaneously in the regression model, is 0.259 and thus not particularly high. Therefore, the need to account for multicollinearity remains low.
One of the primary objectives of this study was to determine whether a positive correlation exists between GXSBV and MB. However, the Pearson correlation between GXSBV and MB is negative (−0.063) and statistically significant at the 1% level. From the correlation coefficient analysis, green patents (GXSBV) are negatively correlated with ROE and the dividend growth rate (GDiv), and positively correlated with the cost of equity capital (CostE). In other words, by deteriorating profitability and growth potential and increasing the cost of capital (i.e., lowering the discount factor), they contribute to a decline in stock prices through all three pathways. In contrast, both NGXSBV and YKBV are significantly and positively associated with MB.
Observations from Panel A suggest that market participants may perceive GXS and NGXS as having distinct effects on stock prices. To confirm this, we conducted a test for the significance of the difference between two dependent correlations that share a common variable. Panel B of Table 2 presents the results of Williams’s test, which indicates that the correlation coefficients between GXSBV and the other four variables (MB, ROE, GDiv, and CostE) differ significantly from the correlation coefficients between NGXSBV and the same four variables.
Based on the results presented in Table 2, H1 is not supported. Furthermore, the findings indicate that the effects of GXS and NGXS on stock valuation differ substantially.
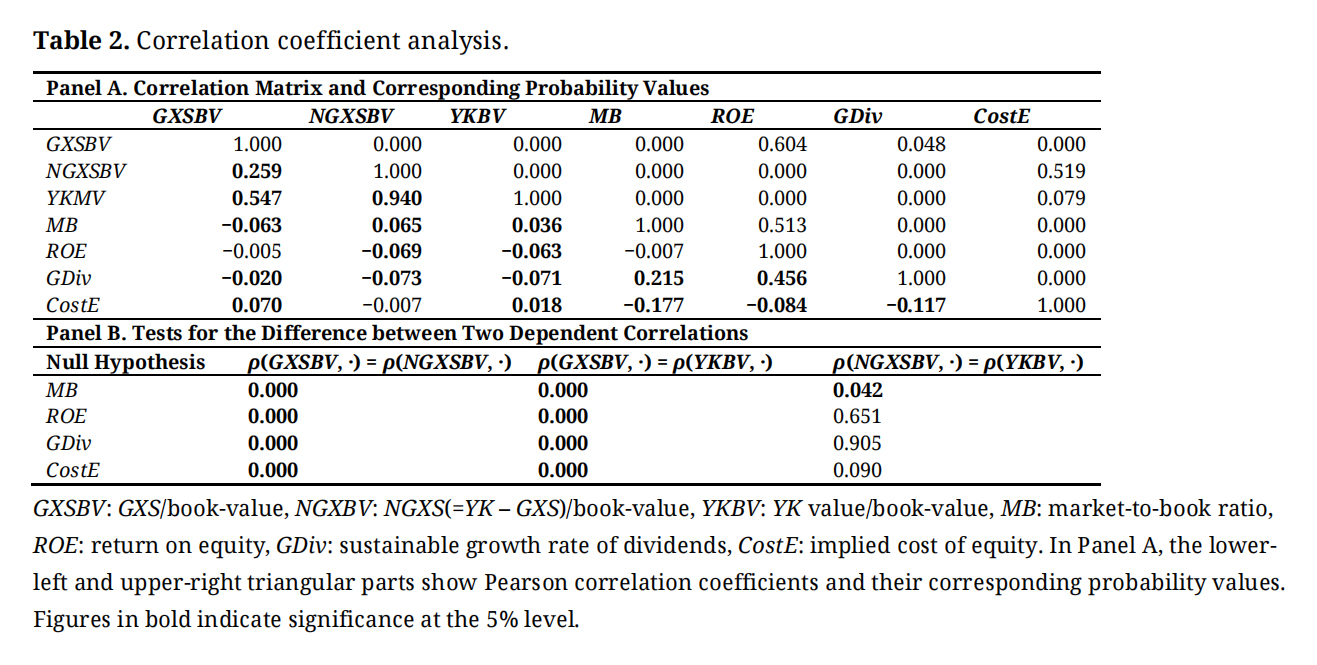 Table 2. Correlation coefficient analysis.
Tables 3 and 4 report the results of the portfolio method. From the residual income model, the change in stock prices is determined by the effect of green patents on ROE and the cost of equity capital. As expected from the findings of the negative correlation between the GXSBV and MB in Table 2, green patents do not simultaneously raise firms’ ROE or lower the cost of equity capital.
In the first step, we constructed portfolios with GXS = 0 and GXS > 0 and checked whether there were differences in MB, ROE, GDiv, and CostE between the groups (GXS = 0) and (GXS > 0). In the second step, we construct quintile portfolios of firms with GXS > 0 ranked by GXSBV and check whether each variable changes monotonically from P1 (low GXSBV) to P5 (high GXSBV) and whether there is a statistically significant difference in financial attributes between P1 and P5.
Table 3 presents the financial attributes of the GXSBV-ranked quintile portfolios. First, as for MB, the group with GXS = 0 has a higher MB than firms with positive GXS, and the difference (−0.050) is statistically significant at the 10% level. Furthermore, as GXSBV increases from P1 to P5, MB conversely decreases monotonically, and the difference in MB between P1 and P5 was −0.505, which was statistically significant. Therefore, this finding contradicts H1, and we cannot confirm that GX positively impacts stock prices. As for ROE and GDiv, the differences between P1 and P5 are negative and significant. As for CostE, the difference between P1 and P5 is positive and statistically significant, which means GXS increases the cost of equity. The results are inconsistent with our prior expectation that GX increases profitability (H2) and growth potential of dividend (H3), lowers the cost of capital (H4), and consequently raises the stock price (H1).
Next, we investigate the relationship between non-green patents (NGXSBV) and financial performance. Table 4 presents the financial attributes of the NGXSBV-ranked quintile portfolios. In this table, the average MB of firms with NXGS = 0 is 1.220, whereas the average MB of firms with NGXS > 0 is 1.308, though the difference is not significant. MB tended to increase from P1 (low NGXSBV) to P5 (high NGXSBV), and the difference of 0.230 between P1 and P5 was significant at the 1% level. As for ROE and GDiv, the signs of difference between P1 and P5 are negative and significant. On the other hand, comparing the cost of equity capital between the groups with GXS = 0 and GXS > 0 reveals that the latter has a lower value (Diff. = −0.763), statistically significant at the 10% level. This suggests that the risk-reduction effect stemming from technological competitiveness exerts a positive influence on stock prices.
The trends in Tables 3 and 4 indicate that green and non-green patents affect stock prices differently.
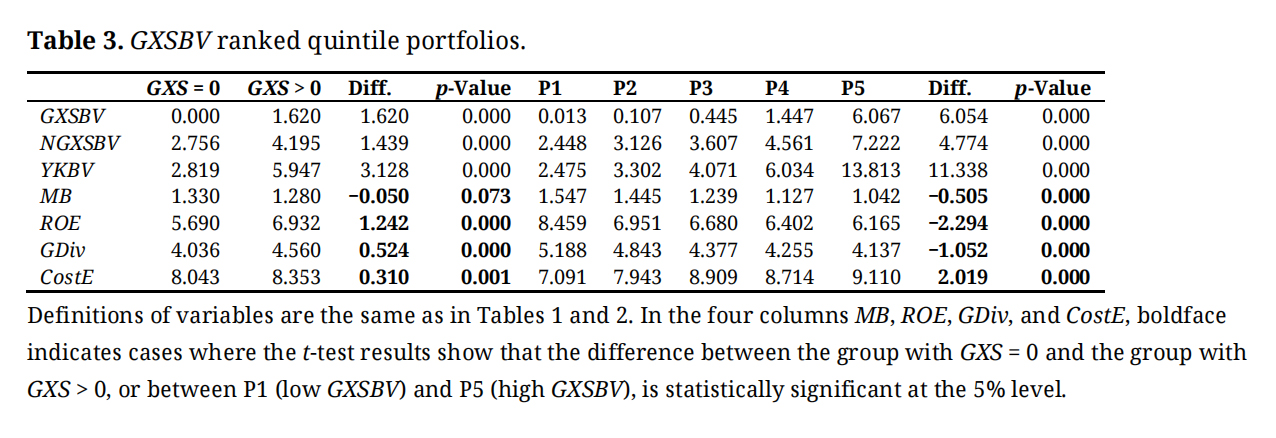 Table 3. GXSBV ranked quintile portfolios.
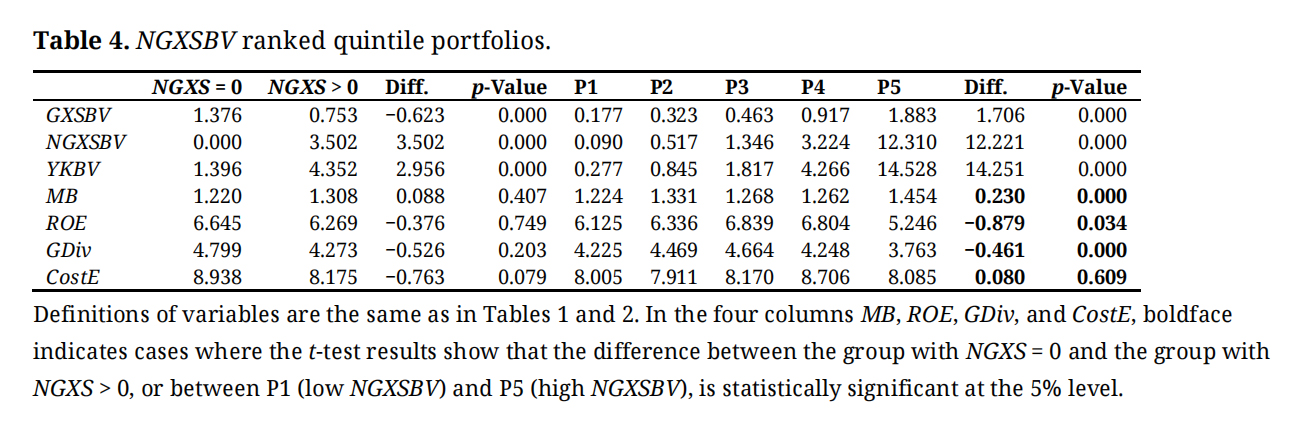 Table 4. NGXSBV ranked quintile portfolios.
Because MB is higher for the group of firms with GXS = 0 in Table 3, we exclude these samples from the regression model (5) and use only those with GXS > 0. Table 5 presents the results of the regression analyses.
As mentioned earlier, since GXSBV and NGXSBV may be endogenous variables, we used the industry-average GXSBV, industry-average NGXSBV, and the firm’s age (which is defined as the number of years from the foundation) as instrumental variables. We estimated the parameters in Model (5) using 2SLS. As shown in Table 5, the results of the Weak-Instrument test indicate that the industry-average GXSBV and industry-average NGXSBV are strongly correlated with GXSBV and NGXSBV. Although we employed both OLS and 2SLS, the results of the Wu-Hausman test suggest that endogeneity should be controlled; therefore, Table 5 reports only the 2SLS results (Since the null hypothesis of the Sargan test was rejected, it cannot be convincingly claimed that endogeneity has been fully controlled. However, in the early stage of this study we conducted standard multiple regression analysis, and in the revision we also applied alternative IV estimators such as LIML and Jackknife IV. These additional methods did not alter the main conclusions, which provides a certain degree of reliability to our findings. We acknowledge this as a limitation of the present study.). When the dependent variables are stock prices or other financial variables, the noise in them tends to be large. Therefore, the range of adjusted R2 values shown in Table 5 can be regarded as a generally acceptable level.
In the regression analysis results, the adjusted coefficient of determination ranges from 0.080 (GDiv) to 0.143 (MB), which are not particularly high values. However, for all dependent variables, the p-values from the F-tests are nearly zero, indicating that the joint null hypothesis that all regression coefficients are equal to zero is rejected.
As expected from the results reported in Tables 2–4, the regression coefficient of GXSBV (β1) is negative (–0.783) and statistically significant at the 10% level when MB is the dependent variable. When ROE is used as the dependent variable, the coefficient turns positive, but it is not statistically significant (p-value = 0.706). These findings suggest that GXS neither enhances stock price nor improves profitability, indicating that H1 and H2 are not supported. For growth potential (GDiv), the slope coefficient is negative and not significant, implying that H3—which posits a positive association between GXS and GDiv—is also not supported. When the dependent variable is the cost of equity (CostE), the regression coefficient is positive but again statistically insignificant. Taken together, the average impact of GXSBV across industries does not result in higher stock prices, and the evidence fails to support hypotheses 1 through 4.
In sharp contrast, NGXBV positively affects stock price (MB), with positive, statistically significant regression coefficients when MB is the dependent variable. Moreover, NGXSBV shows a negative relationship with CostE. When ROE and GDiv are used as dependent variables, the regression coefficients are close to zero and statistically insignificant. Taken together, these results suggest that non-green patents exert a favorable influence on stock prices through the risk channel rather than the cash-flow channel.
As already noted, the effect of GXSBV on stock price (MB) differs from that of NGXSBV. The last row of Table 5 reports the results of the linear hypothesis test, which indicate that, for all dependent variables, the regression coefficients for GXSBV and NGXSBV differ significantly. These findings suggest that green patents are not valued more positively in the stock market than non-green patents.
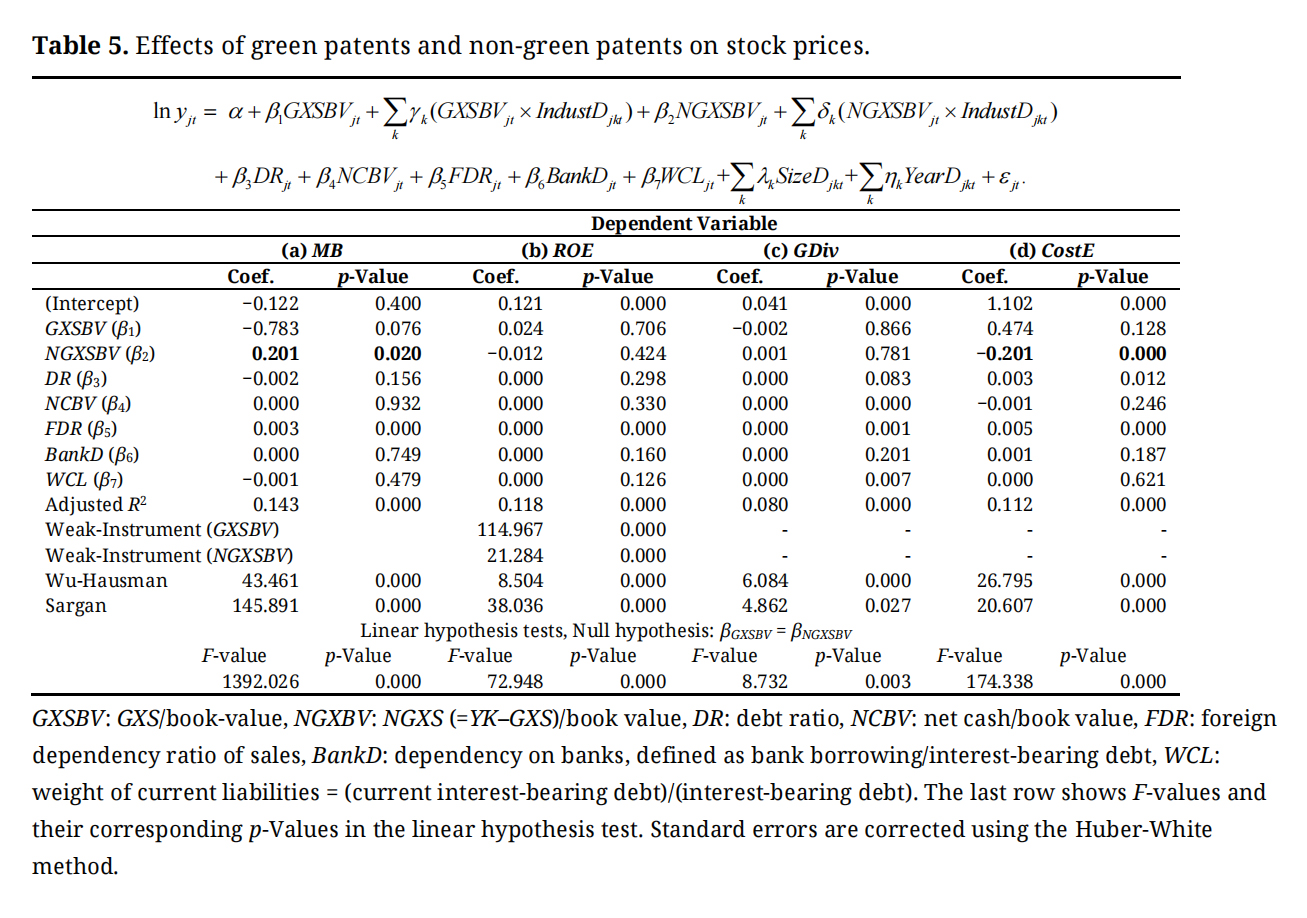 Table 5. Effects of green patents and non-green patents on stock prices.
Finally, we examine H5. From the regression model (5), the sensitivity of GXSBV to the four key variables are expressed in the following Equation (6).
The slope coefficients γs of the cross-terms in regression model (5) were not shown in Table 5. Instead, the conditional betas for GXSBV in each industry, as defined in Equation (6), are listed in Table 6. The reference industry for the conditional beta is the food industry (TSE 33 industry classification, #4). The sensitivities (conditional betas) of GXSBV to key variables (MB, ROE, GDiv, and CostE) are calculated for industries ranging from the “textile industry” (industry #5) to “other products” (industry #19).
In Table 6, the areas in bold represent industries for which the sign of conditional betas supports hypotheses H1 to H4, and the regression slopes corresponding to the cross-terms are significant at the 10% level. Regarding MB, Table 6 shows that sensitivity is positive in the textiles and apparel, pharmaceutical, iron & steel, metal products, and transportation equipment industries. These sectors share a common tendency toward elevated GHG emission intensity. This pattern is particularly pronounced in manufacturing processes that rely heavily on thermal treatment, chemical conversion, and fossil fuel combustion, resulting in substantial direct emissions classified under Scope 1. In addition, these industries are characterized by extensive upstream and downstream value chains that contribute significantly to indirect emissions, particularly those captured under Scope 3. For example, the procurement and processing of raw materials such as cotton, chemical feedstocks, iron ore, and metals entail considerable environmental externalities, while the use-phase emissions associated with transportation equipment persist throughout the product lifecycle. Given this emissions profile, firms in these sectors are subject to heightened scrutiny and regulatory pressure under Japan’s evolving climate disclosure regime, including the GX legislation and emerging standards aligned with the TCFD and the ISSB. As a result, firms operating within these industries face increasing expectations to pursue climate-oriented innovation and to demonstrate credible progress in decarbonization, both as a compliance imperative and as a strategic response to investor demand for environmental accountability. This result confirms that the effect of GX on stock prices differs by industry, supporting H5.
Why, then, does GXS exert a negative effect on stock price in the full sample, while a positive effect is observed only in industries subject to strong GHG reduction pressures? In Table 6, when ROE and GDiv are used as dependent variables, the interaction terms between GXSBV and industry dummy variables are, with few exceptions, statistically insignificant. This indicates that the effect of GXS on stock prices through the cash-flow channel is not important, or at least not statistically significant. By contrast, in industries where the conditional beta is positive when MB is the dependent variable, the conditional beta becomes negative and statistically significant when CostE is the dependent variable. Therefore, when GXS exerts a positive effect on stock prices, this can be explained through the risk factor channel—that is, risk mitigation achieved through green innovation.
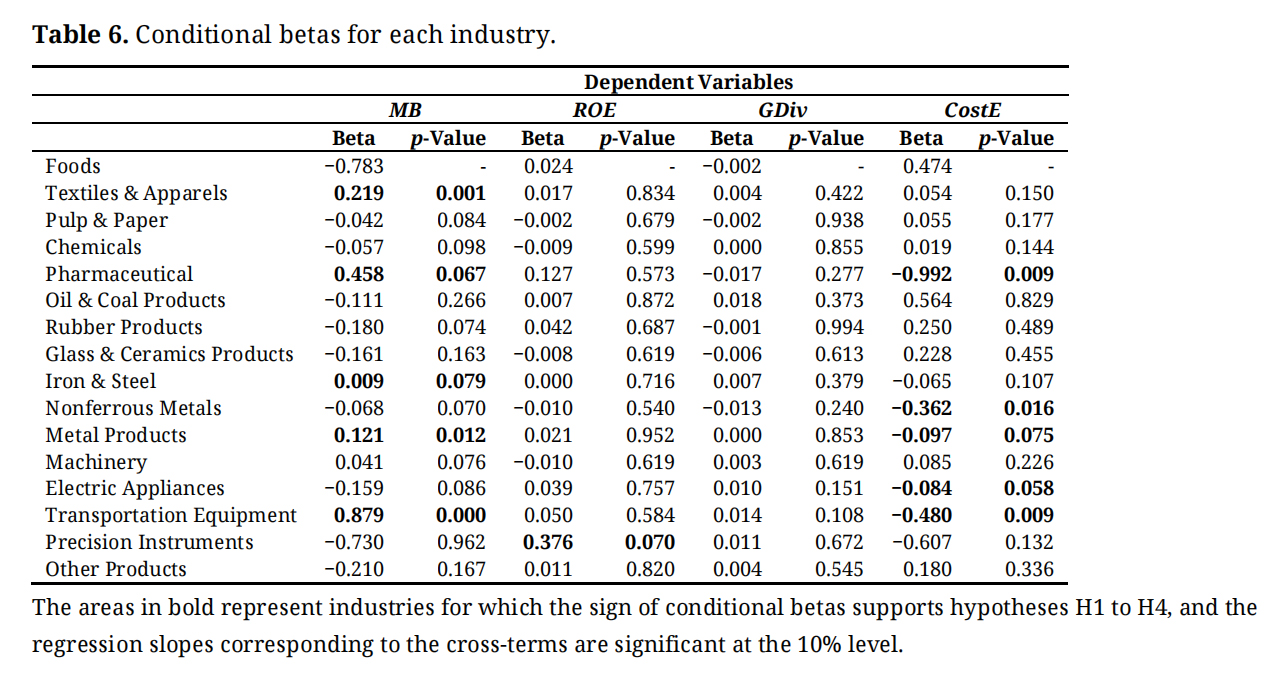 Table 6. Conditional betas for each industry.
This study introduced a novel numerical indicator of green innovation, GXS, and examined its relationship with stock price performance. Although we hypothesized that green innovation would enhance firm profitability, reduce risk and the cost of capital, and thereby positively influence stock valuations, our empirical findings did not support a direct positive association between GXS and firm-level profitability or risk reduction.
Interestingly, we observed a statistically significant positive correlation between stock prices and NGXS, our indicator for non-green patents. This suggests that broader technological competitiveness continues to be a key driver of market valuation. Moreover, when accounting for industry-level heterogeneity, GXS was positively associated with stock prices in sectors under greater pressure to reduce GHG emissions—either during production or across the value chain. These findings highlight the importance of industry context in shaping the financial implications of green innovation.
While these results offer initial insights into the differential effects of green and non-green patents, they do not fully elucidate the mechanisms behind these disparities or the sectoral variations observed. Limitations include the availability of firm-level GHG emission data (Scopes 1, 2, and 3) and the lack of granularity in patent classification. Future studies should address these gaps by incorporating longitudinal data and more refined innovation typologies.
As a policy implication, it is important to recognize that public support for green innovation in Japan has been expanding through a variety of large-scale initiatives. For example, the New Energy and Industrial Technology Development Organization (NEDO) has launched programs such as the “Business Development Support Project for GX Deep-Tech Startups” and the “Deep-Tech Startup Support Project.” At the same time, the Ministry of Economy, Trade and Industry (METI) has established the “Green Innovation Fund” to provide continuous and substantial R&D financing. These initiatives demonstrate a strong governmental commitment to accelerating the transition toward a decarbonized economy and fostering innovation in the GX domain.
However, despite the scale and ambition of these programs, there is no well-developed platform for systematically evaluating the economic and qualitative value of green patents. Without such a mechanism, subsidies risk being allocated indiscriminately, reducing the efficiency of public investment and weakening their intended impact. In this context, patent quality indicators derived from models such as the GXS introduced in this study are especially valuable. By offering a standardized and empirically grounded measure of patent quality, GXS can help policymakers and funding agencies distinguish between innovations that truly contribute to technological competitiveness and those that merely qualify for support under broad definitions of “green.”
Furthermore, this study provides empirical evidence on how capital markets evaluate GXS, showing that the widespread belief that green innovation necessarily enhances stock prices and firm profitability does not always hold. Instead, our findings reveal that non-green patents (NGXS) are more consistently associated with positive stock price performance. In contrast, the effect of green patents depends heavily on industry context—particularly in sectors facing strong regulatory or societal pressure to reduce GHG emissions. This nuanced result underscores the importance of tailoring policy support to sector-specific conditions rather than assuming uniform benefits across industries.
Taken together, these insights highlight the need for a more sophisticated policy framework that integrates patent quality assessment into funding decisions. Establishing such a platform would not only improve the efficiency of public subsidies but also strengthen the alignment between innovation policy and capital market realities. By doing so, policymakers can ensure that scarce resources are directed toward genuinely valuable green technologies, thereby enhancing both the credibility and the effectiveness of Japan’s green innovation strategy.
Our research contributes to the sustainability and finance literature by introducing GXS as a new metric for green innovation and examining its financial relevance. Although GXS does not show a direct relationship with firm-level profitability or risk reduction, its positive association with stock prices in emission-intensive industries indicates that green innovation can be financially rewarded under environmental pressures. This pattern highlights the importance of industry context in shaping the financial outcomes of sustainability-oriented innovation.
The contrast between GXS and NGXS effects underscores the need to distinguish between types of innovation when evaluating market responses. Whereas non-green patents appear to drive market valuation consistently, the financial relevance of green patents is conditional and sector-specific. These insights carry significant implications for investors, policymakers, and corporate strategists seeking to align innovation portfolios with sustainability goals. They caution against the prevailing belief that green innovation universally enhances firm value, instead arguing for more nuanced evaluation frameworks.
The policy relevance of this study is especially strong. Public support for green innovation in Japan has expanded through programs such as NEDO’s “Business Development Support Project for GX Deep-Tech Startups” and “Deep-Tech Startup Support Project,” as well as METI’s “Green Innovation Fund,” which provides large-scale and continuous R&D financing. Despite the scale of these initiatives, Japan lacks a platform for systematically assessing the economic and qualitative value of green patents. Without such mechanisms, subsidies risk becoming indiscriminate transfers that weaken the efficiency of public investment. Patent quality indicators derived from models such as GXS can help address this gap by giving policymakers a tool to allocate resources more effectively and ensure that funding supports genuinely valuable green technologies.
Future research should build on these contributions by developing a more detailed framework that uses time-series data on GXS and NGXS, incorporates GXTI field-level scores, and accounts for differences across industries. Such efforts will deepen our understanding of how innovation strategies interact with capital market dynamics and sustainability imperatives, while also informing the design of more sophisticated policy instruments. By bridging the gap between innovation metrics, financial evaluation, and public policy, this study lays the groundwork for a more evidence-based approach to supporting the green transition.
The data used in this study cannot be shared with third parties due to copyright restrictions and data usage agreements. However, regarding the GXS of Japanese companies, data sharing may be considered if an appropriate academic purpose is provided, such as a formal research collaboration proposal.
Conceptualization, SI and HT; methodology, HT; software, HT; validation, SI and HT; formal analysis, HT; investigation, SI and HT; resources, HT; data curation, SI and HT; writing—original draft preparation, HT; writing—review and editing, SI; project administration, HT; funding acquisition, HT; coordination with Kudo and Associates for access to patent database, SI; conference presentation, SI and HT; manuscript revision based on conference feedback, SI and HT.
The authors declare no conflicts of interest.
This research was primarily supported by the Japan Society for the Promotion of Science (JSPS) KAKENHI Grant Number 22K01709 (Grant-in-Aid for Scientific Research (C)).
This research benefited from access to valuable patent data provided by Kudo and Associates. The authors also received insightful advice on the Japanese patent system and practices from Ichiro Kudo, Fumio Ozawa, and Takeshi Yagino. We gratefully acknowledge their contributions.
1.
2.
3.
4.
5.
6.
7.
8.
9.
10.
11.
12.
13.
14.
15.
16.
17.
18.
19.
20.
21.
22.
23.
24.
25.
26.
27.
28.
29.
30.
31.
Lastname F, Lastname F, Lastname F. The downside of green innovation: How green patents affect corporate value and profitability in Japanese manufacturing firms. J Sustain Res. 2025;7(4):e250078. https://doi.org/10.20900/jsr20250078.

Copyright © Hapres Co., Ltd. Privacy Policy | Terms and Conditions


