Location: Home >> Detail
J Sustain Res. 2026;8(3):e260067. https://doi.org/10.20900/jsr20260067
 ,
Daniel Yamegueu 2 ,
Sodiya Keïta 2 ,
Djim Doumbe Damba 1
,
Daniel Yamegueu 2 ,
Sodiya Keïta 2 ,
Djim Doumbe Damba 1
1
2
*
Solar-powered irrigation is expanding across the Sahel, yet a lack of field-compatible health metrics for LiFePO4 batteries limits predictive maintenance in decentralized systems. Coulombic Efficiency (CE) is unreliable under natural temperature and humidity fluctuations, thus masking early degradation. This study introduces Qcycle, the total capacity per charge-discharge cycle (QC + QD), and validates its robustness relative to CE under Sahelian semi-field conditions. Four 280 Ah LiFePO4 cells were cycled over five months (May–September 2022) in Kamboinsé, Burkina Faso, spanning dry and rainy seasons. Two regimes represented agricultural use: rapid 24-h cycles (146 total) and slow 96-h cycles (35 total). While CE oscillated erratically, Qcycle revealed consistent exponential capacity fade. Nonlinear regression yielded high goodness-of-fit values (R2 = 0.97 to 0.99), demonstrating the ability of Qcycle to consistently capture the observed degradation trend across the tested cells and cycling regimes. Qcycle provides a practical, instrumentation-tolerant alternative to CE for decentralized solar irrigation, supporting predictive maintenance in the water-energy-food nexus and advancing SDG 7 targets.
2iE, Institut International d’Ingénierie de l’Eau et de l’Environnement; AC, alternating current; BESS, battery energy storage system; BMS, battery management system; CE, Coulombic efficiency; CPU, central processing unit; dQ/dV, differential capacity analysis; EB Tester, battery testing software; F1/F2, first and second principal components; LA, lead-acid; LabEREE, Laboratoire Énergies Renouvelables et Efficacité Énergétique; LEHSA, Laboratoire Eaux, Hydro-Systèmes et Agriculture; LiCoO2, lithium cobalt oxide; LiFePO4, lithium iron phosphate; Li-ion, lithium-ion; MSE, mean squared error; Ncycle, total number of cycles; OCV, open-circuit voltage; PCA, principal component analysis; PV, photovoltaic; QC, charged capacity; QD, discharged capacity; Qcycle0, initial cycle capacity; Qcyclemin, end-of-life cycle capacity threshold; R-cells, rapid cycling scenario cells; RH, relative humidity; RMSE, root mean squared error; S-cells, slow cycling scenario cells; SDG, Sustainable Development Goal; SEI, solid electrolyte interphase; SoC, state of charge; SoH, state of health; USB, universal serial bus; Vmax, maximum charging voltage; Vmin, minimum discharging voltage
Does sustainable development in the Sahel require integrated approaches to the water-energy-food nexus [1]. Agriculture employs more than 60% of the working population in Sahelian countries and accounts for up to 50% of GDP when livestock is included [2,3], yet productivity remains constrained by unreliable rainfall and limited irrigation infrastructure.
Solar-powered irrigation provides a promising pathway toward sustainable agricultural intensification, aligning with Sustainable Development Goal 7 (affordable and clean energy) [4,5] and SDG 2 (zero hunger). However, the long-term viability of such systems depends on durable energy storage. While lithium iron phosphate (LiFePO4) batteries are increasingly used in off-grid solar applications, their degradation behavior under harsh Sahelian conditions is still poorly understood, and standard indicators such as Coulombic Efficiency (CE) are highly sensitive to the temperature and humidity fluctuations inherent to field environments.
This study addresses this gap by introducing Qcycle, the total capacity per charge-discharge cycle, and demonstrating its robustness relative to CE under Sahelian semi-field conditions. By linking electrochemical engineering with agricultural sustainability, this research contributes to the food nexus literature and supports evidence-based decisions for the rural energy transition.
Research Question and ObjectivesDespite the growing deployment of LiFePO4 batteries in solar irrigation, field-compatible health metrics remain lacking. CE, widely used in laboratory settings, becomes erratic amid natural environmental shifts, masking early degradation. This finding raises three questions: (1) How reliably can CE track degradation compared to Qcycle in decentralized semi-field Sahelian conditions? (2) What capacity-fade patterns does Qcycle reveal under rapid versus slow agricultural cycling regimes? (3) What cell-level lifespan can theoretically be projected from Qcycle decay, and how does manufacturing heterogeneity influence these projections?
The overall aim was to advance sustainable energy storage practices in the Sahel by validating Qcycle as a practical, instrumentation-tolerant alternative to CE. Unlike empirical lifetime prediction models, the objective of the present work was primarily to introduce and validate a reliable degradation monitoring metric (Qcycle) under semi-field operating conditions. Lifespan projection was explored only as one possible application of the degradation trajectories derived from this metric. The specific objectives were to quantify degradation rates across two realistic operating scenarios, model capacity fade via nonlinear regression, and estimate theoretical cell lifespans for decentralized solar irrigation systems.
A redundant experimental setup was implemented to ensure reliable battery testing under unstable electricity-supply conditions common in the Sahel (Figure 1). The system was initially powered by the national electricity grid (220 V AC) managed by SONABEL. Anticipating frequent outages, two additional backup levels were added to maintain uninterrupted operation. A 5.5 kW generator served as the primary backup source, while an automatic switch ensured a seamless transition between grid power and generator (Figure 1, ①). As an intermediate safeguard, a hybrid converter with integrated backup batteries supplied energy during brief outages (Figure 1, ②). A third backup layer was added through a SATGTAG inverter (3 kVA/2400 W), providing up to 30 min of autonomy (Figure 1, ③). These safeguards were implemented after preliminary commissioning tests, which showed that sudden power interruptions could cause data loss in the EB Tester software. During the reported five-month experiment, however, no data loss or cycle interruption occurred; consequently, no data interpolation or reconstruction was required.
Battery testing was conducted using four ZKETECH A40L battery testers (T1 to T4), each connected to a dedicated LiFePO4 cell (R1, R2, S1, or S2) and to a separate computer (CPU1 to CPU4). Each computer ran the EB Tester Software (version 5.1), which managed test programming, real-time data display, and time-step recording (Figure 1, ④). A multimeter was used to cross-check voltage and current values from the testers each week, ensuring measurement accuracy. Ambient temperature and relative humidity were recorded continuously throughout the experiment using a TempU08B USB data logger [6], with sensors positioned adjacent to the battery cells to record representative environmental conditions.
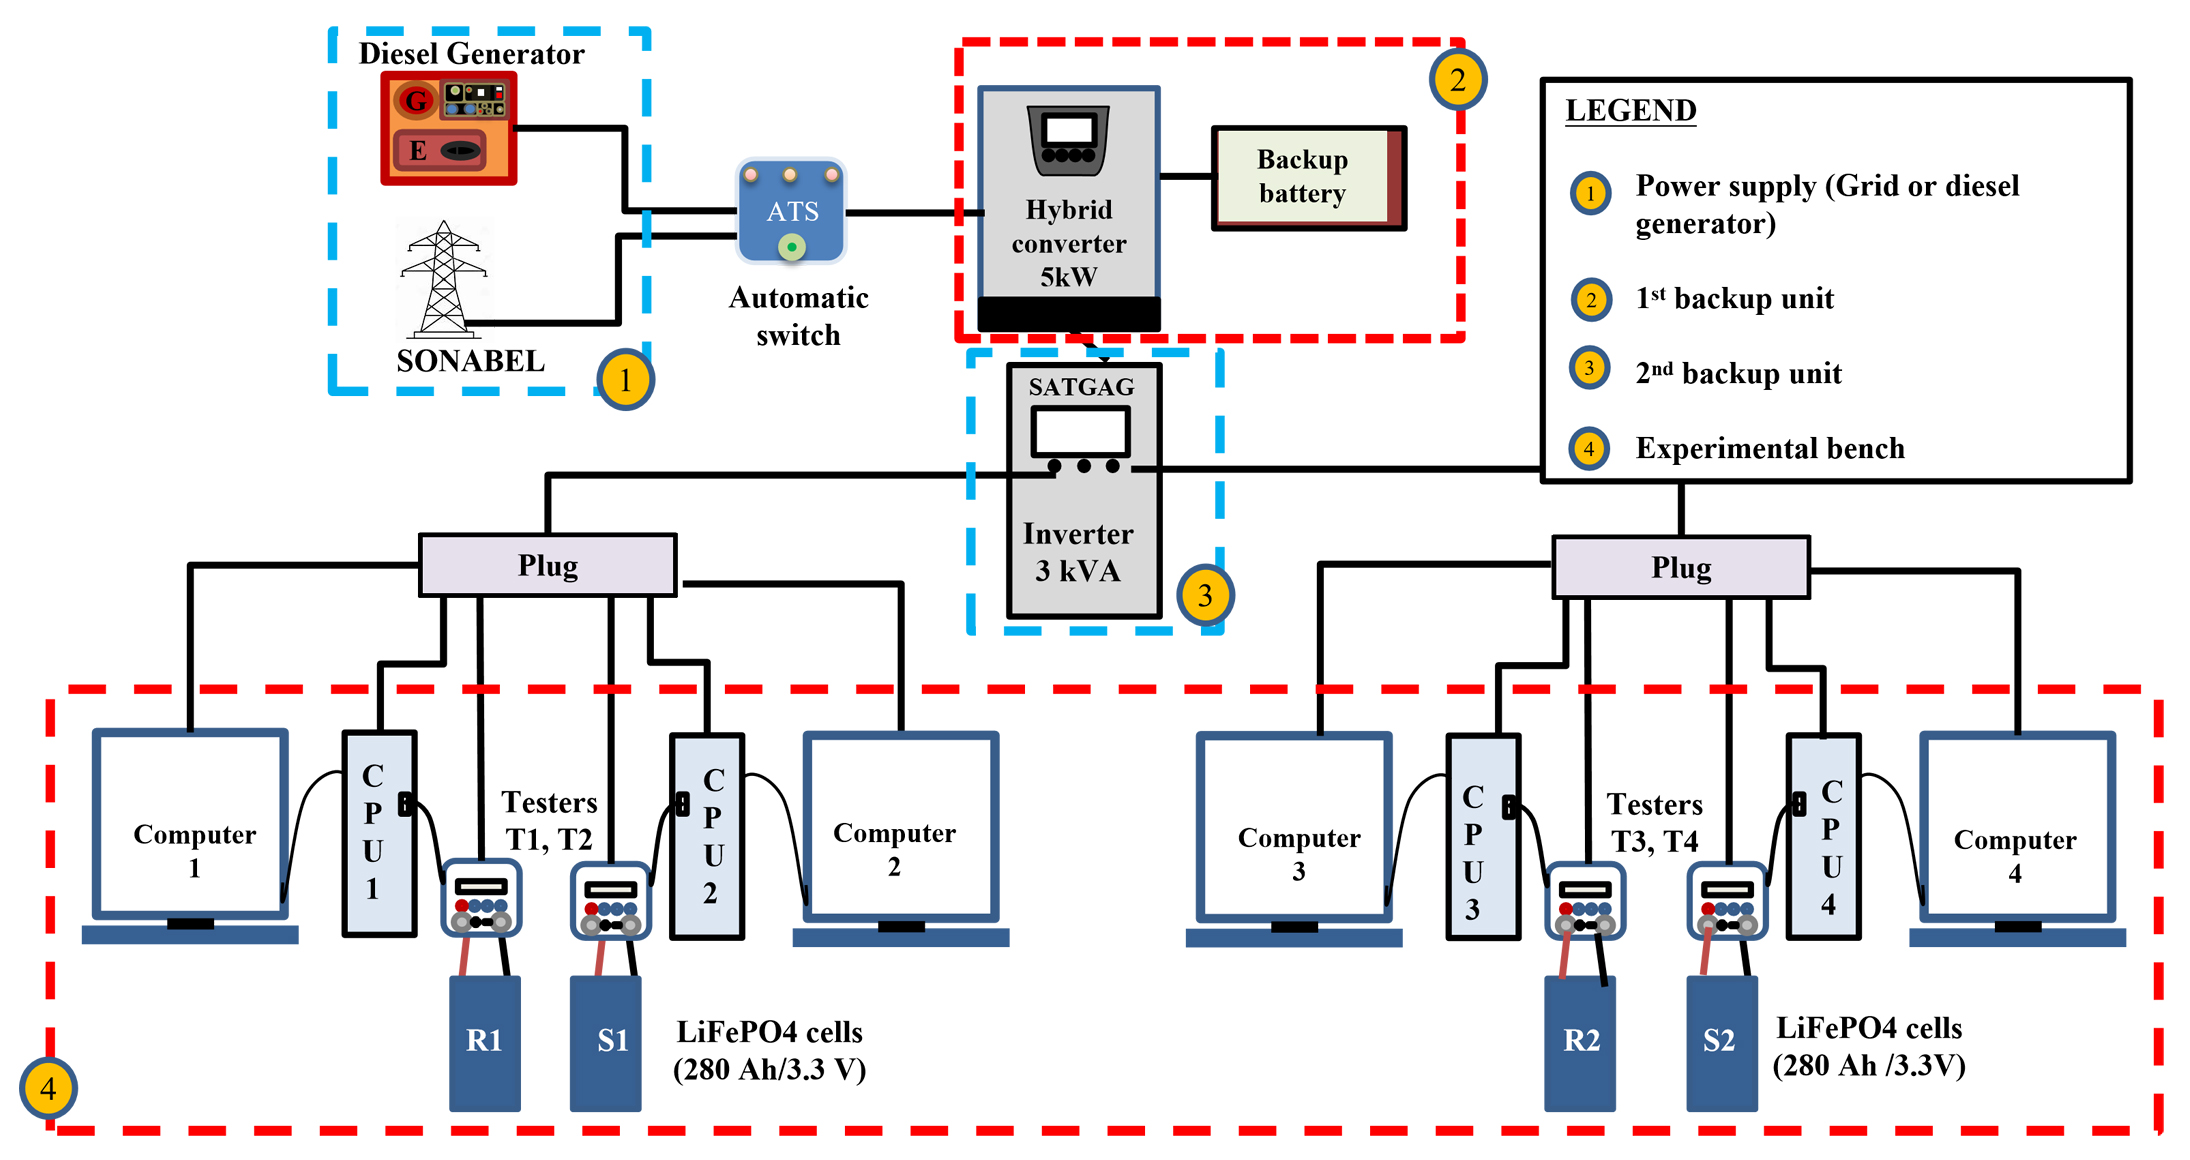 Figure 1.
Experimental setup diagram. The system integrates three levels (①, ②, ③) of backup power supply (grid, generator, inverter) to ensure data continuity. Four ZKETECH A40L testers (④) (T1–T4) are connected to LiFePO4 cells (R1, R2, S1, S2) and to computers (CPU1–CPU4) running the EB Tester software. Environmental conditions are logged using a USB data logger (TempU08B).
Figure 1.
Experimental setup diagram. The system integrates three levels (①, ②, ③) of backup power supply (grid, generator, inverter) to ensure data continuity. Four ZKETECH A40L testers (④) (T1–T4) are connected to LiFePO4 cells (R1, R2, S1, S2) and to computers (CPU1–CPU4) running the EB Tester software. Environmental conditions are logged using a USB data logger (TempU08B).
Four 280 Ah/3.2 V lithium iron phosphate (LiFePO4) prismatic cells were tested continuously for five months (May–September 2022), covering both dry and rainy seasons in Kamboinsé, Burkina Faso (latitude 12°26′48″ N, longitude 1°33′45″ W). The cells had the same brand, capacity, and batch, with assumed uniform initial characteristics. Given the absence of manufacturer datasheets, nominal cell characteristics were compiled from peer-reviewed literature (Table 1). The values for nominal voltage, open-circuit voltage (OCV), and cutoff thresholds were aligned with prior experimental studies on 280 Ah class LiFePO4 cells under similar operating conditions [7].
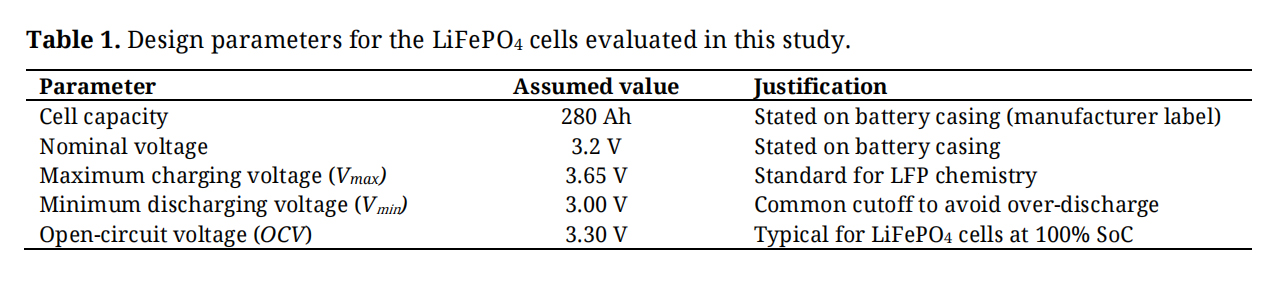 Table 1. Design parameters for the LiFePO4 cells evaluated in this study.
Two realistic operating scenarios were used based on local solar energy use profiles in Burkina Faso [8]: (i) a “fast” scenario simulating high daily energy turnover (Scenario R), and (ii) a “slow” scenario simulating extended storage and moderate consumption (Scenario S). In the fast scenario, each charge/discharge cycle spanned 24 h, with charging set to 8 h to represent the average daily sunshine duration [9,10], and discharging lasting 16 h to represent nighttime irrigation operation. Charging and discharging currents were IR-charge = 35.76 A and IR-discharge = 17.87 A, corresponding to C-rates of 0.13C and 0.064C, respectively, which reflected the energy demand of a typical 2.2 kW/220 V submersible pump (flow rate ≈ 5 m3/h; total head = 75 m) that is commonly used to irrigate 1.0 hectare of farmland [11].
In the slow scenario (Scenario S), each cycle spanned 96 h (4 days), with a charging period of 32 h and a discharging period of 64 h, representing cloudy weather or low usage. The charging and discharging currents were IS-charge = 8.79 A and IS-discharge = 4.39 A, corresponding to C-rates of 0.031C and 0.016C, respectively. These values are consistent with current levels used in domestic solar installations deployed by the national utility in rural Burkina Faso [12]. All tests used constant-current charging and discharging modes, with voltage and current values checked once a week with an independent multimeter to ensure accuracy.
Novel Degradation Metric: QcycleThis study introduces Qcycle as a new indicator for monitoring battery degradation under field conditions. Coulombic Efficiency (CE), which is defined as the ratio of discharged to charged capacity (1):
is widely used but suffers from high sensitivity to measurement errors [13,14]. To overcome these limitations, Qcycle was defined as the total capacity exchanged during each cycle (2):
where QC (Ah) is the charged capacity and QD (Ah) is the discharged capacity within the same cycle.
Because this metric adds rather than divides two measured quantities, it provides a more stable and reliable signal in real-world conditions where small instrumental variations occur. To demonstrate this advantage, consider a typical case where the charged capacity (QC) is 50 Ah with an uncertainty of ±1 Ah, and the discharged capacity (QD) is 49 Ah with equal uncertainty. The resulting CE is 49/50 = 0.98 (98%). However, due to measurement uncertainty, QD may range from 48 to 50 Ah, and QC from 49 to 51 Ah. This yields extreme CE values of 48/51 ≈ 94.1% and 50/49 ≈ 102.0%, which results in potential variability of ±4% around the nominal value. In contrast, the corresponding Qcycle is 50 + 49 = 99 Ah, with a combined propagated uncertainty of ±2 Ah, yielding a relative error of ±2.0%. This example demonstrates that Qcycle, by avoiding division, is less sensitive to small variations in input data and produces a more stable signal for long-duration monitoring under semi-field conditions (Table 2).
In practical photovoltaic irrigation systems, partial charging and discharging events are expected due to variable solar irradiance and fluctuating pumping demand. In such situations, Qcycle should be summed over successive partial events until one equivalent full charge-discharge cycle is completed, in line with the widely adopted concept of Equivalent Full Cycles (EFC) in battery management [15,16]. With this implementation, temporary declines in daily charge throughput reflect operational conditions rather than intrinsic battery degradation, which allows Qcycle to remain representative of the available cell capacity.
In a Battery Management System (BMS), this implementation requires only continuous accumulation of charged and discharged ampere-hour throughput values, which are routinely measured by coulomb-counting algorithms. Once the cumulative throughput reaches one Equivalent Full Cycle (EFC), Qcycle can be updated without extra sensors or computationally intensive diagnostics. This makes the proposed metric compatible with existing BMS architectures for long-term field monitoring.
Other state-of-health (SoH) indicators (Table 2), including differential capacity (dQ/dV), entropy profiling, and voltage relaxation are commonly used in laboratory settings to detect subtle degradation mechanisms in lithium-ion batteries at high precision [17–19]. However, these methods typically rely on high-frequency voltage measurements, precise thermal regulation, or long rest periods between cycles, which makes them less compatible with long-duration studies conducted in naturally variable environments. Likewise, while the total number of charge/discharge cycles (Ncycle) is a widely used metric for comparing technologies (Table 3), particularly between Li-ion and lead-acid systems [20,21] offer little insight into partial cycling, energy throughput, or efficiency losses.
As summarized in Table 2, this study presents Qcycle as a practical and stable alternative, especially suited to long-term diagnostics under real-world conditions. Recent studies indicate that battery health assessment increasingly relies on combining complementary indicators that capture different degradation mechanisms, including cycling, calendar, and thermal aging [23]. In this framework, Qcycle is designed to complement, rather than replace, established laboratory-based diagnostic techniques. By emphasizing resistance to data noise and compatibility with uninterrupted cycling, Qcycle enables reliable performance tracking without the stringent control requirements of traditional SoH metrics. This strengthens its relevance for semi-field applications in regions such as the Sahel, where reliable year-round evaluation of energy storage systems is needed to support solar-powered infrastructure.
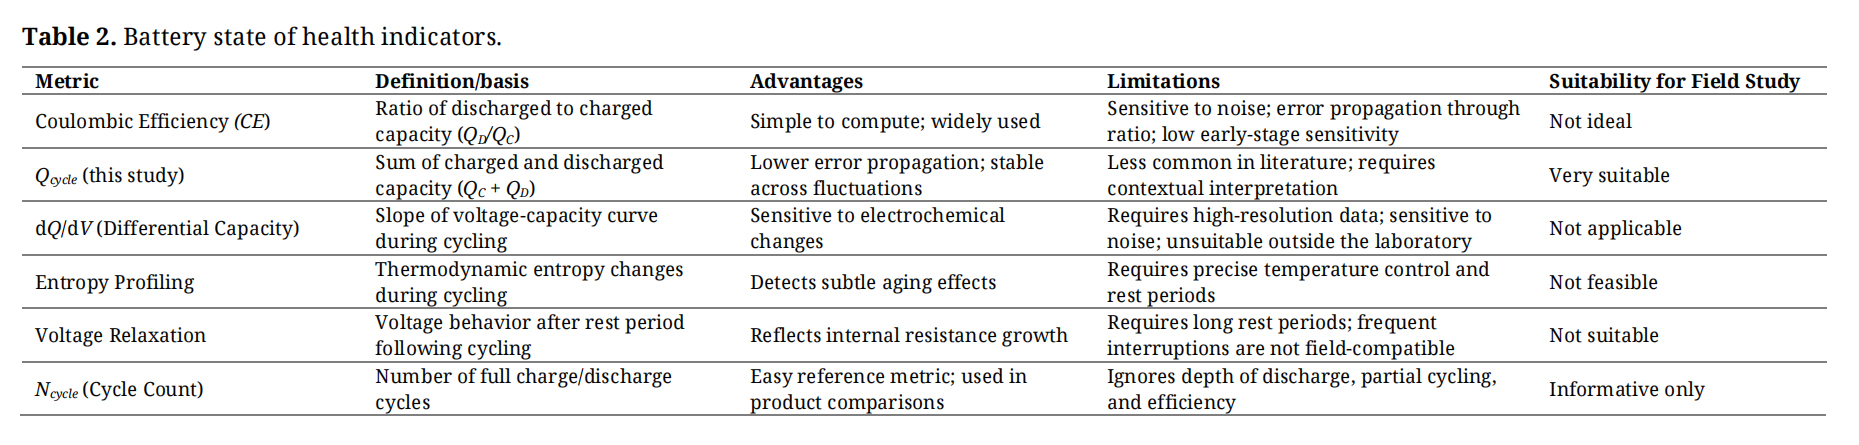 Table 2. Battery state of health indicators.
 Table 3. Characteristics of the two most common battery technologies on the market.
In addition to electrochemical data, the influence of ambient temperature and relative humidity, known contributors to lithium-ion degradation, was continuously tracked using a USB data logger [24]. These environmental factors were analyzed using time-series plots, Pearson correlation analysis, and Principal Component Analysis (PCA).
All tests were conducted over a continuous five-month period, spanning both dry and rainy seasons. This duration ensured that the results reflected a realistic range of Sahelian environmental conditions. By integrating electrochemical response, environmental stressors, and operational variability, the methodology aimed to provide a reliable, field-relevant evaluation of LiFePO4 battery performance in solar-powered applications.
The end-of-life criterion was defined from preliminary trials revealing that devices connected to series-connected sets of four batteries ceased operating when voltage fell below 3 V. At that point, stored energy amounted to approximately 20% of nominal capacity. Because Qcycle represents approximately double the nominal capacity, the end-of-life threshold was set at Qcyclemin = 40% of the cell’s initial cycle capacity (Qcycle0), corresponding to a remaining battery capacity of approximately 80% of nominal rated capacity (SoH = 80%), a widely accepted industry standard for defining battery end-of-life.
Data Collection and Environmental MonitoringData were collected using EB Tester Software (version 5.1), with data extracted monthly using USB storage devices. The charged capacity QC (Ah) and discharged capacity QD (Ah) were recorded for each cycle, together with voltages and currents at the start and end of each cycle. Environmental parameters were measured using a TempU08B USB data logger configured to log temperature and relative humidity at 15-min intervals throughout the five-month testing period.
The study was conducted under semi-field conditions representative of Sahelian environments, where electricity access, ambient temperature, and humidity levels varied naturally. No artificial environmental controls or climate chamber were used; all data were collected under real ambient conditions. Temperature ranged from 26.8 °C to 40 °C, and relative humidity varied from 19% to 77.9%, reflecting typical Sahelian climatic conditions [25]. Unlike the Sahara, where extreme diurnal temperature variations cause drastic fluctuations, the Sahel experiences moderate variations with nighttime temperatures rarely dropping below 20 °C [26,27]. This distinction is important for assessing lithium-ion battery degradation, because extreme cold is not a significant concern in this region [28].
Statistical Analysis Time Series AnalysisTime series analysis was performed using Microsoft Excel 2019 to plot trends for Coulombic Efficiency (CE), cycle capacity (Qcycle), ambient temperature, and relative humidity. Trends were assessed visually and through descriptive statistics to identify degradation patterns and environmental effects.
Principal Component AnalysisPrincipal Component Analysis (PCA) was conducted using XLSTAT version 2019.2.2 [29,30] to examine relationships between time t, battery capacity Qcycle (Ah), temperature (°C), and relative humidity (%). Data were organized with each variable as a column and each observation as a row. After the formatting was verified, the data were standardized (z-score normalization) because variables were measured on different scales, thereby ensuring comparability.
The PCA was conducted with these four variables as active variables. Eigenvalues were analyzed to determine the number of significant principal components, and components with eigenvalues greater than 1 were retained. Factor loadings were examined to identify which variables contributed the most to each principal component, indicating potential correlations and patterns of variation. Biplots and scree plots [31] were generated to visualize relationships and variations, enabling a comprehensive interpretation of the PCA results.
Nonlinear Regression ModelingBattery lifespan was modeled using nonlinear regression and an exponential decay function applied to Qcycle data over time. The model was implemented in XLSTAT version 2019.2.2 [29,30] using the following equation [32,33]:
where Qcycle (Ah) is the battery cell capacity exchanged during each cycle, Qc0 (Ah) is the initial cycle capacity at the start of testing, b is the decay rate constant (b > 0), and t (h) is time.
A defined sampling strategy supported model robustness. For R-cells (daily cycles), 30 observations were randomly selected from 140 total observations for validation, leaving 116 for model calibration. For S-cells (4-day cycles), 10 observations were randomly selected from 35 available data points for validation, leaving 25 for calibration. XLSTAT iteratively adjusted parameters to minimize differences between observed and predicted Qcycle values using the Levenberg-Marquardt algorithm, providing estimates of Qc0 and b and their standard errors.
Goodness of fit was assessed using the coefficient of determination (R2), mean squared error (MSE), and root mean squared error (RMSE) [34,35]. Diagnostic plots of residuals were examined to validate model assumptions and verify the model’s suitability for describing the data. Lifespan projections were calculated with Excel’s Goal Seek function to determine the time t corresponding to the target value Qcmin (40% of Qc0), with results converted from hours to years.
The cycle curves shown in Figures 2 and 3 show distinct features in the charging and discharging behavior of the lithium-ion cells studied. In the rapid charging scenario depicted in Figure 2, the charge curve initially shows a bulk intercalation phase (1) between 3.30 and 3.40 V, during which approximately 37.25% of the cell’s nominal capacity (280 Ah) is charged. This phase is followed by a first plateau intercalation phase (2) between 3.40 and 3.43 V, contributing about 23.70% of the total charge. Finally, a second slower intercalation phase (3) occurs between 3.43 and 3.44 V, in which approximately 33.55% of the capacity is added. These observations are consistent with prior studies [36,37], which report similar multi-step voltage behavior in LiFePO4 chemistry associated with phase transitions and lithium staging within the cathode material.
The discharge process, as depicted in Figure 2, also consists of three phases. It begins with the first deintercalation phase (4), during which 29.61% of the capacity is discharged from the battery between 3.31 and 3.3 V. This is followed by the second deintercalation phase (5), shown by the second plateau between 3.3 and 3.25 V, during which 37.23% of the cell’s capacity is removed. The final residual discharge phase (6) occurs between 3.25 and 3.10 V, during which 29.51% of the capacity is extracted. These phases are consistent with the discharge profiles described by Hu et al. (2011) [38] and Han et al. (2019) [39], who describe the distinct stages of lithium-ion battery discharge and their impact on overall battery performance and longevity.
The discharge process of the S-cells similarly has three distinct phases (Figure 3). Initially, the first deintercalation phase (4), occurring between 3.31 and 3.3 V, extracts approximately 30.46% of the battery’s capacity. This pattern agrees with findings by Khairunnisa and Mafturoh (2023) [40], who report similar initial discharge characteristics in their study of lithium iron phosphate batteries under rapid cycling conditions. The second deintercalation phase (5), represented by the second plateau between 3.3 and 3.25 V, discharges an additional 37.41% of the cell’s capacity. This phase is comparable to those observed in other studies [40–42], where a stable plateau region indicates efficient energy extraction during the mid-discharge cycle. Finally, the residual discharge phase (6) of the S-cells, spanning from 3.25 to 3.10 V, discharges 29.27% of the cell’s capacity.
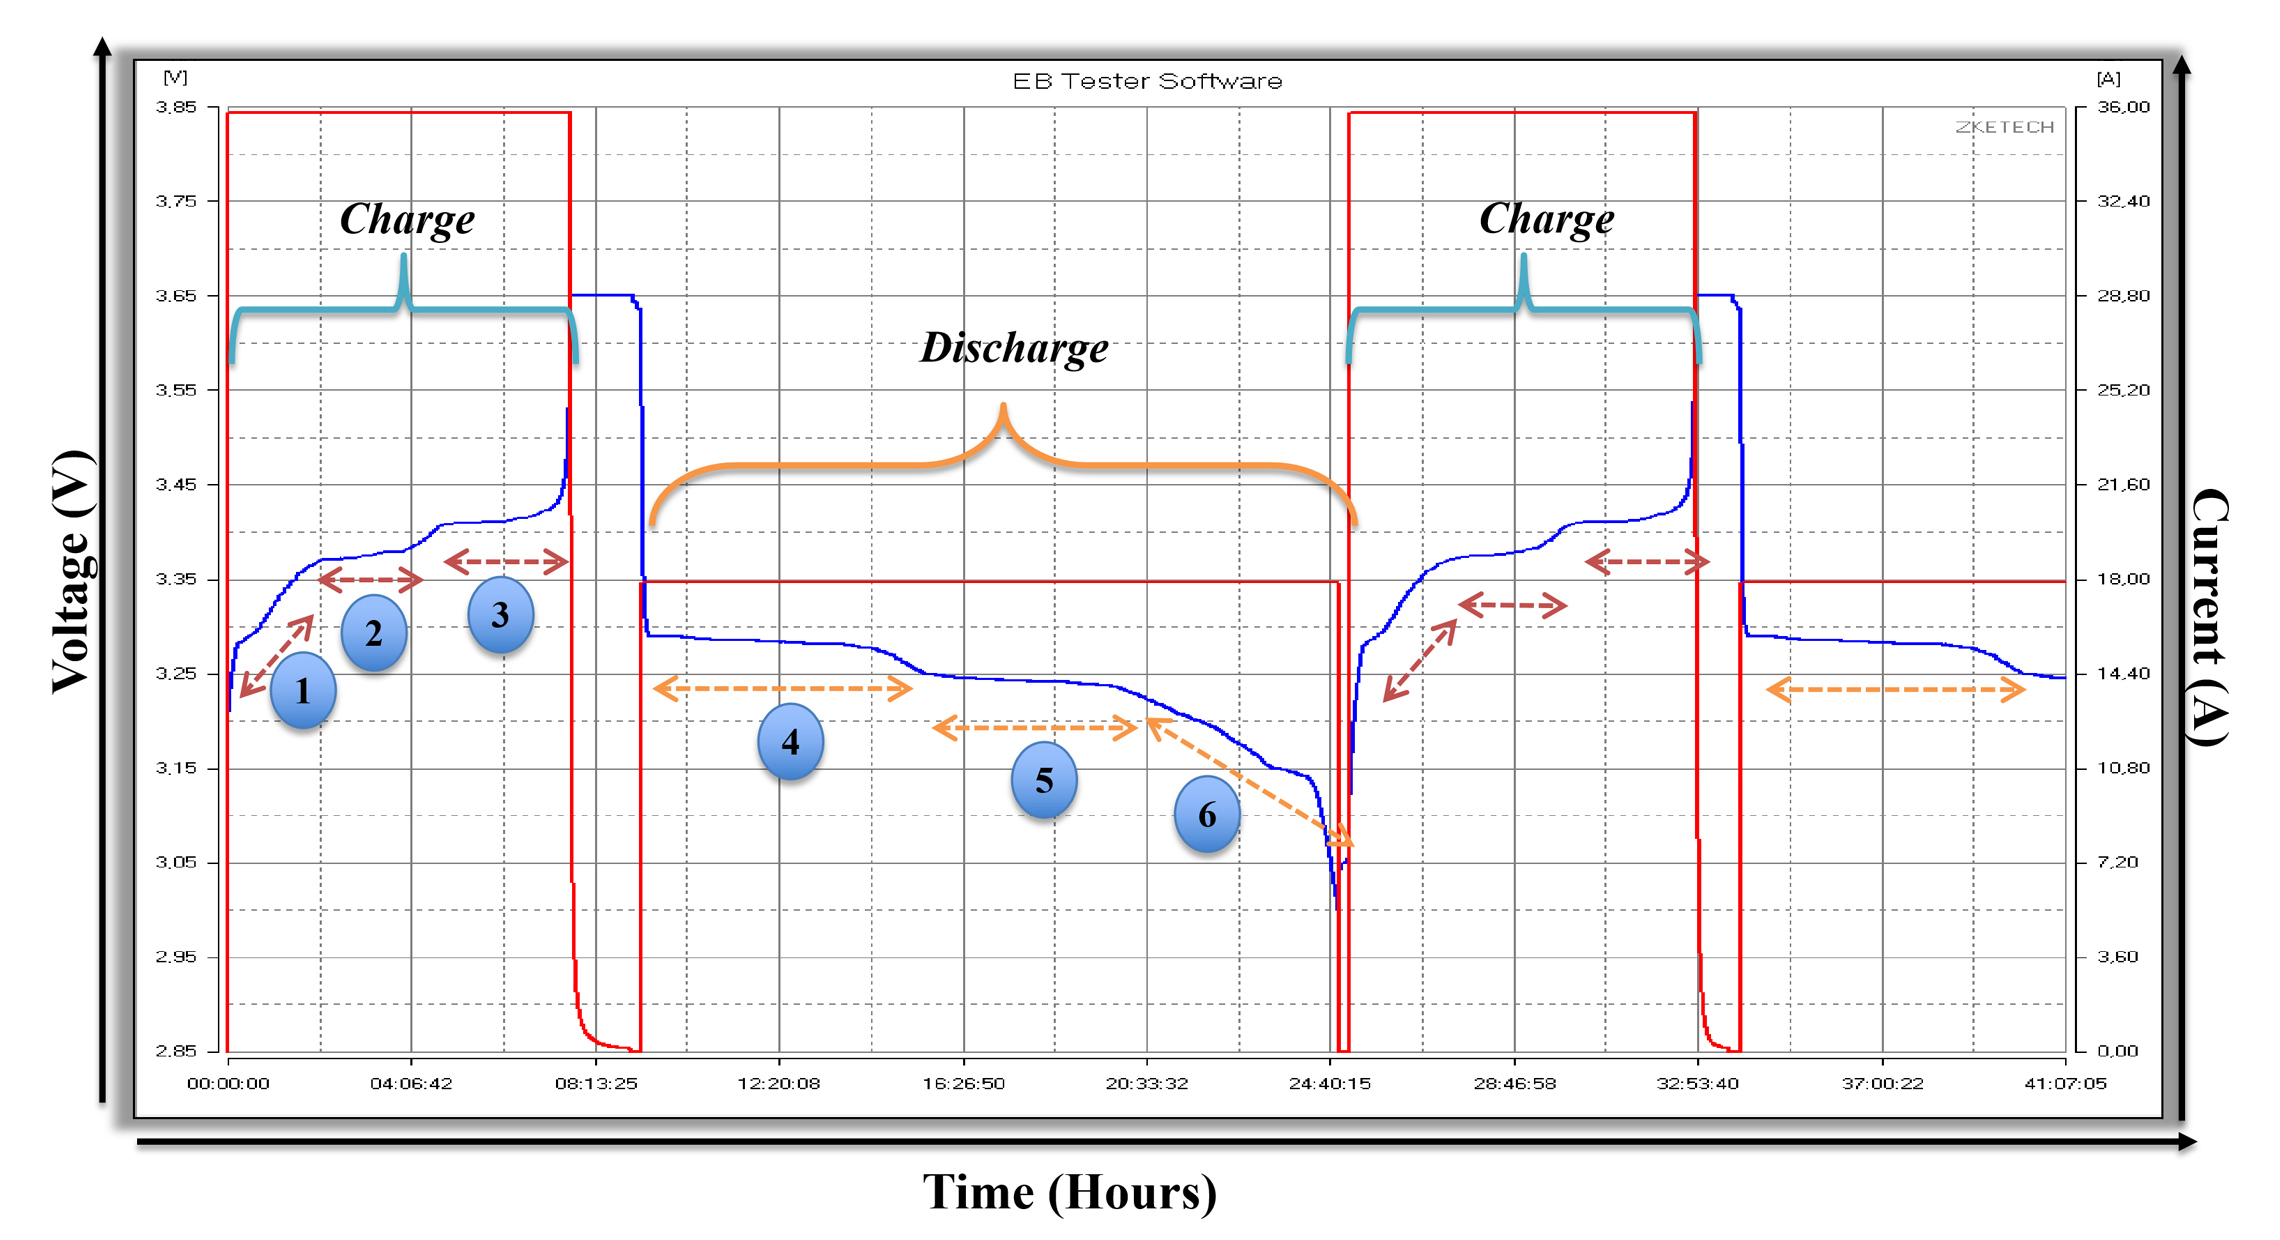 Figure 2.
R-cell operating cycle under the rapid scenario. The numbers indicate the following phases: (1) raw charge phase, (2) first intercalation phase, (3) second intercalation phase, (4) first deintercalation phase, (5) second deintercalation phase, (6) residual discharge phase.
Figure 2.
R-cell operating cycle under the rapid scenario. The numbers indicate the following phases: (1) raw charge phase, (2) first intercalation phase, (3) second intercalation phase, (4) first deintercalation phase, (5) second deintercalation phase, (6) residual discharge phase.
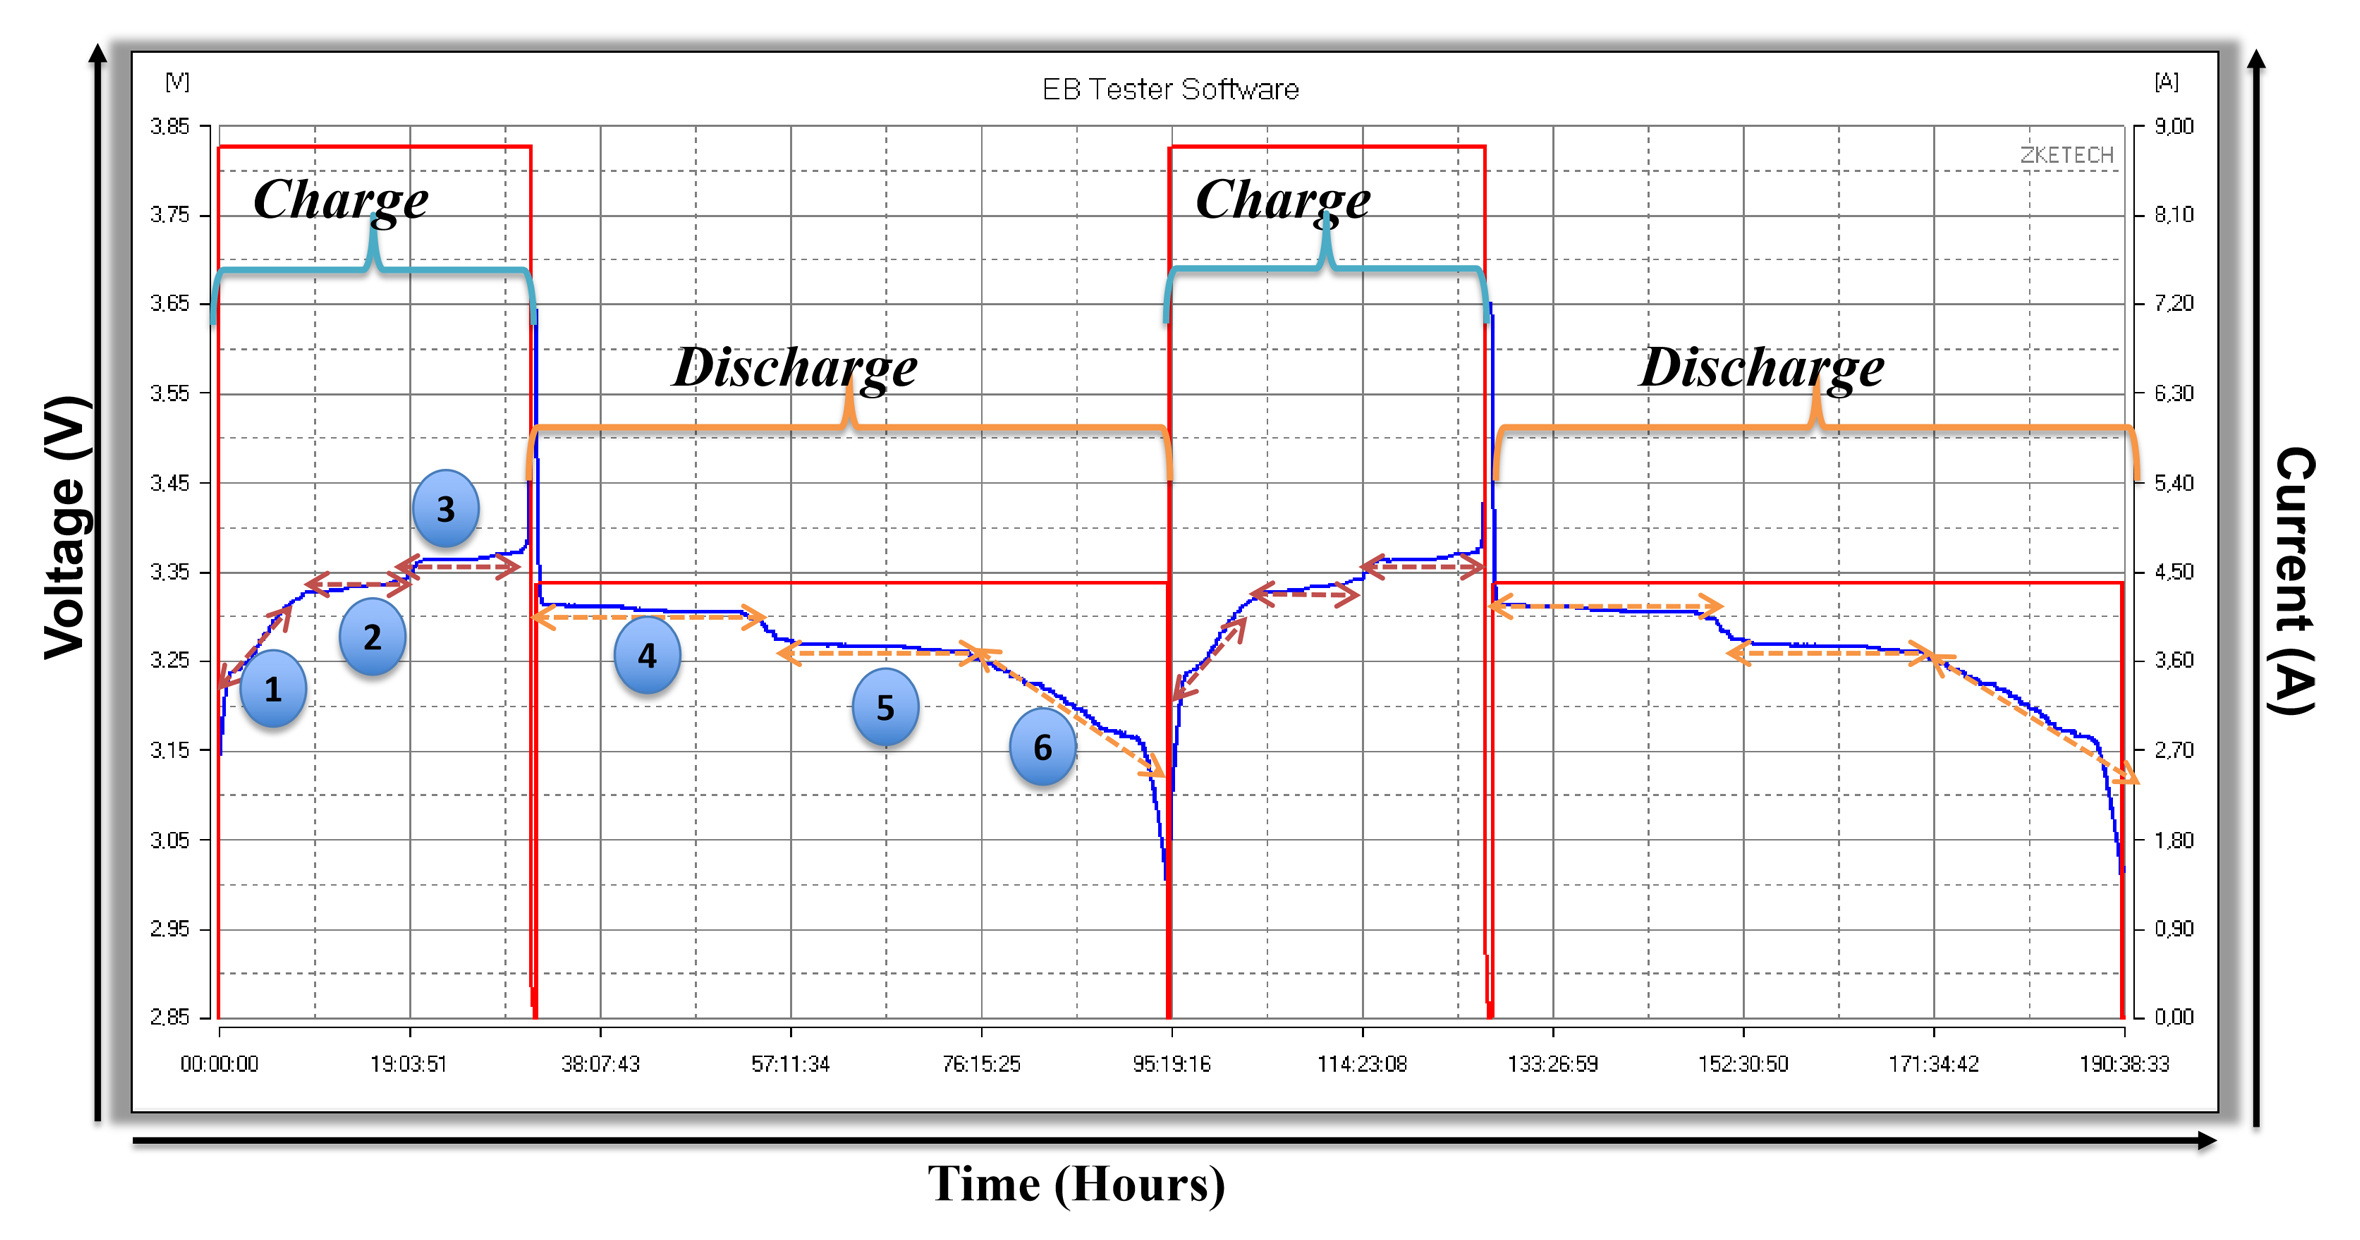 Figure 3.
S-cell operating cycle under the slow scenario. The numbers indicate the following phases: (1) raw charge phase, (2) first intercalation phase, (3) second intercalation phase, (4) first deintercalation phase, (5) second deintercalation phase, (6) residual discharge phase.
Figure 3.
S-cell operating cycle under the slow scenario. The numbers indicate the following phases: (1) raw charge phase, (2) first intercalation phase, (3) second intercalation phase, (4) first deintercalation phase, (5) second deintercalation phase, (6) residual discharge phase.
The cycle trajectory is similar for both R and S cells, which are subjected, respectively, to high current (35.76 A/17.87 A) and low current (8.79 A/4.39 A) charge/discharge processes. This is evident from three phases (Figure 2 and 3), with the first phase during charging and the final phase during discharging having steep gradients. In contrast, two plateaus (numbers 2 and 3) occur in the charging section, and two plateaus (numbers 4 and 5) in the discharging section. For the R cells, the plateau or intercalation phases during charging represent nearly 60% of the total capacity, with a constant voltage around 3.4 V. Similarly, the two plateaus during discharging release almost 70% of the total stored energy while maintaining a constant voltage around 3.3 V. This performance is consistent with findings reported by Hu et al. (2011) [38] and Lin et al. (2022) [43], who also reported high efficiency and stability in LiFePO4 batteries during charge and discharge cycles.
Effectiveness of Coulombic Efficiency as a Degradation IndicatorThe change in Coulombic Efficiency (CE) values across all LiFePO4 cells over five months (May–September 2022) is illustrated in Figure 4. The solid curves depict R-cells subjected to high current, while the dotted curves show chronological variations in S-cells under low current. R-cells underwent 146 cycles of 24-h charge and discharge periods, whereas S-cells underwent 35 cycles of 96-h charge/discharge periods. Despite both types of cells coming from the same supplier, the observed discrepancy between the two solid line curves of the R-cells indicates differences in their capacities. Despite these differences, the results indicate that neither R nor S cells showed a clear declining trend in coulombic efficiency (CE) from their initial value close to 1, and therefore failed to reveal ongoing degradation. CE for R-cells oscillated between 0.9967 and 1.0011, whereas for S-cells, values ranged from 0.9982 to 1.0000. This finding appears paradoxical since CE typically decreases over time from 1, rather than increasing.
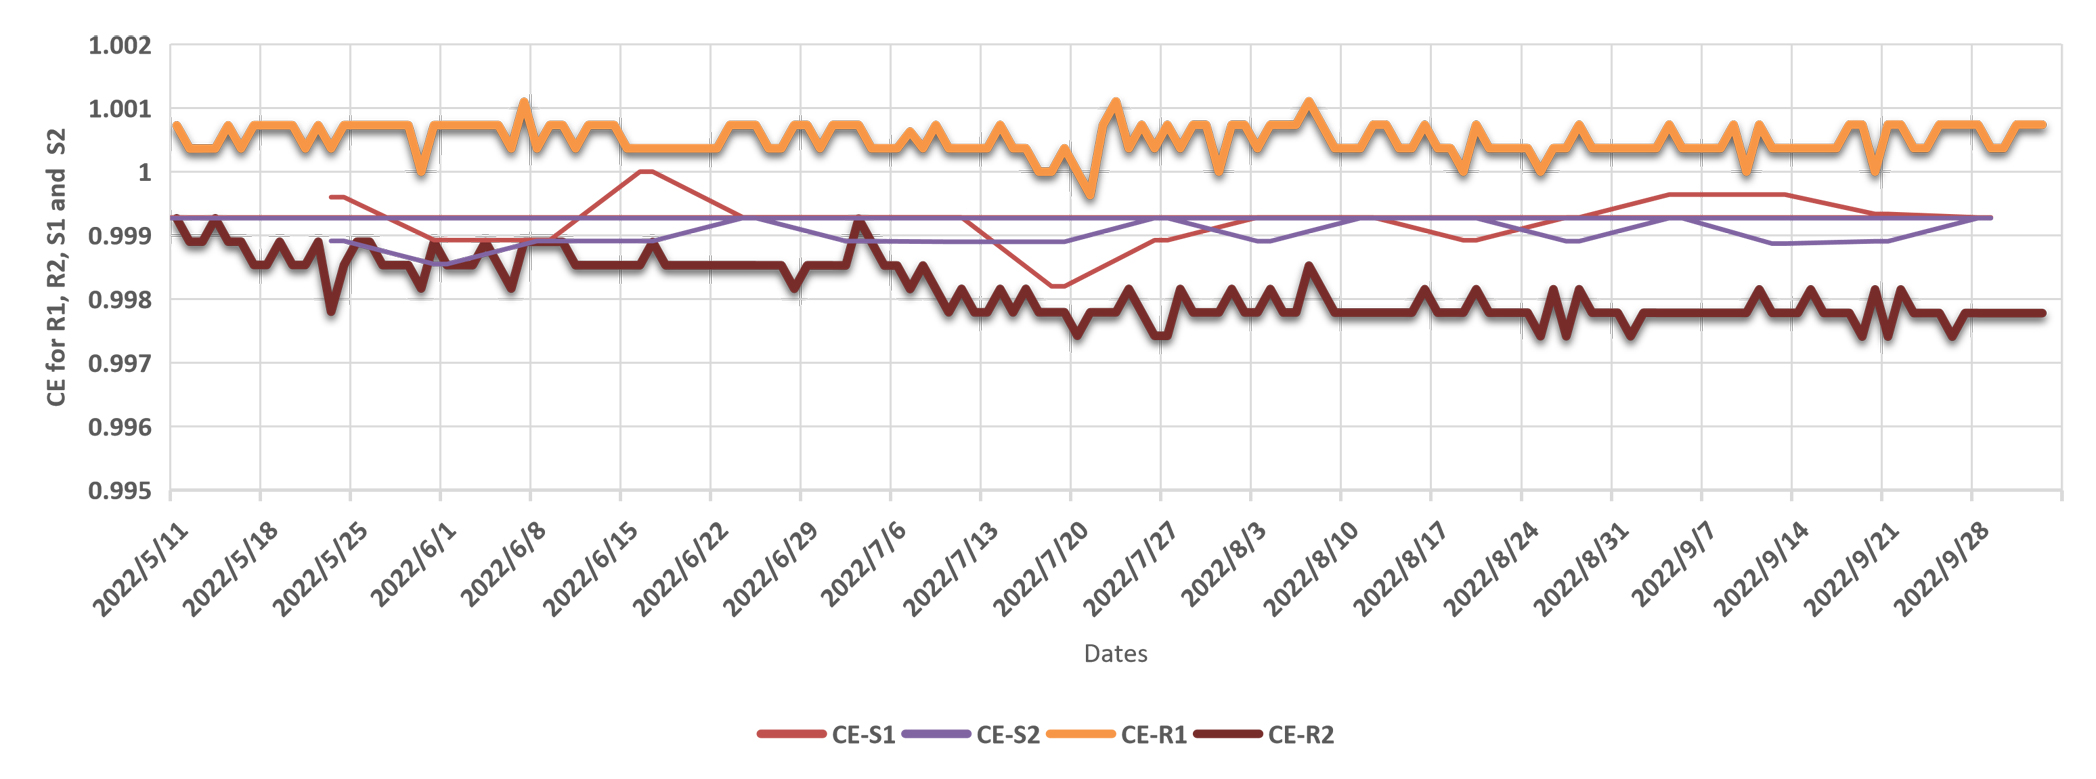 Figure 4. Variation in Coulombic Efficiency (CE).
Similar observations were reported by Dong et al. (2021) [44], who also observed inconsistent CE fluctuations. Although their measurement devices differ from the four A40L testers used in this study, it is unlikely that all four independent devices would have identical issues, as suggested by the graph patterns. Therefore, the Coulombic Efficiency (CE) indicator appears inadequate for tracking battery degradation under the tested field conditions.
Monitoring Cell Degradation Using QcycleThe change in Qcycle values (total charged energy plus total discharged energy) for LiFePO4 lithium-ion battery cells is shown in Figure 5. R-cells subjected to high currents are shown as lines, while S-cells subjected to low currents are represented by points. The clear and progressive decrease in Qcycle is evident in Figure 5. Over a five-month period, comprising 146 cycles of 24 h for R-cells and 35 cycles of 96 h for S-cells, Qcycle decreased by 7.8 Ah for R1, 7.0 Ah for R2, 3.9 Ah for S1, and 4.3 Ah for S2. This degradation is more pronounced in cells subjected to higher currents and a greater number of cycles. The exponential nature of the decline across all four curves indicates a consistent loss of individual cell capacities. This contrasts with the Coulombic Efficiency (CE) graphs, which showed no clear capacity decline during the testing period. Table 4 presents the capacity losses of the studied LiFePO4 cells. On average, the energy available per cycle decreased by 6.25 ± 1.84 Ah over 5 months for all four cells, reflecting their reduced capacities.
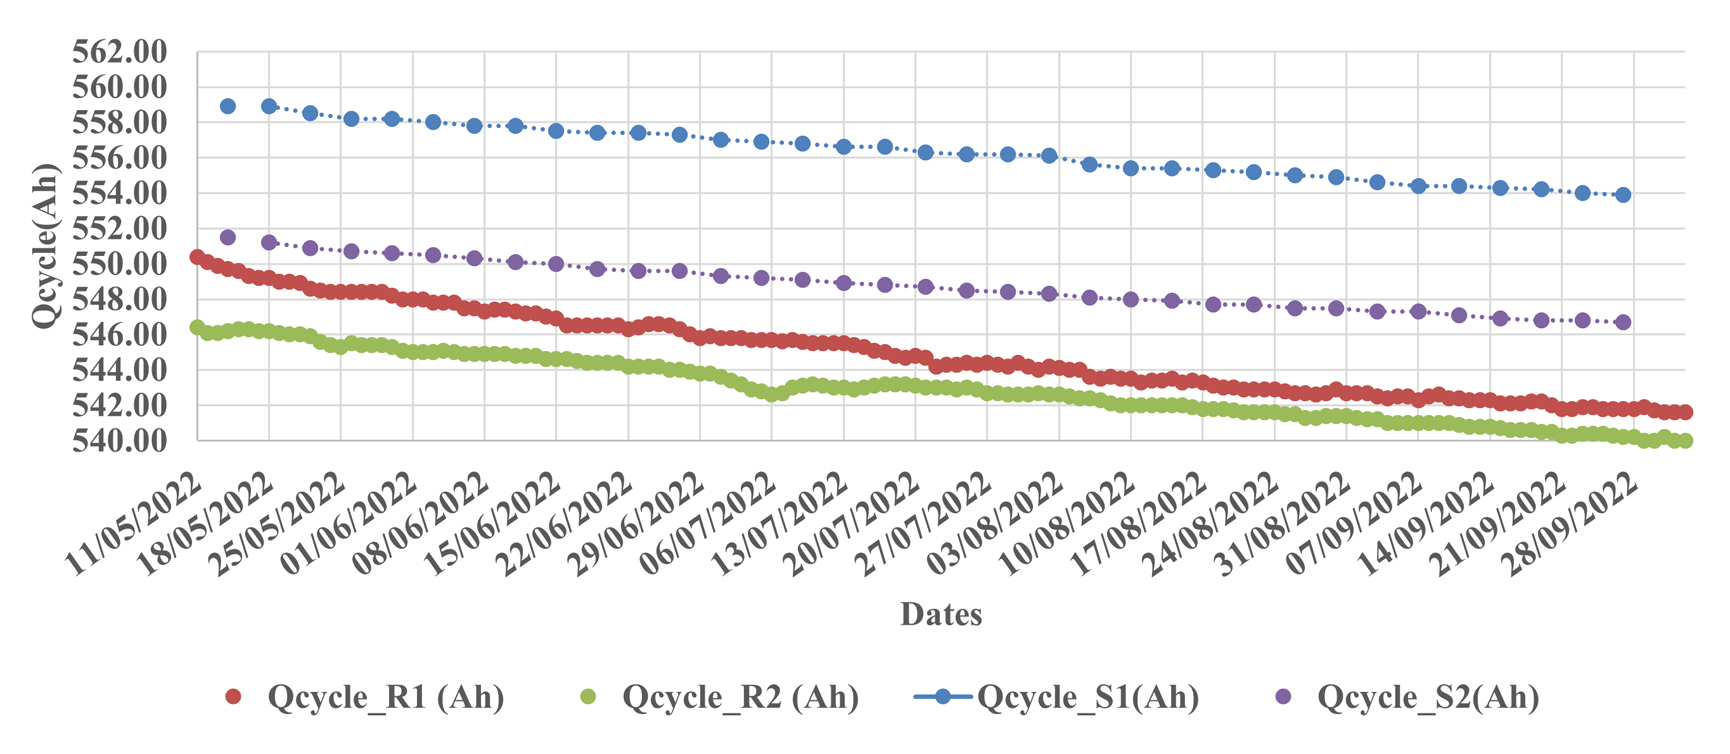 Figure 5. Variation in Qcycle cell capacity.
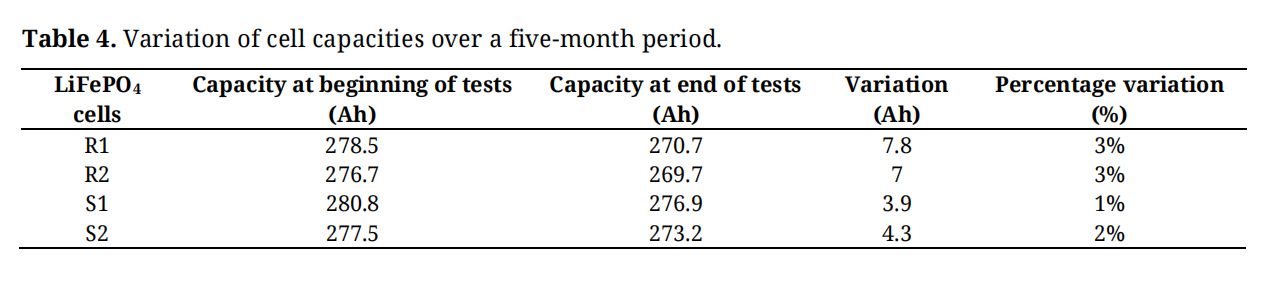 Table 4. Variation of cell capacities over a five-month period.
Under the experimental conditions, ambient temperatures and relative humidity within the open-air laboratory varied from 40 °C and 19% during the dry season (May) to 26.8 °C and 77.9% in September near the end of the rainy season. Figure 6 shows significant variations in temperature and relative humidity occurred between June 6 and June 9. Specifically, the maximum temperature dropped from nearly 40 °C on June 6 to 31 °C on June 8, while the maximum relative humidity increased from 37% on June 6 to 69% on June 9. These abrupt changes were attributable to the onset and establishment of the rainy season, which typically begins in late May and ends in late September or early October [45,46].
Qcycle capacity decreased in parallel with the temperature, while relative humidity increased during this decline in Qcycle. Although this phenomenon suggests a possible correlation, it does not establish causality between temperature decrease or relative humidity increase and the degradation of LiFePO4 lithium-ion cells. Notably, as illustrated in Figures 6A–D, the observed variations in temperature and relative humidity did not noticeably disrupt the degradation process as measured by Qcycle capacity of the LiFePO4 battery cells, whether they were subjected to high current (R-cells) or low current (S-cells) operating conditions.
Pearson correlation coefficient values are presented after the summary statistics in Tables 5 and 6. The temperature was strongly and positively correlated with cycle capacity Qcycle, while relative humidity was strongly and negatively correlated. The correlation coefficients for maximum temperature were 0.82 for R1, 0.78 for R2 (Table 5), 0.78 for S1, and 0.81 for S2 (Table 6). Similarly, relative humidity was strongly and negatively correlated with cycle capacity Qcycle. The correlation coefficients for maximum relative humidity were −0.79 for R1, −0.76 for R2 (Table 5), −0.75 for S1, and −0.79 for S2 (Table 6). The same relationships were observed with the minimum values of temperature and relative humidity.
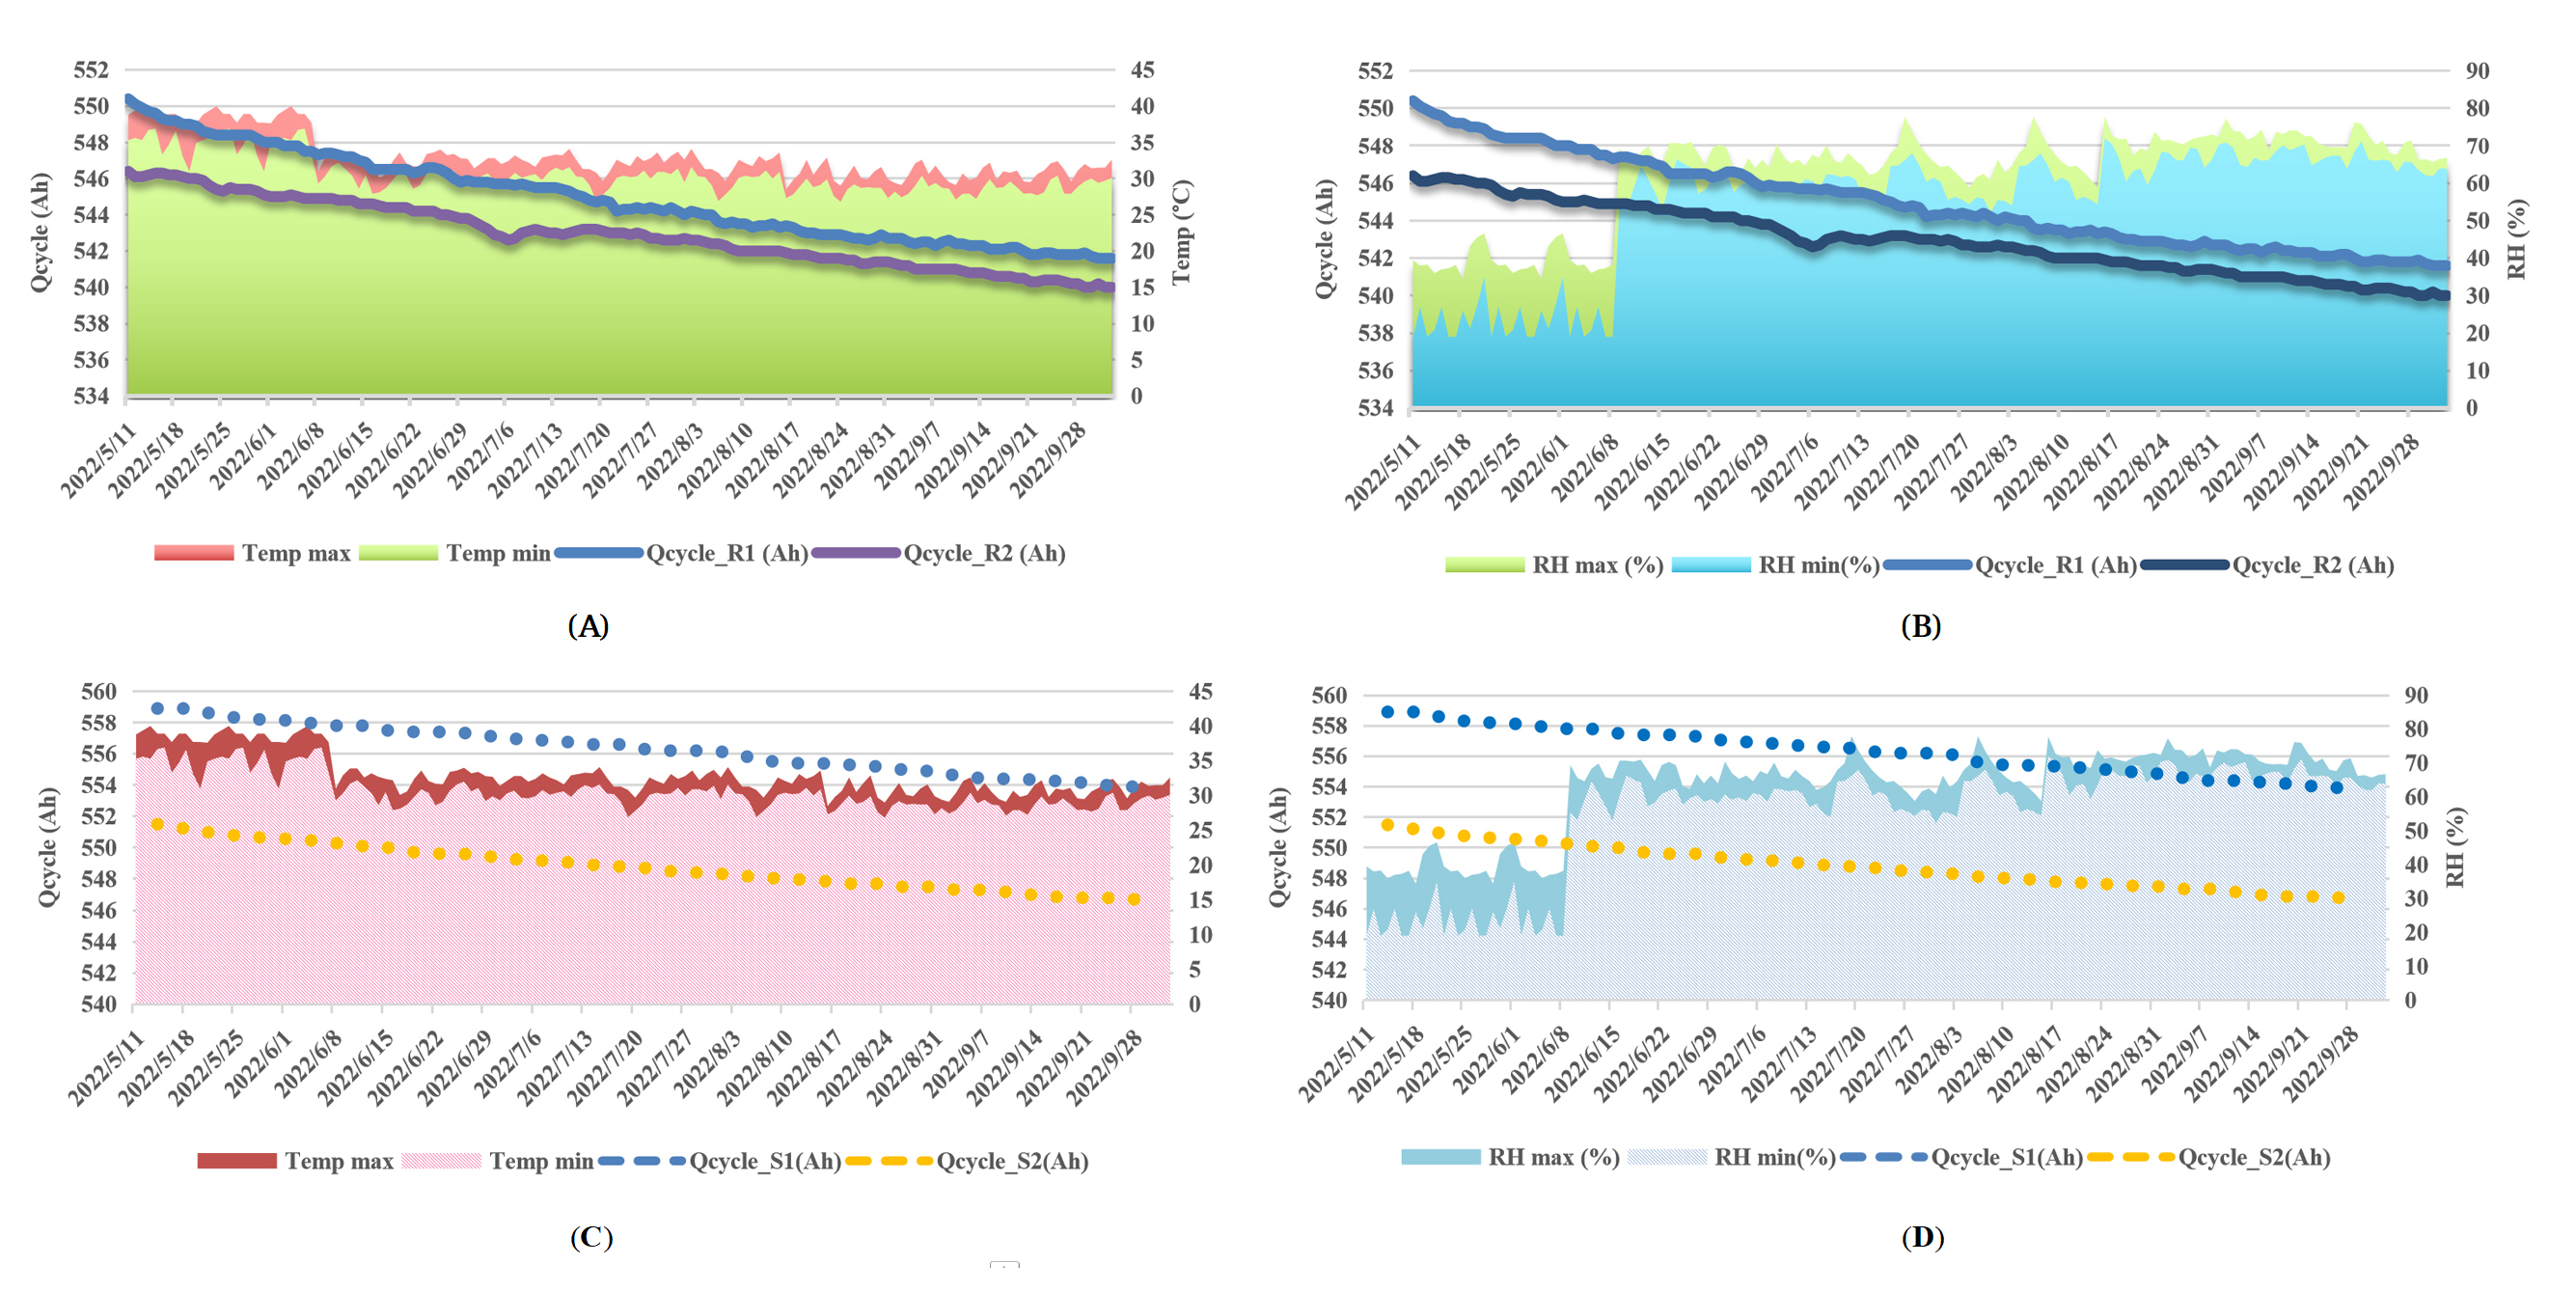 Figure 6.
Temporal co-evolution of temperature (A,C), relative humidity (B,D), and Qcycle capacity of LiFePO4 cells under high current (R-cells) and low current (S-cells) conditions.
Figure 6.
Temporal co-evolution of temperature (A,C), relative humidity (B,D), and Qcycle capacity of LiFePO4 cells under high current (R-cells) and low current (S-cells) conditions.
The relationships among the six operational and environmental variables (time t, Qcycle, Temp Max, Temp Min, RH Max, and RH Min) are summarized in Figures 7 and 8 using Principal Component Analysis (PCA). The first two components, F1 and F2, captured the dominant variance patterns in battery behavior, accounting for 96.85% of the total variability in R1 and R2 cells and 88.17% in S1 and S2 cells. This high explanatory power confirms the consistency of the observed patterns across both battery groups. Notably, F1 alone accounted for 87.07% (R-cells) and 88.17% (S-cells) of the total variance, which made it the primary component of interest.
The first principal component (F1) was positively correlated with both Qcycle and temperature (Temp Max and Temp Min), while time t and relative humidity (RH Max and RH Min) had negative loadings. This distribution showed that, within the observed range of 26.8 °C to 40.0 °C, Qcycle was positively associated with temperature, while time and relative humidity were negatively associated with Qcycle over the experimental period. These statistical associations are consistent with previous reports describing improved electrochemical kinetics at moderate temperatures and the potential influence of humid environments on battery aging [47–49]. However, because time, temperature and humidity varied together naturally during the seasonal transition covered by this study, PCA alone did not establish independent causal relationships between these environmental variables and battery degradation.
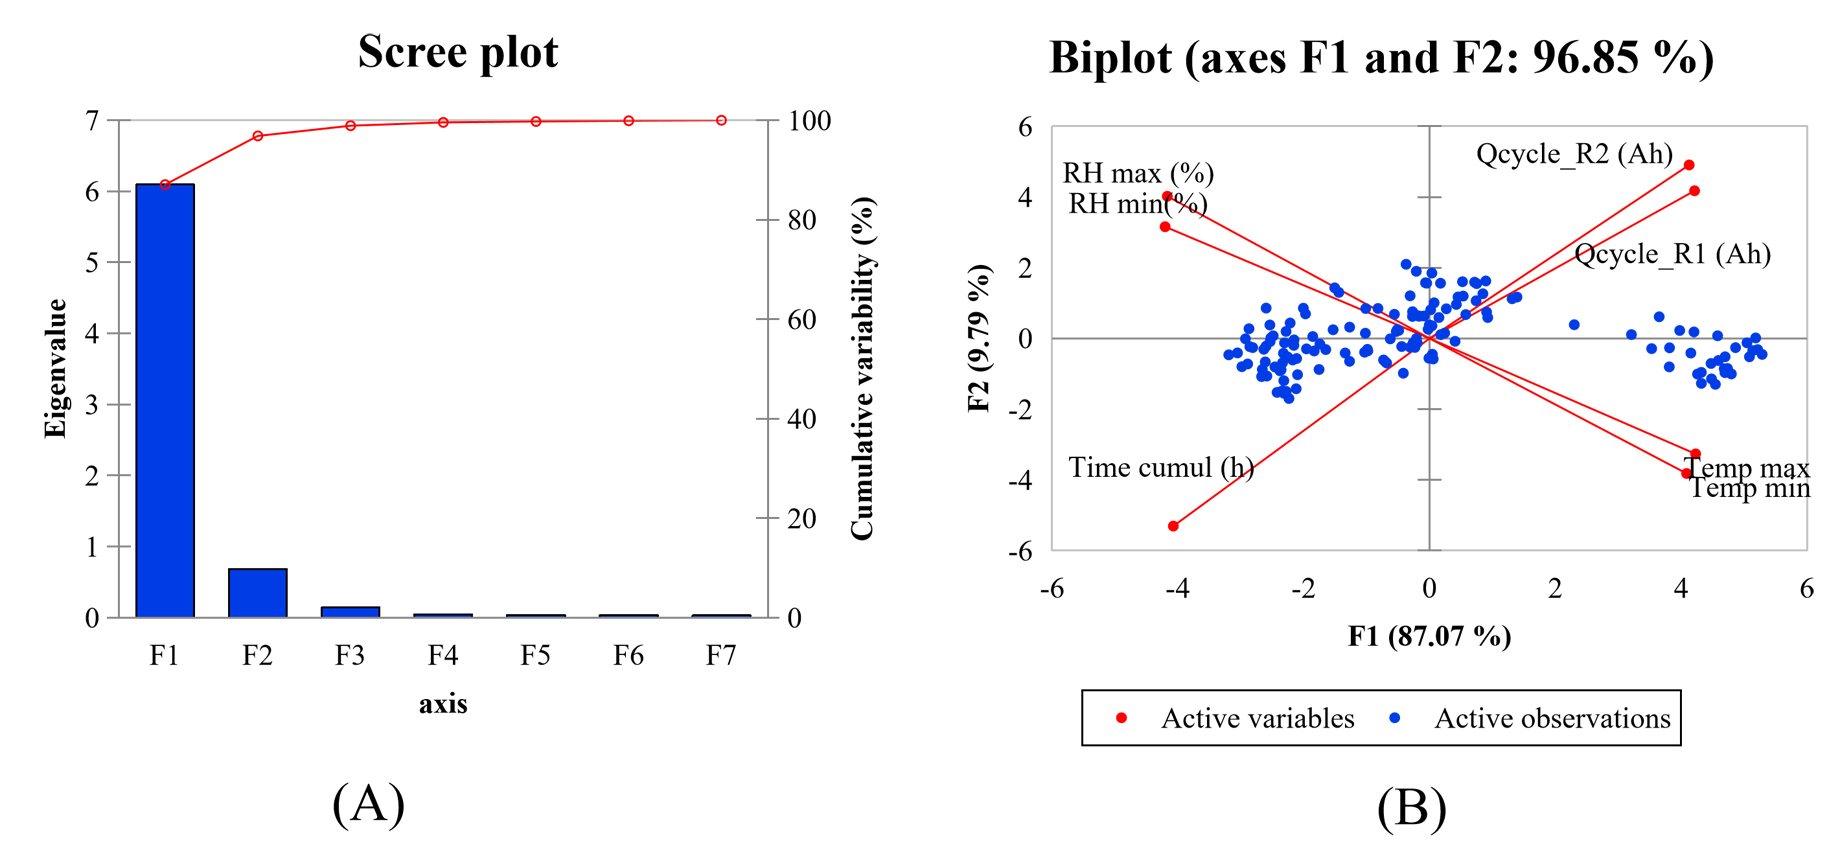 Figure 7. PCA results for R-cells. (A) Principal axes. (B) Variable loadings.
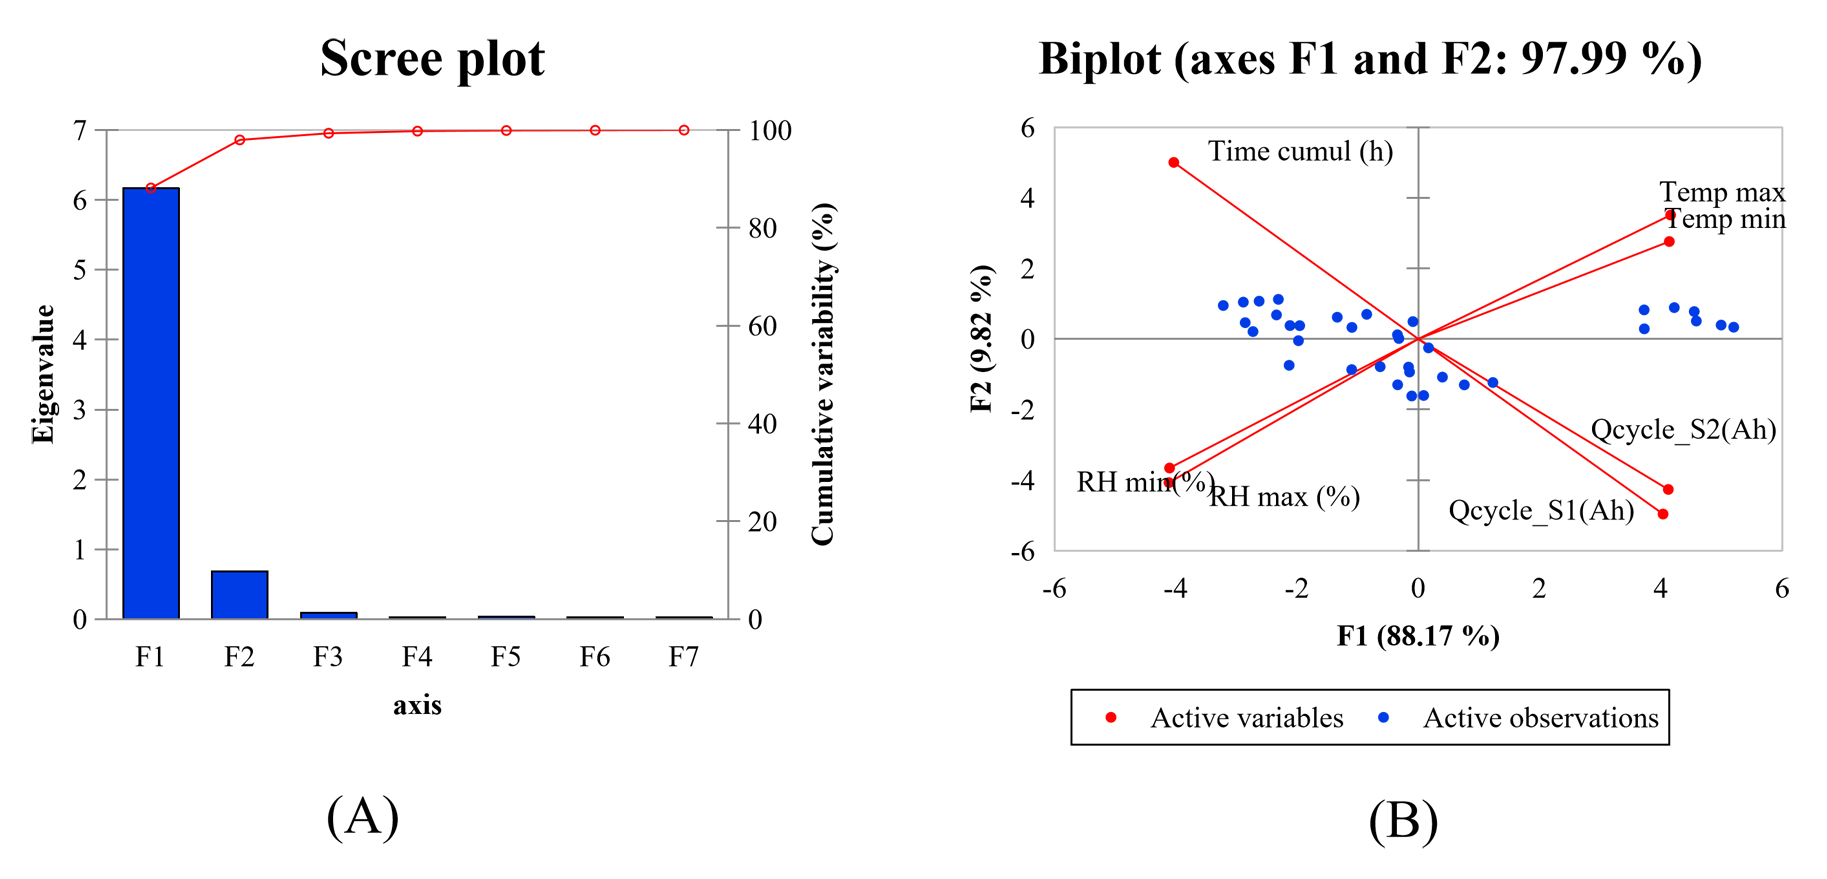 Figure 8. PCA results for S-cells. (A) Principal axes. (B) Variable loadings.
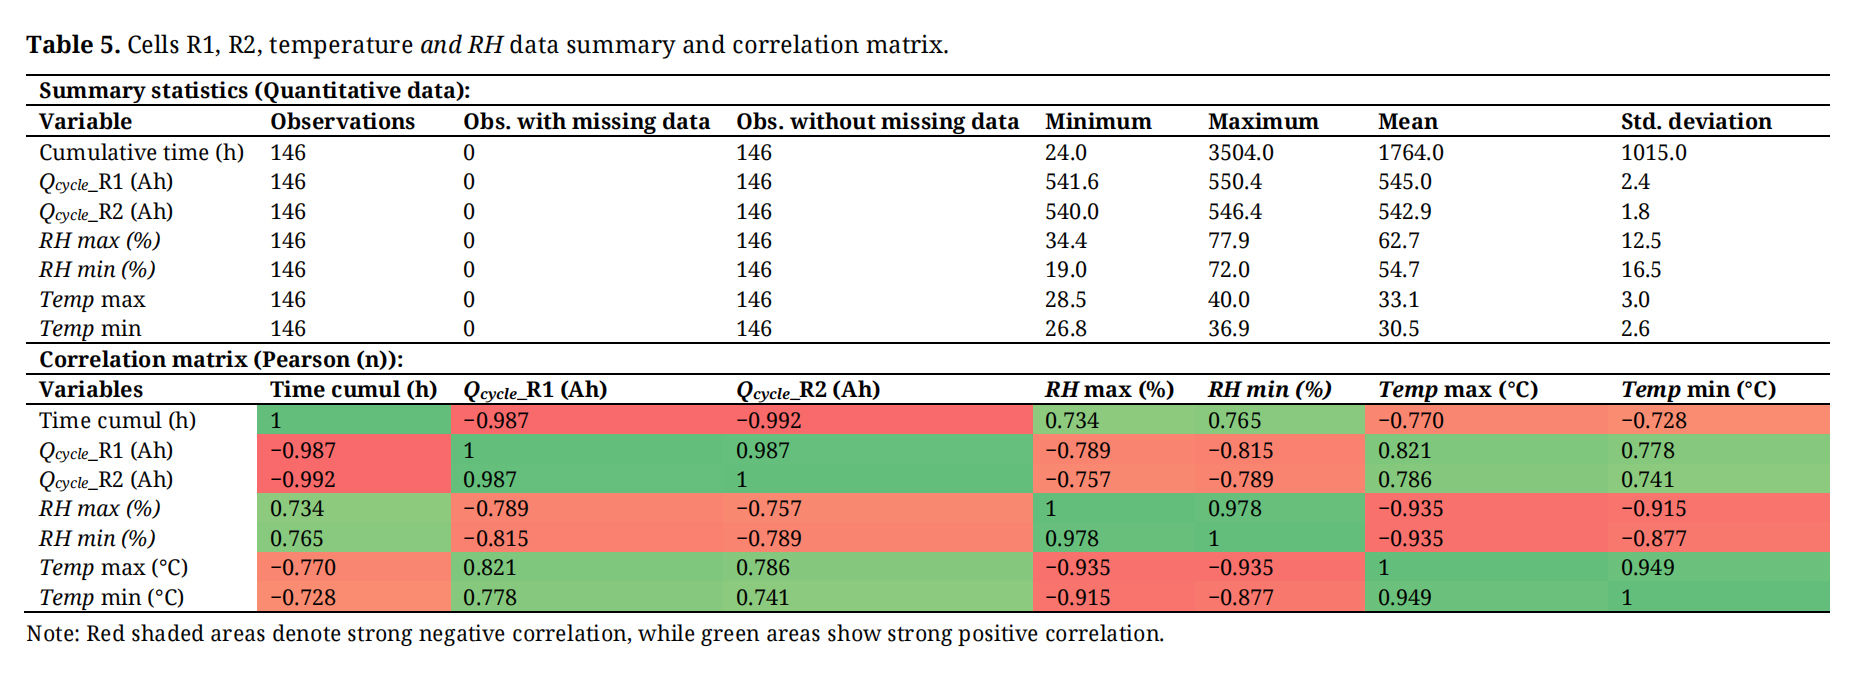 Table 5. Cells R1, R2, temperature and RH data summary and correlation matrix.
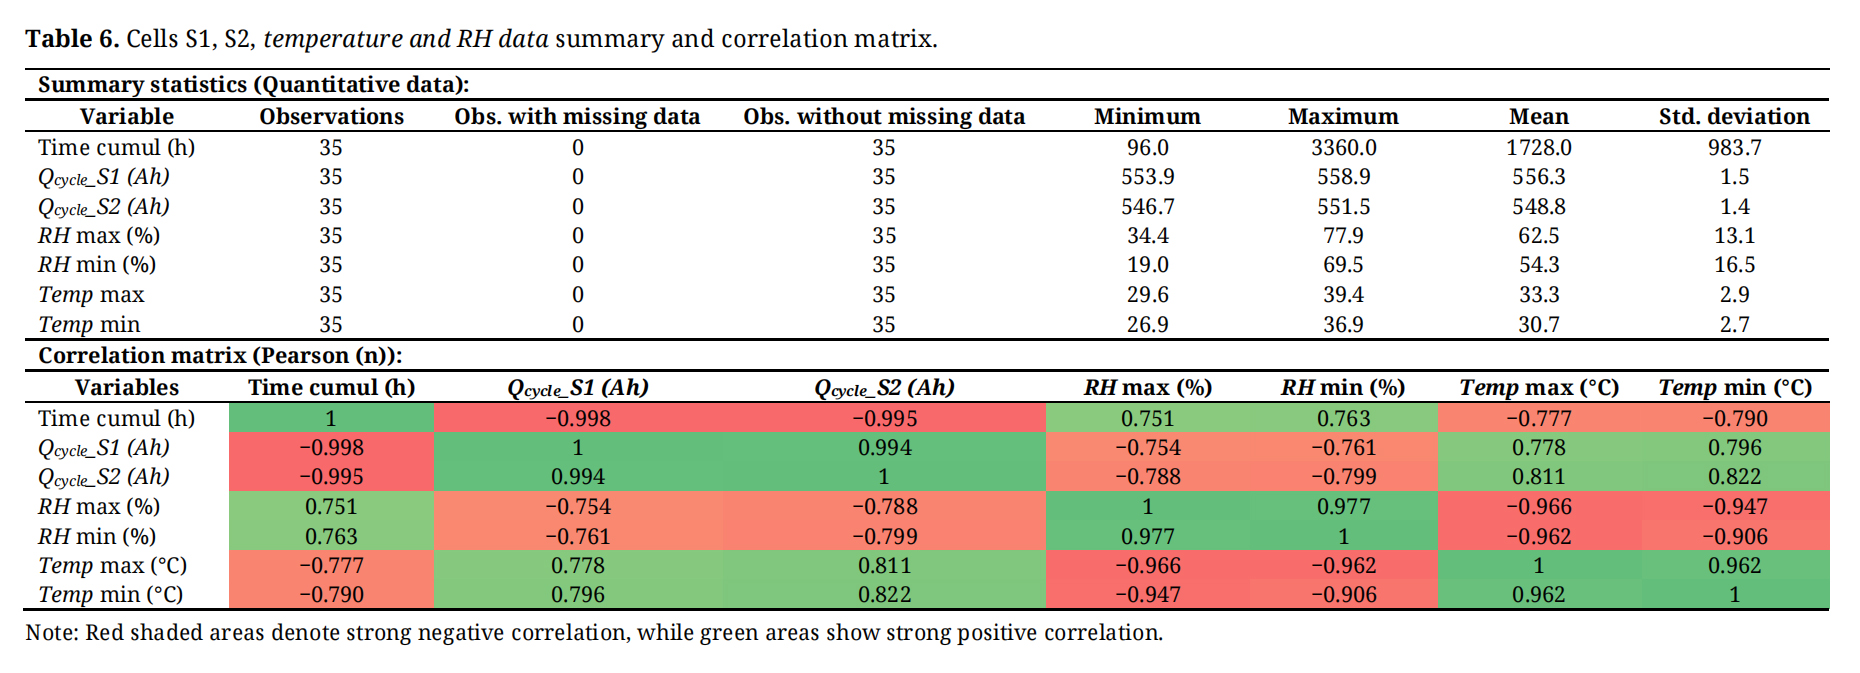 Table 6. Cells S1, S2, temperature and RH data summary and correlation matrix.
The results of applying the exponential decay model to the Qcycle capacity data over time for the R-cells show a good curve fit to the data for both R cells, with symmetrically distributed residuals around zero for both the 116 observations used to calibrate the model and the 30 randomly selected observations for model validation. The equations for the R-cells are displayed in Table 7, with respective determination coefficients (R2) of 0.97 for R1 and 0.98 for R2, and MSE and RMSE values very close to zero. This confirms the suitability of the exponential decay model in capturing variation in Qcycle over time.
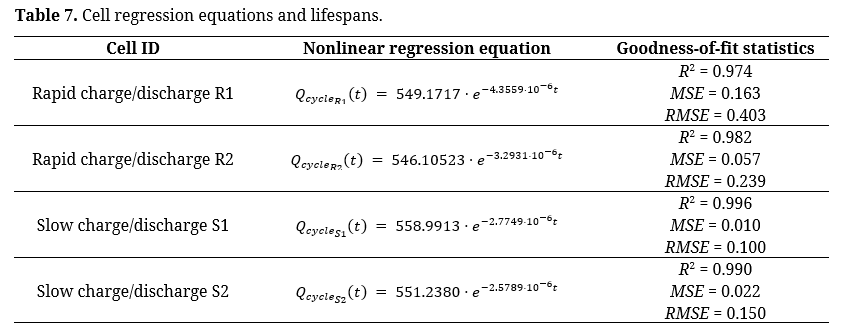 Table 7. Cell regression equations and lifespans.
The results of applying the exponential decay model to the Qcycle capacity data over time for the S-cells show an excellent curve fit to the data for both S-cells, as shown by symmetrically distributed residuals around zero for both the 25 observations used for model calibration and the 10 randomly selected observations for validation. Equations for the S-cells are presented in Table 7, with determination coefficients (R2) of 0.99 for both S1 and S2, alongside MSE and RMSE values closer to zero than the R-cells.
Estimation of Battery LifespanThe use of Microsoft Excel’s Goal Seek tool with the equations presented in Table 7 enabled the estimation of the lifespans of the four LiFePO4 cells, with results presented in Table 8. The cells subjected to high currents and undergoing 146 cycles of charge/discharge, i.e., the R-cells, had theoretical lifespans of 24.0 years and 31.7 years, respectively. For cells subjected to lower currents, i.e., the S-cells, the theoretical lifespan projections were 37.7 and 40.6 years, respectively. These results are clustered near 40 years.
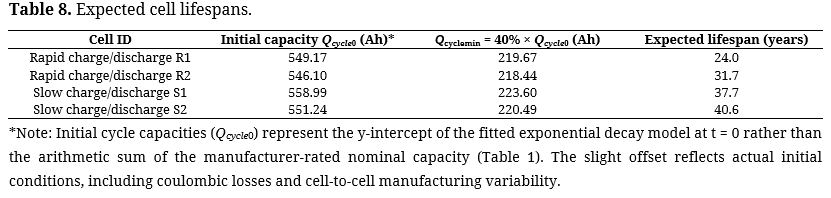 Table 8. Expected cell lifespans.
The stability of the voltage plateaus observed in both R and S cells is an important advantage of LiFePO4 batteries, as many devices used in installations, such as refrigerators and microwaves in domestic settings, and pumps and mills in rural settings, require a consistent operating voltage. The final phase of the discharge trajectory (number 6) releases the remaining 30% of the energy over a relatively short period of 4 h (for high current) or 6 h (for low current), resulting in a steep gradient. This behavior was consistent with the results obtained by Khairunnisa et al. (2023) [40], who reported similar rapid energy release characteristics in the final discharge phase of their LiFePO4 battery studies. These observations highlight the consistency and reliability of LiFePO4 batteries in maintaining stable voltage outputs, thereby supporting the proper functioning of various electronic devices and machinery.
Analysis of Degradation Indicators: CE vs. QcycleThe inadequacy of Coulombic Efficiency (CE) as a reliable degradation indicator in semi-field conditions is an important result of this study. The high sensitivity of CE to small measurement errors, arising from its mathematical formulation as a ratio (QD/QC), makes it unsuitable for field deployments where instrumentation precision is inherently limited. This conclusion is consistent with findings from Dong et al. (2021) [44], who questioned the reliability of CE as a sole indicator of battery health. In contrast, Qcycle is a more suitable metric for showing capacity degradation of LiFePO4 cells over time, offering reduced error propagation and greater stability across measurement fluctuations.
Comparison with other published findings supports these observations regarding the degradation behavior of lithium-ion battery cells under cycling conditions. Madej and Wojciechowski (2021) [36] similarly report exponential declines in capacity metrics over extended cycling periods, noting variations in degradation rates influenced by cell design, electrode materials, and operational parameters. These studies are consistent with our findings, indicating the general nature of capacity loss in LiFePO4 cells under varied experimental conditions. Moreover, recent research by Zhou et al. (2023) [42] provides evidence on the mechanisms underlying capacity degradation, attributing it to irreversible structural changes and material degradation over cycling. This body of literature supports the reliability of Qcycle as a metric for evaluating long-term battery performance across different experimental settings.
Environmental Factors and Battery DegradationEarlier work by Kurpiel et al. (2021) [50] and Martin et al. (2008) [51] showed that lithium-ion cells tolerate ordinary temperature and humidity shifts without abrupt capacity loss. This holds true, however, only when the environment remains within moderate bounds. In rural pumping stations (A practical demonstration of the solar pumping system and its operation with lithium batteries is provided in the supplementary videos (Videos S1–S4)), poor ventilation, with doors and windows kept shut, traps heat and moisture, producing sharp indoor spikes that accelerate wear. Conversely, keeping openings unobstructed allows air to move freely, smoothing out daily and seasonal swings. Under such naturally ventilated conditions, the steady fade tracked by Qcycle offers a reliable basis for maintenance planning, without requiring costly climate control.
The second component, F2, accounted for an additional 9.79% of variability for R1 and R2 and 9.82% for S1 and S2, and was primarily influenced by time t and Qcycle in opposite directions. A strong negative loading of time t on F1 and F2 indicates that battery degradation is time-dependent, reinforcing the effectiveness of Qcycle as a metric for tracking capacity loss. The observed statistical associations between Qcycle, temperature, and humidity [52] further show the importance of monitoring environmental conditions during battery operation. However, because these environmental variables evolved simultaneously with cycling time throughout the experiment, their individual contributions to battery degradation could not be isolated from the present dataset. Consequently, the PCA should be viewed as identifying correlations among operational and environmental variables rather than demonstrating independent causal mechanisms.
These results support the choice of Qcycle as a key performance indicator, showing its ability to capture degradation trends more effectively than Coulombic Efficiency (CE), particularly in environments with moderate temperature fluctuations and variable humidity levels.
Throughout the experiments, the cells were charged with a LiFePO4-compatible algorithm. However, inadequate charging protocols, characterized by mismatched voltage targeting, absence of current tapering, and unsupervised float stages, can accelerate degradation through parasitic reactions and loss of lithium inventory [53]. These effects were not examined here; instead, the setup excluded such mismatches so that ambient factors could be observed in isolation. The Qcycle patterns therefore reflect battery behavior under sound charge management yet naturally variable surroundings, showing that real-world performance depends on both algorithm compatibility and local climate.
Mechanisms of Battery DegradationBattery degradation in LiFePO4 cells results primarily from the growth of the solid electrolyte interphase (SEI) layer at the anode-electrolyte boundary [54]. This passivation film forms during initial charging as the electrolyte decomposes and reacts with lithium ions and graphite. Once established, it supports stable cycling by shielding the electrolyte from direct electron contact. Yet continued thickening immobilizes lithium irreversibly, raises internal resistance, and progressively reduces available capacity [24,43,55]. Electrolyte gelification worsens this effect by further limiting ion transport [43].
The process resembles radioactive decay: just as fewer nuclei undergo emission over time, fewer lithium ions remain electrochemically active as the SEI layer expands, gradually reducing the energy the cell can deliver [24,55,56].
In the context of batteries, passivation refers to the formation of an insulating layer on the electrodes, which limits the effective participation of lithium ions in the electrochemical reactions needed for energy release. This phenomenon limits the battery’s ability to maintain its original energy output over its operational life. Thus, although LiFePO4 batteries are known for their durability and stability, their performance diminishes as the passivation layer grows, similar to decreasing emission from radioactive nuclei [24].
Factors That Can Shorten Battery Lifespan Extreme TemperaturesEnvironmental conditions during operation play an important role, with temperature being particularly significant. Research has shown that deviations from the optimal temperature range can significantly affect battery performance and longevity [48]. For example, studies indicate that LiFePO4 batteries typically perform best within a temperature range of −10 to 60 °C, beyond which their capacity can deteriorate rapidly [48]. Moreover, mechanical stresses such as vibrations and shocks can accelerate battery degradation and increase the risk of functional failures [48]. Additionally, external mechanical events such as crashes can pose safety risks and further shorten battery life.
Chemical Environment and Manufacturing ConditionsThe chemical environment around the battery also contributes to its degradation. Factors such as ambient humidity can expose cells to moisture, which may corrode internal components and reduce battery efficiency over time [57]. Finally, the quality of the LiFePO4 battery itself is a key determinant of its lifespan. Variations in manufacturing processes, materials used, and quality control standards can cause substantial differences in battery performance and durability. High-quality batteries often use higher-quality electrode materials and advanced battery management systems, enhancing safety and extending lifespan [58]. Investing in high-quality LiFePO4 batteries from reputable manufacturers may initially cost more but can ultimately result in more reliable performance and longer lifespan, making them a suitable choice for critical applications [49].
Implications for Sustainable Solar IrrigationThe projected lifespans of 32–41 years for three of the four cells (mean 37 ± 5 years) challenge the prevailing view that batteries are the weak link in solar irrigation economics. The R1 outlier at 24 years, detectable only through Qcycle’s cell-level resolution, supports the metric’s sensitivity and cautions against universal lifespan prediction without individual calibration. If these projections are confirmed under broader validation, LiFePO4 storage could outlast pumps, pipes, and even PV panels, shifting the financial calculus for rural investors from frequent replacement cycles toward long-term asset management. This interpretation matters for development finance: it could lower the perceived risk of off-grid energy projects and strengthen the case for capital expenditure over operational subsidies in rural Africa.
The next technical steps include pack-scale validation of Qcycle under real farm loads, integration with smart charge controllers, and coupling to machine-learning diagnostics that can detect degradation before it compromises irrigation schedules.
Study Limitations and Scope BoundariesSeveral methodological limitations shape the interpretation of the present findings. First, the experimental window covered five months (May–September 2022), capturing one complete seasonal cycle but not the multi-year trajectory. Degradation-regime transitions(“knees”) have been reported in many Li-ion aging studies but are not systematically observed under all chemistries, operating conditions, or time scales [59,60]. Several studies have shown that early-stage degradation often follows smooth monotonic behavior before possible transitions to accelerated aging later in life [16,53,61]. Consequently, the exponential model proposed here should be interpreted as describing the observed degradation regime during the experimental window. Extrapolation beyond this window depends on the absence of subsequent degradation regime transitions and therefore represents a theoretical projection and requires long-term validation.
Second, the sample included only four cells of identical rated capacity (280 Ah) sourced from a single manufacturing batch. Although this sample size was sufficient to evaluate the consistency of the proposed Qcycle metric under controlled experimental conditions, it was not intended to provide statistically representative lifetime estimates for the broader population of commercial LiFePO4 cells. The convergence (Table 8) of R2, S1, and S2 on a 31.7–40.6-year projection (mean 36.7 ± 4.5 years) suggests that Qcycle captured a reproducible degradation signature under comparable operational conditions. The downward deviation of R1 to 24.0 years, despite sharing the identical cycling protocol and batch origin with R2, likely reflects latent cell-to-cell manufacturing heterogeneity rather than methodological instability. Qcycle’s resolution of this individual variation, which Coulombic Efficiency cannot resolve, highlights its diagnostic value for cell-specific tracking. It also cautions against applying a single decay rate to untested cells without prior calibration. The results therefore represent cell-level behavior under the specific electrochemical parameters investigated. Consequently, the reported lifespan projections should be interpreted as cell-specific model outputs rather than population-level estimates. Generalizing these results to other LiFePO4 cells, production batches, chemistries, or form factors requires validation with substantially larger datasets. Since the sample size per group was only two cells, statistically meaningful confidence intervals for population-level lifespan predictions could not be reliably estimated. Therefore, the data in this study are primarily used to qualitatively validate the degradation trend captured by Qcycle rather than to quantitatively calibrate absolute lifespan.
Third, tests were conducted under semi-field conditions using programmable DC testers rather than actual solar-pump loads. While this approach isolated environmental and electrical variables, it did not capture transient phenomena inherent to real photovoltaic irrigation systems, such as partial state-of-charge operation, intermittent shading, or pump-start inrush currents, which may accelerate degradation beyond the trends reported here.
Fourth, the correlation structure revealed by PCA indicates a statistical association rather than demonstrated causation. Temperature and humidity co-vary seasonally with Qcycle, yet the underlying electrochemical mechanisms (SEI thickening, electrolyte gelification, terminal corrosion) were not verified by post-mortem analysis (e.g., electrochemical impedance spectroscopy, SEM imaging, or electrolyte assay). Moreover, because the experiment covered a single seasonal transition from the dry to the rainy season, cycling time, temperature, and relative humidity evolved simultaneously throughout the monitoring period. Consequently, the present dataset does not allow independent contributions of these variables to battery degradation to be separated statistically. Future work should combine Qcycle tracking with destructive diagnostics to address this mechanistic gap.
Finally, the lifespan projection assumes that cells are operated within the voltage and current envelopes defined in this study. Deviations, such as mismatched charging algorithms (e.g., lead-acid profiles), sustained over-temperature events above 45 °C, or deep discharges below 3.0 V, could invalidate the exponential trajectory and substantially shorten operational life.
This study introduces and validates Qcycle as a field-robust metric for tracking LiFePO4 degradation in Sahelian solar irrigation contexts. Whereas Coulombic Efficiency produced erratic signals under natural temperature and humidity swings, Qcycle yielded a steady, monotonically declining trace across both rapid and slow cycling regimes during the five-month semi-field campaign. Nonlinear regression modeled this decay accurately (R2 > 0.97), producing a theoretical projection of cell longevity under the assumption of sustained exponential degradation.
These results have immediate practical relevance for the water–energy–food nexus. Qcycle offers technicians and farmers a straightforward diagnostic tool that requires no laboratory-grade instrumentation, bridging electrochemical research and the management of decentralized systems. Additionally, the methodology sets a reproducible baseline for comparing battery stress across contrasting climatic seasons, which is necessary for predictive maintenance frameworks in the Sahel.
The results also highlight the importance of cell-level monitoring when assessing battery degradation. The observed differences among cells indicate that a single degradation trajectory should not be universally applied without appropriate validation and calibration. The absence of a “knee” during the present five-month observation period should not be interpreted as evidence that none will occur later. Instead, the exponential model should be viewed as describing the degradation regime observed during the experimental window, while future multi-year monitoring should determine whether regime transitions eventually develop. Future studies involving larger samples from multiple production batches are also required to assess the generalizability of the observed degradation trends and to evaluate whether subsequent degradation regime transitions may occur. Future work should further investigate the implementation of Qcycle within Battery Management Systems (BMS), where cumulative partial charge and discharge events can be combined into Equivalent Full Cycles for continuous degradation monitoring under real operating conditions.
By basing battery health assessment on locally measurable metrics rather than laboratory abstractions, this work advances SDG 7 targets for resilient, affordable clean energy and contributes to climate-resilient agricultural change across semi-arid regions of the Global South.
The following supplemental materials are available online, Video S1: Modern solar pumping with lithium batteries [FRENCH] Part 1: https://www.youtube.com/watch?v=KDfUnk3faD0, Video S2: Modern solar pumping with lithium batteries [FRENCH] Part 2: https://www.youtube.com/watch?v=sbiMgXFhGJE&t=164s, Video S3: Modern solar pumping with lithium batteries [FRENCH] Part 3: https://www.youtube.com/watch?v=Vzaz31sJ2mU, Video S4: Modern solar pumping with lithium batteries [FRENCH] Part 4: https://www.youtube.com/watch?v=FKsXBo9Z3vY.
The study dataset is available from the authors upon reasonable request.
Conceptualization, AK; methodology, AK and SK; investigation, AK and SK; validation and formal analysis, DY; simulation and visualization, SK and DDD; writing: original draft preparation, AK, DY and SK; writing: review and editing, DDD; supervision, AK and DY. All authors have read and agreed to the published version of the manuscript.
The authors report no relevant financial or non-financial interests.
This work was financially supported by the World Bank through its Africa Higher Education Centres of Excellence (ACE) (Grant number IDA 6388-BF/D443-BF), of which the International Institute for Water and Environmental Engineering (2iE) is a partner. However, the World Bank was not involved in the study design, data collection, data analysis and interpretation, writing of the report, or the decision to submit the article for publication.
The authors thank the World Bank Group and the Government of Burkina Faso for financial support through the Africa Higher Education Centers of Excellence for Development Impact project.
1.
2.
3.
4.
5.
6.
7.
8.
9.
10.
11.
12.
13.
14.
15.
16.
17.
18.
19.
20.
21.
22.
23.
24.
25.
26.
27.
28.
29.
30.
31.
32.
33.
34.
35.
36.
37.
38.
39.
40.
41.
42.
43.
44.
45.
46.
47.
48.
49.
50.
51.
52.
53.
54.
55.
56.
57.
58.
59.
60.
61.
Keïta A, Yamegueu D, Sodiya K, Dumba DD. Qcycle: A Field-Robust Metric for LiFePO4 Battery Degradation Monitoring in Sahelian Solar Irrigation Systems. J Sustain Res. 2026;8(3): e260067.

Copyright © Hapres Co., Ltd. Privacy Policy | Terms and Conditions


