Location: Home >> Detail
J Sustain Res. 2026;8(3):e260073. https://doi.org/10.20900/jsr20260073
 ,
Yunfan Li 2,* ,
Lawrence Loh 3
,
Yunfan Li 2,* ,
Lawrence Loh 3
1
2
3
*
Food-waste studies in Singapore provide strong treatment evidence but limited decision support for the operational chain inside hawker centres and food courts. This paper addresses that gap with a mass-flow and routing framework linking procurement, preparation loss, plate waste, source segregation, contamination, and treatment readiness. Five stylised prototypes represent traditional public hawker centres, integrated community centres, mall food courts, tourist-intensive centres, and educational canteens. The traditional public prototype is the main analytical case; Bukit Batok West Hawker Centre supplies qualitative workflow evidence, while public-centre pilots anchor the scale. Inputs combine public reports, derived indicators, non-participant observation, and explicit scenario assumptions. The illustrative scenario bands indicate that weekly total food waste in the main prototype ranges from 1.33 to 1.95 t and disposal-oriented waste from 0.76 to 1.64 t; these are model outputs, not measured site estimates. Cross-prototype analysis applies contamination adjustment and common uncertainty ranges to all five settings. Stronger-control settings do not necessarily generate less waste, but they retain a larger treatment-ready share. The main contribution is a transparent way to identify where measurement, prevention, segregation, and routing interventions should be sequenced before undertaking site-specific cost or greenhouse-gas appraisal. Future work should replace assumptions with direct weighing, contamination audits, and labour-time data.
Singapore imports more than 90% of its food supply, so food waste is both an environmental burden and a strategic efficiency issue [1]. National policy has framed food-waste management through prevention, redistribution, segregation, treatment, and reporting. Recent regulatory changes have also raised accountability for large commercial and industrial premises, including waste reporting and, where thresholds apply, food-waste segregation and treatment requirements [2,3]. In an import-dependent food system, wasted food carries embedded material, labour, logistics, energy, and disposal burdens. Input-output studies do not provide hawker-centre waste coefficients, but they reinforce the wider point that local consumption is connected to intersectoral and trade-embodied environmental flows [4–8].
The scale of the problem remains material. Singapore generated 784,000 t of food waste in 2024 and recycled 18% of it [2]. The national waste-to-energy (WTE) system can recover energy from residual waste [9]. but food waste has high moisture content and often carries avoidable upstream losses. A policy focus limited to final disposal therefore leaves an important operational question unresolved: which parts of the food-service chain can be changed before food residuals become mixed waste? This question is especially relevant in shared dining infrastructure where responsibility is distributed among stallholders, cleaners, operators, contractors, and diners.
Hawker centres and food courts deserve specific attention because eating out is embedded in daily life in Singapore. Hawker centres are public cooked-food centres with independent stallholders and shared seating, while food courts are managed multi-stall dining areas often found in malls, institutions, or commercial settings. Hawker culture has been recognised as intangible cultural heritage, and the National Environment Agency manages 123 markets and hawker centres [10,11]. These settings are socially important, spatially constrained, and operationally varied. A traditional estate hawker centre, an integrated community hub, a shopping-mall food court, a tourist-heavy centre, and a campus canteen can all generate food waste through different patterns of governance, layout, labour, user behaviour, and back-of-house control.
That operational diversity is the research object of this paper. The analysis uses five prototypes. A prototype is defined here as a stylised but empirically grounded dining setting that captures a distinct operating logic for food-waste generation and handling. The traditional public hawker-centre prototype is the main case because it represents fragmented responsibility, many independent stallholders, shared cleaning labour, open circulation, and retrofit constraints. Four comparative prototypes extend the analysis: new Housing & Development Board (HDB) town or integrated community centres with stronger design control; high-end mall food courts with landlord-led management; tourist-intensive centres with crowding and visitor churn; and educational institution canteens with repeated users and institutional rules.
The purpose of placing the prototypes upfront is to make the modelling problem explicit. Hawker-centre food waste is analysed as an operational chain linking procurement, preparation, serving, consumption, tray return, dishwashing, consolidation, haulage, and treatment. Recoverability depends on how waste moves through that chain. Downstream treatment technology matters, but its practical value depends on source segregation, contamination control, storage, cleaner workflows, stallholder compliance, user routines, spatial constraints, and management authority [2,11,12].
The Singapore-relevant literature is stronger on treatment performance than on hawker-centre operational heterogeneity. Existing studies compare incineration, anaerobic digestion, composting, and black soldier fly treatment under Singapore-relevant assumptions, and engineering work has begun to assess decentralised or on-site treatment feasibility [13–15]. Institutional and behavioural work also shows that food-waste interventions depend on participation, governance, and legitimacy [12,16]. What remains limited is an integrated framework that connects upstream losses, midstream segregation, contamination, routing quality, and downstream treatment inside the specific operating conditions of Singapore hawker and food-court systems.
This paper addresses that gap through one bounded research question: How do source reduction, segregation, and contamination-adjusted routing change total waste, treatment-ready waste, and disposal-oriented waste across Singapore hawker-centre and food-court prototypes under plausible operating ranges? The available evidence does not support a direct site audit, emissions optimisation, or finance-grade appraisal. It does support a transparent mass-flow sensitivity analysis that makes assumptions visible and shows how operating settings change intervention priorities.
The question is also deliberately operational. It does not treat hawker centres as miniature national waste systems. The relevant decision context is more immediate: how much food enters the centre, how much is lost before serving, how much returns as plate waste, how much remains separated after handling, and which treatment options become credible once that stream is known. These are the quantities that a centre-level pilot, public agency, or facility manager can measure and improve over time.
The paper makes three contributions. First, it develops a Singapore hawker-centre and food-court-specific decision-support framework that treats the dining setting as part of the waste-management problem. Second, it places source loss, plate waste, segregation, contamination, and routing inside one accounting chain so that treatment readiness is not inferred from gross segregation alone. Third, it applies the same uncertainty logic across all five prototypes and uses sensitivity analysis to identify measurement and intervention priorities under incomplete data. Treatment, greenhouse-gas, and cost appraisal are subsequent analyses requiring verified feedstock and site-specific factors.
The remainder of the paper follows a standard research-article structure. The literature review positions the study within Singapore food-waste treatment, governance, and measurement debates. The Materials and Methods section defines the system boundary, variables, parameters, prototypes, and scenario logic. The Results section reports the main-case sensitivity and cross-prototype comparison. The Discussion section interprets the findings for the three contributions, policy sequencing, implementation, and future data needs.
Singapore food-waste research has often focused on downstream treatment comparison. Several Singapore-relevant LCA studies report lower climate impacts or resource-use benefits for AD and BSF pathways under specified energy, fertiliser, feed, or by-product credit assumptions [13–15,17]. However, these results are sensitive to scale, functional unit, and substitution assumptions [15,17]; a pathway that performs well in a national model may face practical barriers at the site level.
Tian and colleagues compared incineration, centralised AD with different biogas uses, and decentralised AD configurations in Singapore. All AD scenarios delivered net environmental benefits relative to incineration, with decentralised AD for cooking fuel producing the strongest climate benefit under their assumptions [13]. Their study is relevant to hawker-centre analysis because it shows that decentralised systems can remain credible when transport and infrastructure burdens are accounted for.
Ramzy and colleagues examined decentralised BSF systems in Singapore. Their results show that BSF should be evaluated through its waste-management role as well as its by-product outputs, because avoided disposal and substitution effects materially affect net impacts [14]. This reinforces the point that at hawker-centre scale, the first treatment question is not whether a technology can produce valuable outputs, but whether the centre can supply a clean and regular stream.
National-level work by Khoo, Tan, and others further confirms that LCA conclusions depend on scale, functional unit, and allocation assumptions [15,17]. The methodological implication for this paper is that treatment choice cannot be evaluated in the abstract; it should be conditioned on the stream quality that a given prototype can actually supply. That is why source segregation and contamination adjustment enter before treatment conversion factors.
Singapore policy documents identify food waste as a priority stream and stress source reduction, segregation, and treatment [2]. Large commercial premises face mandatory waste reporting and segregation requirements, but public hawker centres, mall food courts, and institution-managed canteens differ substantially in authority, tenancy arrangements, and user routines [11]. Institutional studies reinforce this point: Rut and colleagues show that participation in surplus-food recovery depends on governance structures and legitimacy, not merely on technical efficiency [16].
Singapore’s tray-return policy is directly relevant to this operating chain. Tray and crockery return became mandatory at hawker centres in 2021, and the average return rate rose from about 30% in February to about 65% by August 2021 [18,19]. Earlier NEA evidence also showed large differences between older manual-return centres and newer or refurbished centres with automated return and centralised dishwashing [20]. These figures do not measure food-only segregation, but they support treating return-point design, cleaner deployment, and user compliance as observable mechanisms underlying γ and ccontam rather than as purely technological parameters.
Operational studies confirm that segregation, collection, and treatment routing are collective practices requiring coordination among stallholders, cleaners, operators, and diners [12,21]. A visible bin or treatment machine does not by itself guarantee a usable feedstock; the centre must keep residuals separate through peak periods, mixed user behaviour, and back-of-house transfer. Cleaner time pressure, limited stallholder space, and contractor contamination thresholds all shape whether waste reaches a treatment pathway.
This governance lens is especially important in older public hawker centres, where authority is fragmented and retrofit space limited. Newer integrated centres, mall food courts, and campus canteens have stronger management authority over return points, contracts, and back-of-house flows. Tourist-intensive centres face a different constraint: high peak pressure and variable diner behaviour increase contamination risk even when management attention is strong.
Measurement frameworks such as the UNEP Food Waste Index support standardised accounting [22], but for hawker-centre decision support, total waste is only the starting point. Taken together, the literature establishes relevant but non-equivalent evidence: Singapore LCA studies evaluate pathway performance using system-level functional units and technology or process assumptions [13,15,17], while the BSF case addresses a decentralised pathway and its system boundary [14]. Governance and tray-return sources describe participation, collection, and operating conditions [12,16,18–21], and UNEP provides measurement guidance [22]. These sources do not, individually, connect procurement, preparation loss, plate waste, segregation, contamination, and routing at one hawker-centre or food-court operating unit. We therefore frame the gap as an integration and scale-translation problem identified by comparing the scope and chain coverage of the existing evidence, not as a claim that any cited study is itself defective. This study responds through an operational accounting model that translates prototype differences into mass-flow and routing indicators under explicit feasibility conditions.
Broader circular-economy and input-output research helps position, but not calibrate, the centre-level model. Comparative policy evidence from the United Kingdom and Finland identifies landfill taxation, complementary incineration pricing, research and development, education, and extended producer responsibility as interacting instruments rather than stand-alone fixes [23]. Interdisciplinary, input-output, trade, and spatial studies likewise show why waste policy should be read alongside social, economic, intersectoral, and environmental linkages [4–8]. In this paper, that evidence supports treating the proposed four-stage programme as a package of measurement, infrastructure, contract, and incentive instruments rather than as a single technology mandate. Because these studies operate at city, regional, national, or trade-system scales, they frame policy context and system boundaries but do not derive hawker-centre parameters.
The study uses a deterministic mass-flow and routing assessment. It compares specified intervention configurations under fixed assumptions and focuses on flows that can be affected within or near a hawker-centre or food-court setting. It does not compute greenhouse-gas impacts, treatment costs, broader market responses, behavioural rebound effects, full upstream life-cycle burdens, or project finance. Those analyses require verified site-specific feedstock, transport, technology, and contract data.
The research design begins with five prototypes and applies the same accounting model to each. This ordering matters. The model is a research method for comparing prototype-specific operating conditions; it is not an abstract solution imposed on unrelated cases. The traditional public hawker-centre prototype is the main case because it is policy-relevant and has the weakest midstream control. The other four prototypes are comparative settings used to test how governance, layout, user behaviour, and management authority change the material-flow profile.
Evidence is classified into four types. Reported evidence includes public statistics, policy documents, facility announcements, and published scale indicators. Derived evidence uses publicly reported stall counts, seating, patronage, or centre scale to establish plausible orders of magnitude. Observed evidence comes from non-participant site observations at Our Tampines Hub, Bukit Batok West Hawker Centre, and a polytechnic canteen. Scenario assumptions are explicit parameter values used where direct Singapore-specific measurement is unavailable. Supporting source documentation and calculation notes are retained by the authors for traceability and can be supplied where required.
Field observation is used in a limited but specific way. It does not involve interviews, personal data collection, or weighed waste quantities. It supplies workflow evidence: the visibility of tray-return stations, the degree of separation between diner-facing and back-of-house handling, the presence or absence of covered collection, the ordering of stall frontages, and the extent to which return behaviour appears channelled through managed nodes. These features are directly relevant to γ and ccontam because they affect whether food residuals can remain separated after the point of disposal. Public reports and scale indicators then provide the numerical anchors for scenario bands.
The system boundary covers the operational food-waste lifecycle of a Singapore hawker-centre or food-court prototype. It includes procurement, preparation, consumption, residual collection, source segregation, contamination-sensitive routing, and treatment allocation. It excludes upstream agricultural production, food manufacturing, international transport, consumer travel, packaging, and non-food waste streams. These exclusions keep the analysis focused on decisions that hawker-centre operators, policymakers, or facility managers can plausibly affect.
The primary functional unit is the operational food-flow system of one representative centre over one week. Weekly results are suitable for hawker-centre operations because they are easier to relate to procurement, cleaning, contractor collection, and monitoring routines than single-meal estimates. Pathway results are also interpretable per t of food waste where comparison across technologies is needed.
Time scaling is deterministic. A daily input can be converted to a weekly input through the operating schedule, and weekly outputs can be annualised when required. The present manuscript reports weekly results to avoid implying annual precision where site-level weighing has not yet been conducted. This also keeps the main results close to the level at which cleaner deployment, stallholder routines, and contractor collection could realistically be adjusted. The boundary and accounting scope are summarized in Table 1.
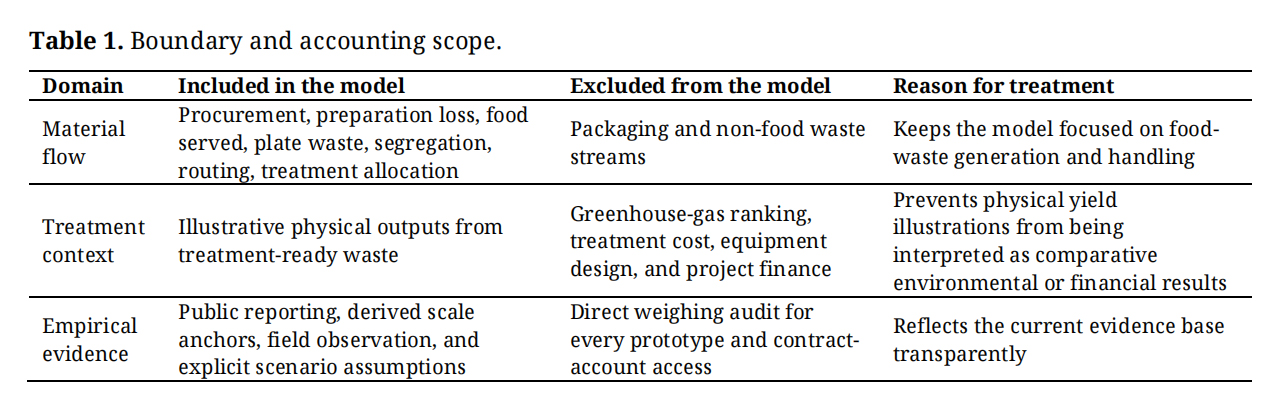 Table 1. Boundary and accounting scope.
The accounting model follows a deterministic mass-balance logic. Let P denote total food input procured during the analysis period. Let α denote the preparation-loss rate, representing the share of food lost during cleaning, trimming, spoilage, cutting, and related kitchen-stage processes. Let β denote the post-consumption leftover rate, representing the share of served food that remains uneaten. The core mass-flow relations are:
where Wk is kitchen-stage waste, Q is food served after kitchen-stage loss, Wp is plate waste or post-consumption residual, and W is total food waste generated. This distinction is necessary because different interventions act on different parameters. Procurement planning, storage, inventory control, menu design, and kitchen discipline affect α. Portion sizing, diner behaviour, tray-return arrangements, and peak-period pressure affect β.
After waste is generated, the model distinguishes gross source segregation from net treatment readiness. Let γ denote the gross source-segregated share of total food waste. Let ccontam denote the contamination-adjustment rate applied to that segregated stream. The routing equations are shown in Figure 1:
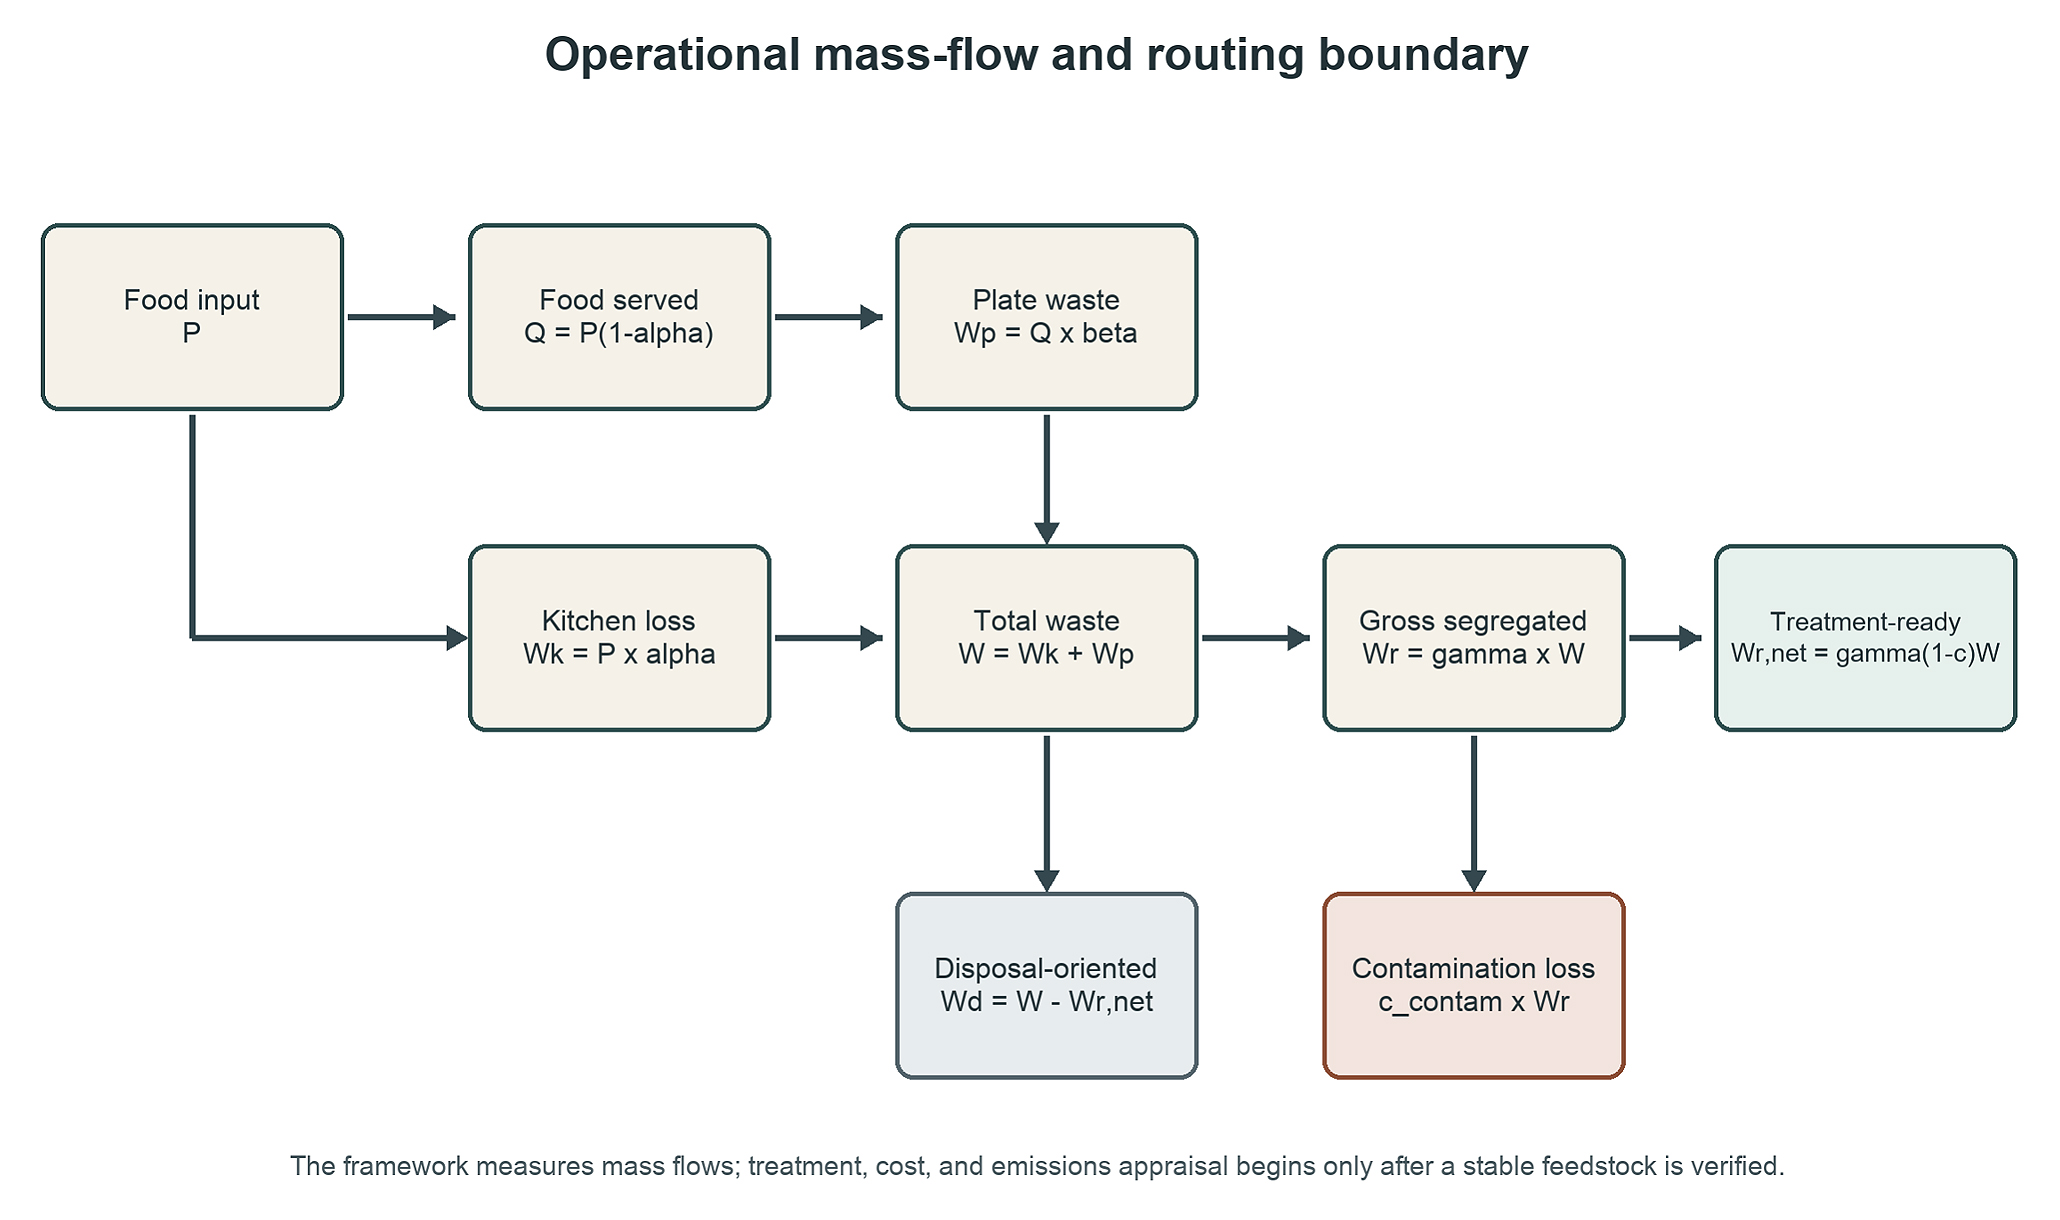 Figure 1. Operational mass-flow and routing boundary.
The term Wr is the gross segregated stream. The term Wr,net is the treatment-ready share: the amount that remains usable for separate treatment after collection and handling. The residual Wd is disposal-oriented waste. This is the central methodological definition in the paper. A centre may appear to segregate food waste, yet part of the segregated stream may be lost to mixed residues, poor sorting, excess liquid, container misuse, or back-of-house handling failures. The contamination adjustment prevents the model from treating nominal segregation as full recovery.
The model therefore treats γ as an operational routing parameter. It is not a fixed property of a technology. It can rise when return points are clearer, cleaners are trained, stallholders separate preparation waste, and consolidation points are monitored. It can fall during peak periods, in high-turnover settings, or where food residuals quickly mix with general refuse. This interpretation keeps the model close to the practical conditions that determine whether separate treatment is feasible.
Variable definitions and units are consolidated in Table A1 so that the main text remains focused on the analytical chain and results.
The framework distinguishes residual waste routed to Singapore’s WTE system from separately treated food waste. In the revised analysis, residual WTE is represented by the disposal-oriented flow Wd; no electricity yield is parameterised or reported. The separate-treatment pathways considered for physical translation are anaerobic digestion, composting, and black soldier fly treatment. Anaerobic digestion converts source-segregated food waste into biogas. Composting converts food waste into compost. BSF treatment produces larval biomass and frass, with downstream value depending on the assumed use case [13–15,21].
The pathway-output relations are:
The pathway outputs are illustrative physical translations of treatment-ready mass, not comparative environmental or economic indicators. No greenhouse-gas or cost ranking is reported because matched Singapore-specific process, transport, labour, capital, revenue, and substitution-credit data are unavailable across all pathways.
For this reason, the treatment pathway equations should be read as accounting relations, not engineering design specifications. They show how the same mass of treatment-ready waste would be translated into biogas, compost, larvae, or frass under specified assumptions. They do not determine reactor sizing, retention time, odour control, feedstock pre-treatment, product moisture, or contractor logistics. Those details would be needed for implementation studies after a centre has established a reliable treatment-ready stream (Table 2).
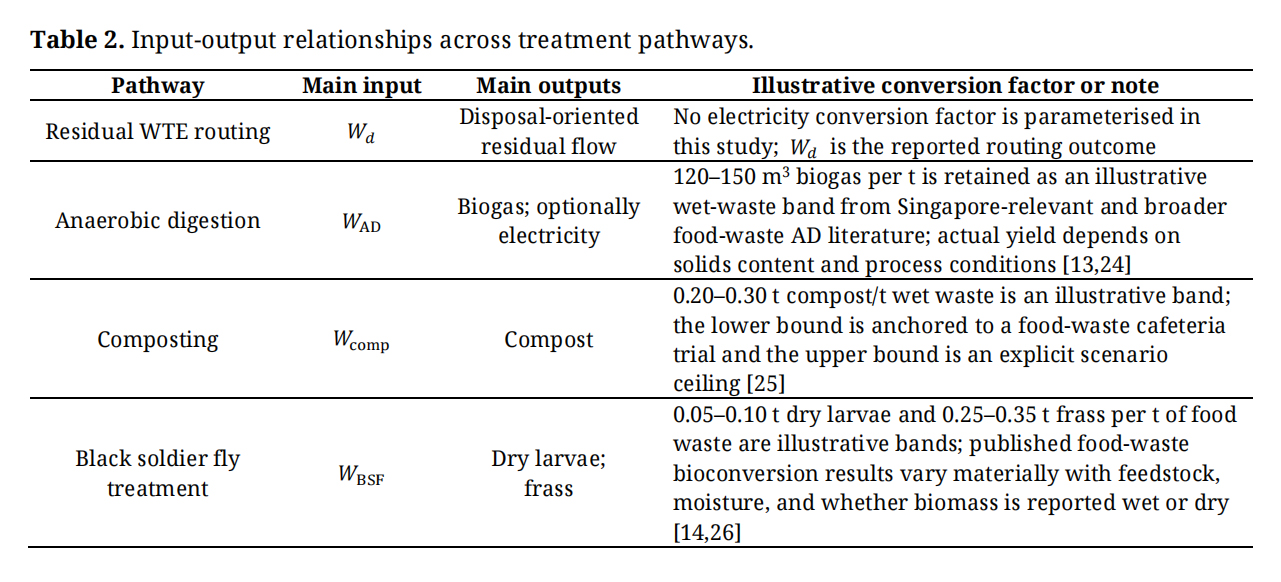 Table 2. Input-output relationships across treatment pathways.
Parameter values are carried as scenario bands where direct local measurement is unavailable. Values with stronger public anchors are labelled as reported or derived; values without direct Singapore hawker-centre measurement are treated as transparent assumptions. Table 3 summarises the core parameters used in the manuscript. It reports the core calibration logic in the main text while preserving traceability through the supporting evidence retained by the authors.
The parameterisation strategy follows a conservative evidentiary rule. Publicly reported values are used where they directly anchor scale or policy context. Derived values are used only to set plausible ranges, and the text states when a value is an order-of-magnitude calibration. Assumption-driven parameters are kept visible because hiding them would create false precision. This is especially important for α, β, γ, and contamination, where Singapore-specific centre-level datasets remain limited.
The five prototypes are presented once in full in Table 4. Later sections refer to the resulting parameter differences without reintroducing every setting. The purpose of the table is to connect empirical setting, management mode, handling logic, and model calibration.
The main case is evaluated under three sensitivity bands: conservative, base, and ambitious. Effective food input is Peff = P (1 − r), where r is the assumed source-reduction rate. The conservative band assumes no effective source reduction, higher preparation and plate-waste rates, lower segregation, and higher contamination loss. The base and ambitious bands represent progressively more coordinated operating packages rather than statistical correlations among parameters.
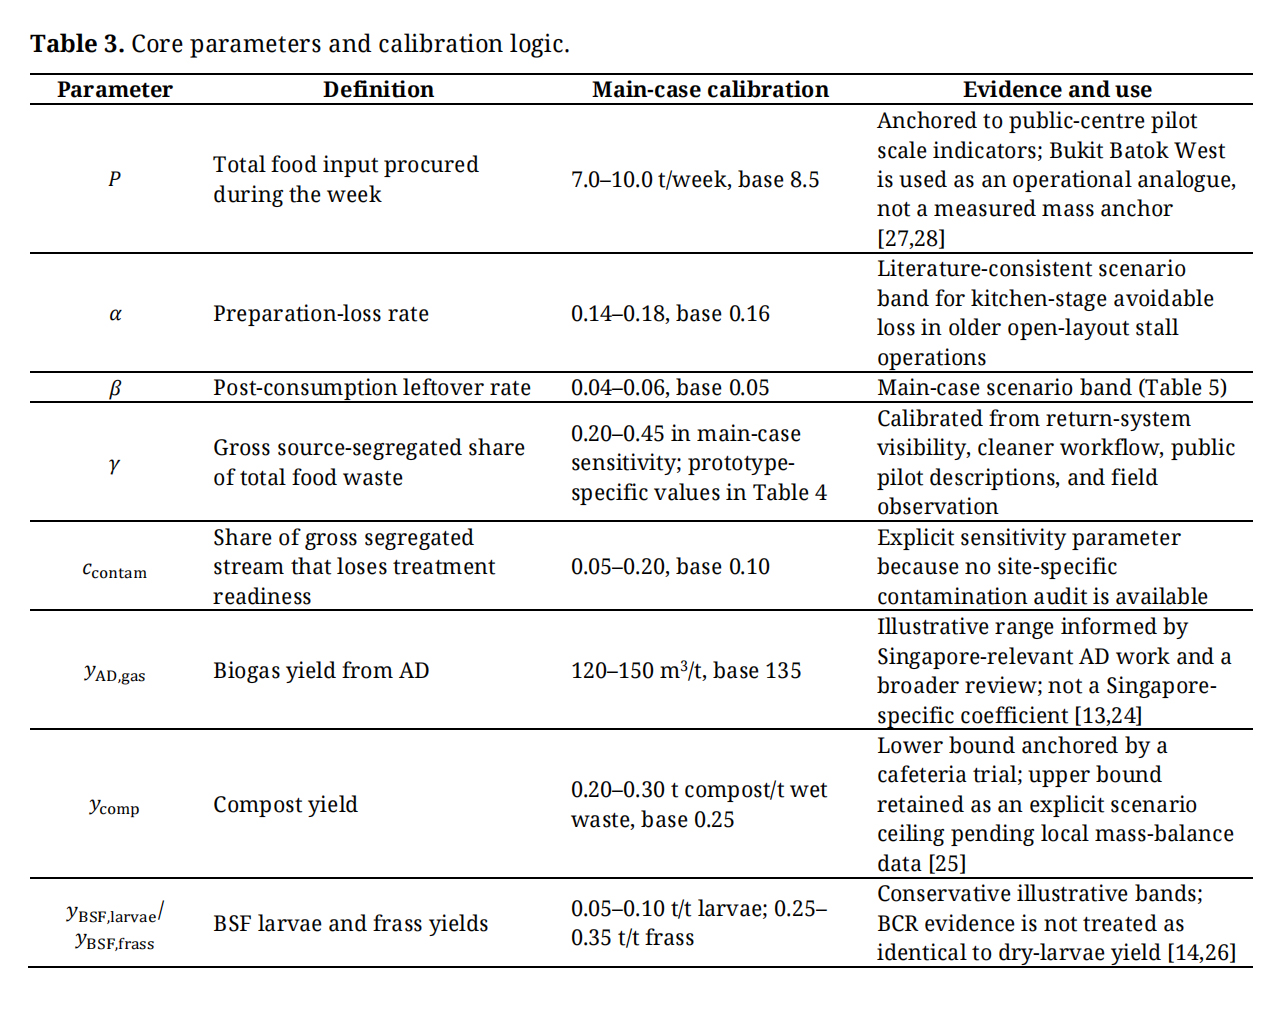 Table 3. Core parameters and calibration logic.
The parameters co-vary in Table 5 because each row represents a coherent operating state: stronger procurement control is assumed to accompany better return infrastructure, cleaner practice, and monitoring. This is a scenario design choice, not an empirical covariance claim. To prevent the bundled scenarios from determining the conclusion by construction, the Results also report one-at-a-time sensitivity, a γ-ccontam interaction check, and separate low-base-high ranges for every prototype.
The r column records the assumed source-reduction rate. The conservative, base, and ambitious rows represent weak separation with high contamination, partial coordination, and coordinated prevention and separation, respectively.
The scenario bands also serve a reporting function. They prevent the analysis from presenting a single baseline as if it were measured truth. For a policy-facing study with incomplete field data, this is important. A narrow point estimate can imply confidence that the evidence does not yet justify. A bounded band makes the uncertainty visible while still allowing the paper to compare the direction of change across interventions. The method therefore sits between qualitative case description and full empirical audit: it translates the available evidence into transparent, testable accounting assumptions.
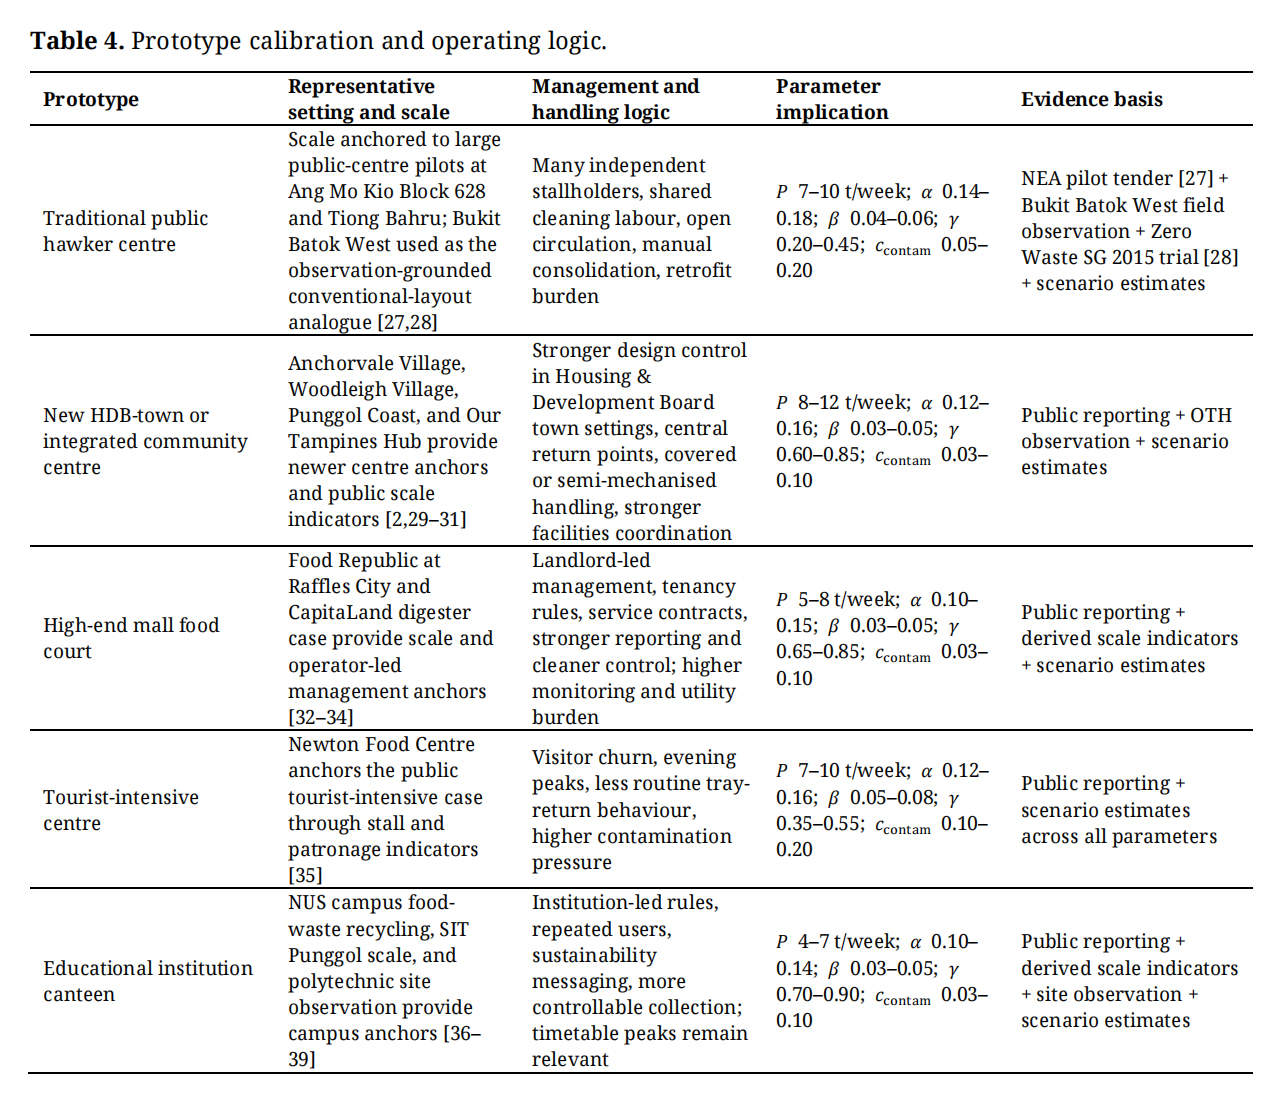 Table 4. Prototype calibration and operating logic.
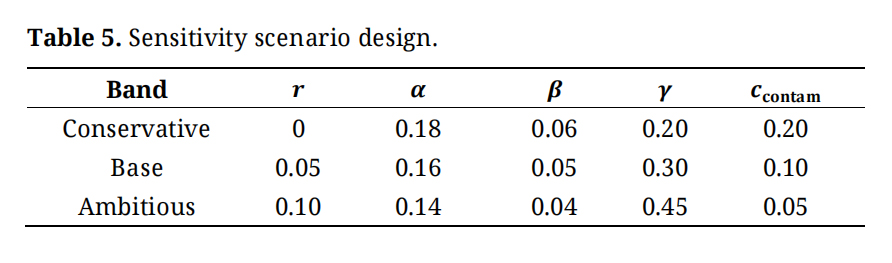 Table 5. Sensitivity scenario design.
Table 6 reports weekly scenario outputs for the traditional public hawker-centre prototype. The main case is grounded in a public hawker-centre operating logic: fragmented responsibility, many independent stalls, shared cleaning labour, and weaker control over the route from stall and tray return to final consolidation.
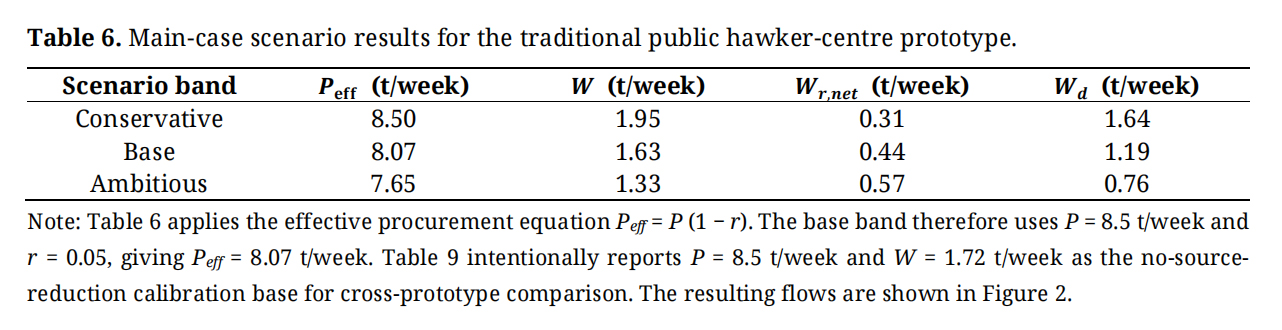 Table 6. Main-case scenario results for the traditional public hawker-centre prototype.
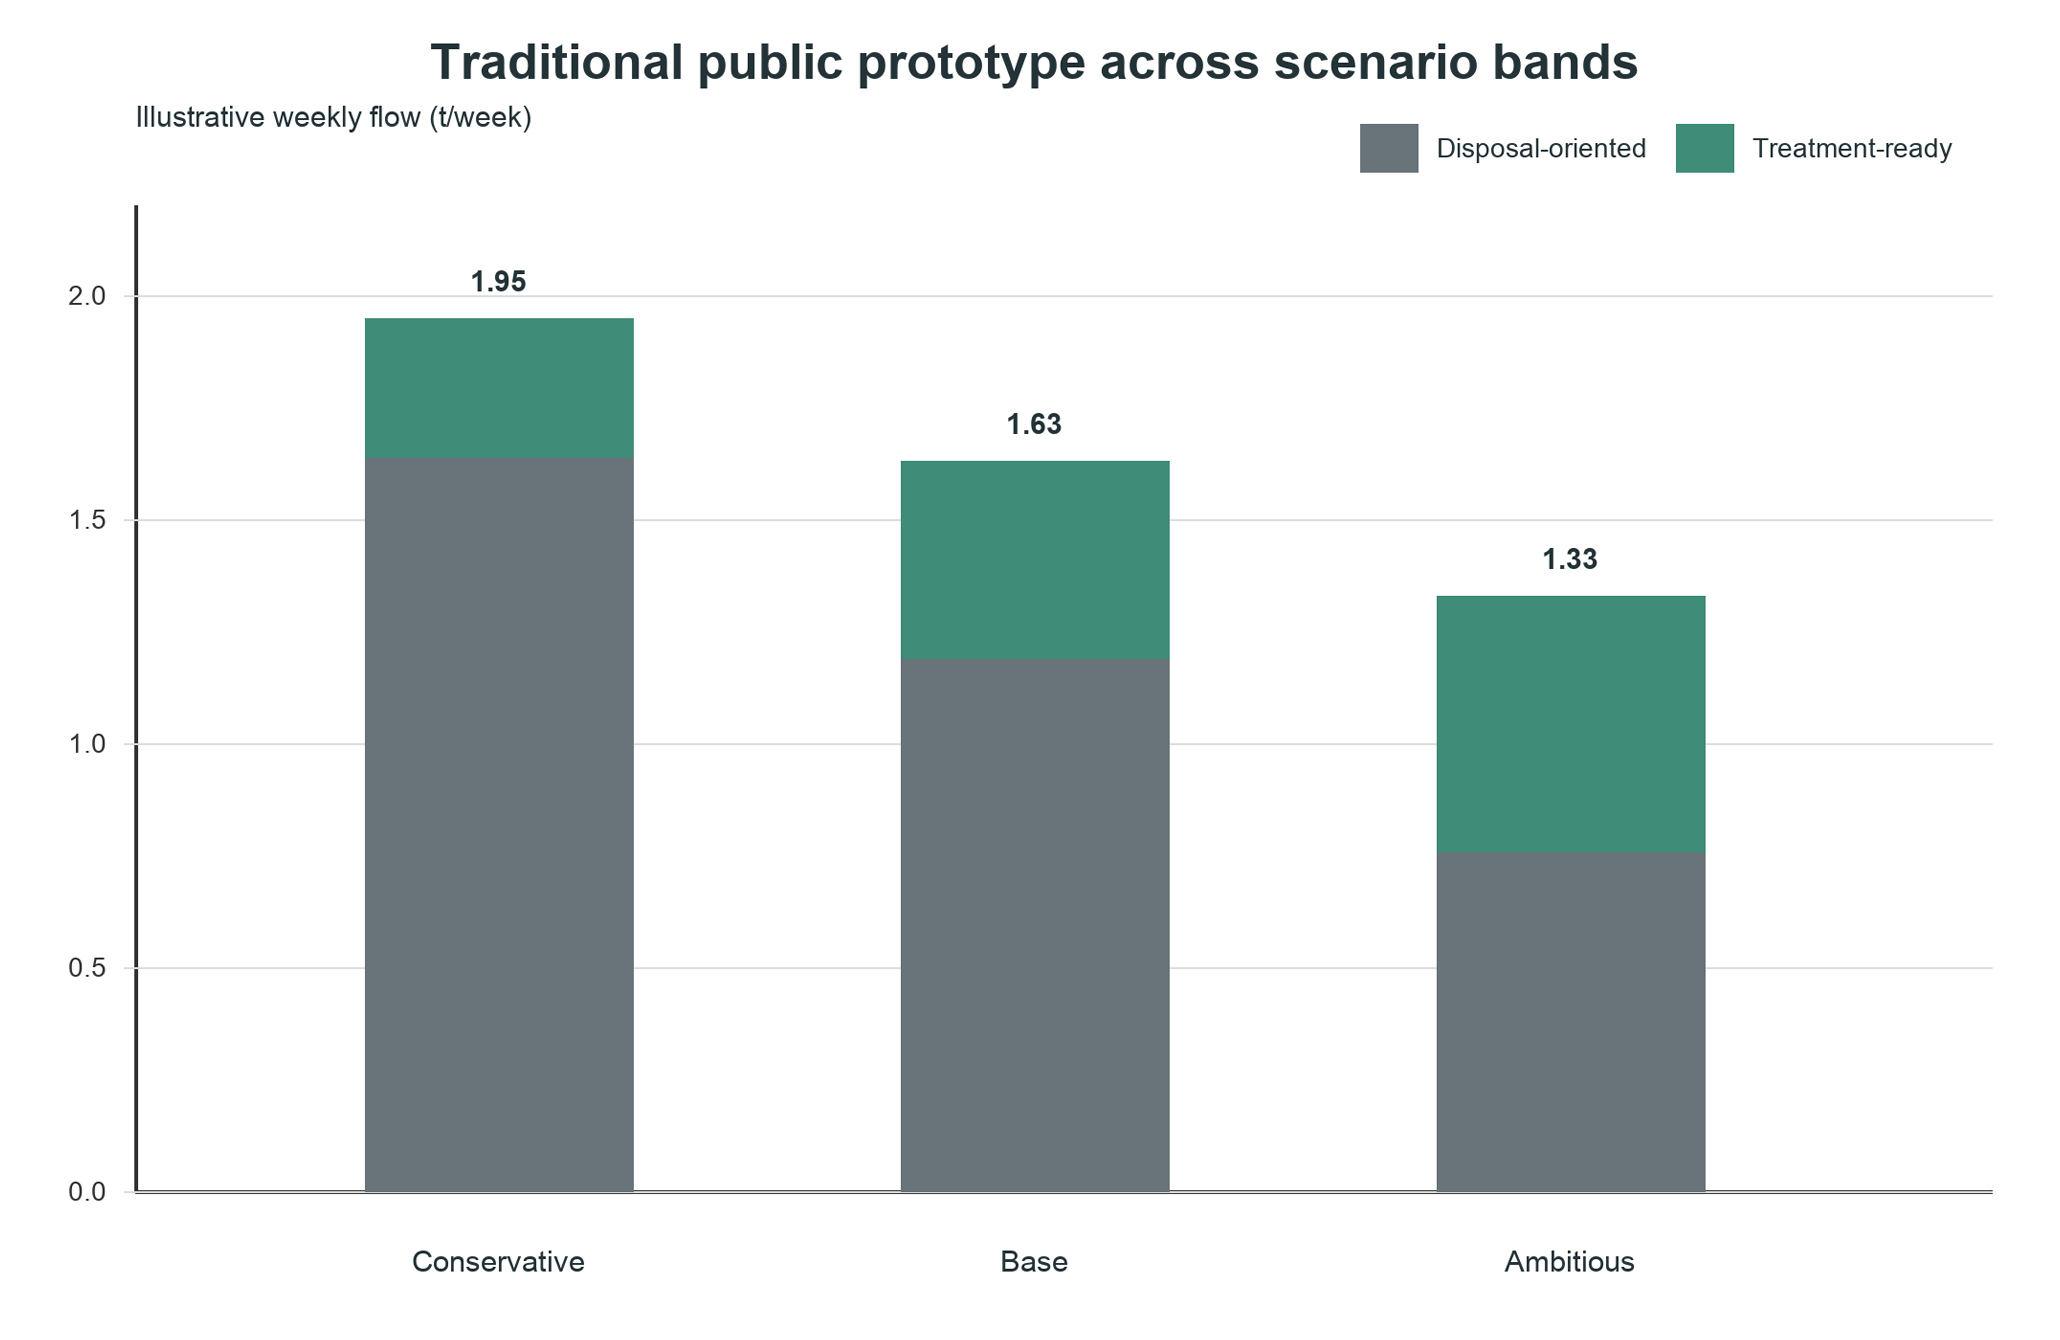 Figure 2. Illustrative mass-flow outputs for all three main-case scenario bands.
Three patterns are visible in the illustrative outputs. First, total food waste spans 1.33–1.95 t per week across the assumed bands. This difference reflects lower effective procurement input, lower preparation loss, and lower plate waste; it should not be interpreted as a measured reduction at Bukit Batok West.
Second, the disposal-oriented share falls more sharply than total waste. It declines from 1.64 t per week to 0.76 t per week. This occurs because the ambitious band combines source reduction with improved γ and lower contamination adjustment. The effect is important for policy because disposal burden is the quantity most closely tied to incineration dependence and the practical difficulty of routing material into separate treatment.
Third, treatment-ready material remains modest even under the ambitious band. The modelled treatment-ready share spans 0.31–0.57 t per week. In the traditional public prototype, separate treatment becomes operationally credible only if stall routines, tray-return design, cleaner handling, and contamination control improve together.
The main-case sensitivity also shows why γ deserves explicit attention. A change in source segregation changes more than the allocation of an existing waste stream. It changes whether the centre can produce a usable feedstock for AD, composting, or BSF. When contamination is high, gross segregation overstates recoverability. When contamination falls, the same visible segregation effort produces a larger treatment-ready stream. This is why the contamination-adjusted term Wr,net is central to the model.
The numerical change separates source reduction from routing without ranking treatment technologies. Lower total waste reflects prevention assumptions; the division between Wr,net and Wd reflects segregation and contamination assumptions. Greenhouse-gas and cost comparisons are deferred until site-specific process and contract data are available.
The base band is especially useful for policy discussion because it does not require an extreme behavioural shift. A 5% effective procurement reduction, a preparation-loss rate of 0.16, a plate-waste rate of 0.05, a gross segregated share of 0.30, and a contamination adjustment of 0.10 still leave 1.19 t per week disposal-oriented. This suggests that moderate improvements alone may be insufficient for older public centres. Meaningful diversion requires a stronger midstream programme; marginal awareness campaigns are unlikely to be enough.
One-at-a-Time Parameter SensitivityTo identify which parameter most strongly affects the disposal-oriented outcome, a one-at-a-time (OAT) sensitivity analysis was performed around the base-case values. Each of the four operational parameters—α, β, γ, and ccontam—was varied individually through its scenario range while holding all other parameters at their base-case values (Table 7); the resulting sensitivity is shown in Figure 3. The base-case effective procurement input (Peff = 8.07 t/week) was held constant to isolate the effect of each parameter on within-centre handling outcomes.
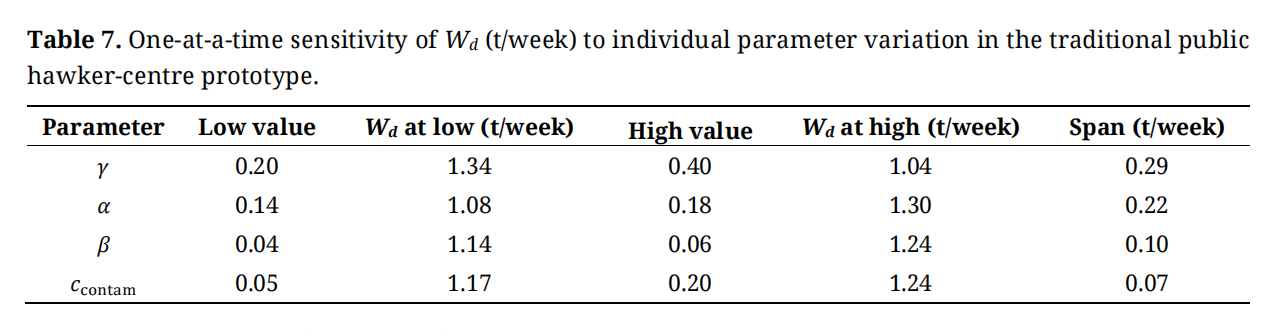 Table 7. One-at-a-time sensitivity of Wd (t/week) to individual parameter variation in the traditional public hawker-centre prototype.
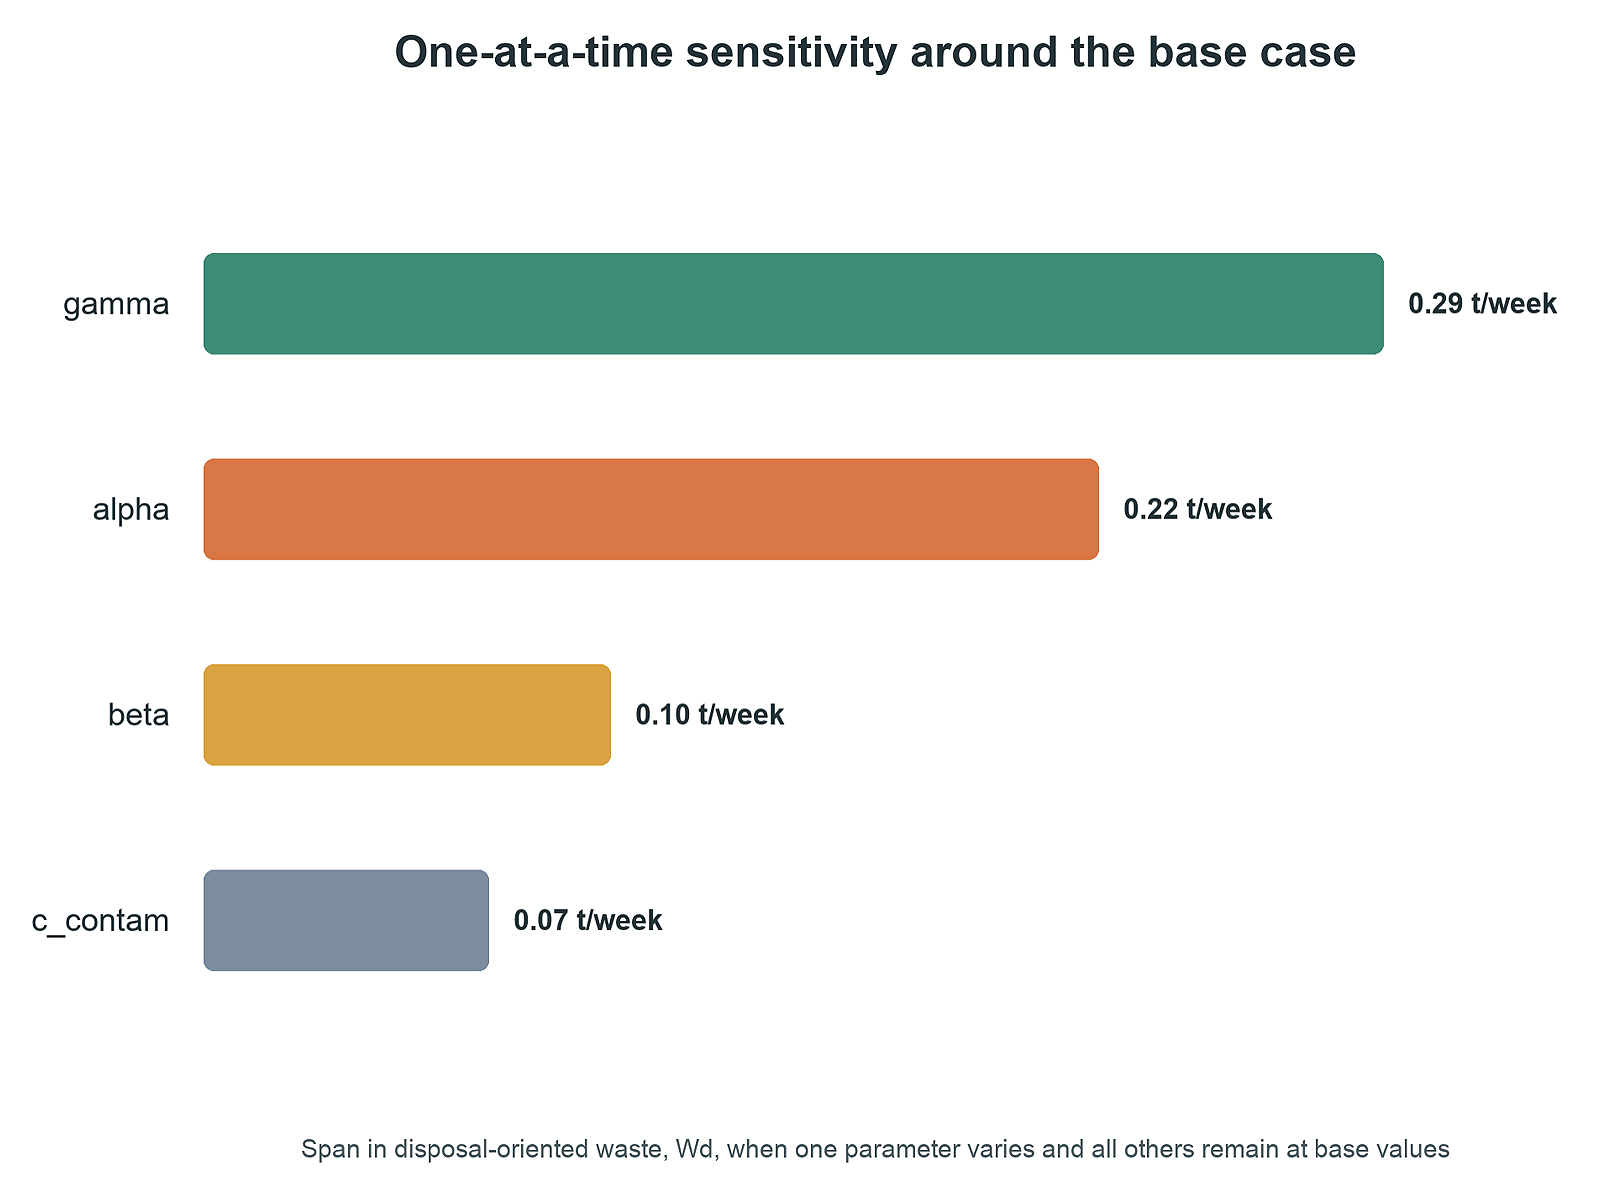 Figure 3. One-at-a-time sensitivity around the traditional public base case.
The OAT results confirm that γ has the largest individual effect on disposal-oriented waste, shifting Wd by 0.29 t/week across its range, compared with 0.22 t/week for α, 0.10 t/week for β, and 0.07 t/week for ccontam.
To test whether the parameter effects interact, a two-way analysis of γ and ccontam is shown in Table 8. At low γ (0.20), reducing ccontam from 0.20 to 0.05 lowers Wd by 0.05 t/week. At high γ (0.40), the same contamination improvement lowers Wd by 0.10 t/week—double the effect. This confirms that the parameters are not independent: contamination control becomes more valuable as segregation quality improves, because the treatment-ready stream is a multiplicative product of γ and (1 − ccontam).
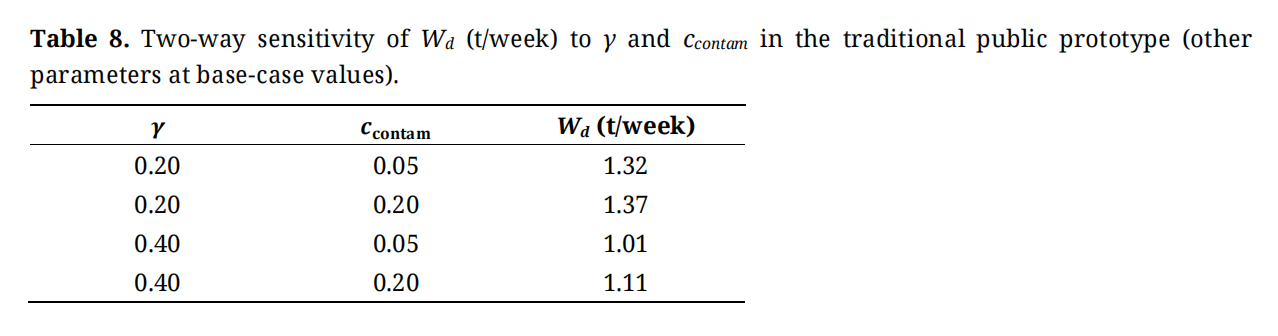 Table 8.
Two-way sensitivity of Wd (t/week) to γ and ccontam in the traditional public prototype (other parameters at base-case values).
Table 8.
Two-way sensitivity of Wd (t/week) to γ and ccontam in the traditional public prototype (other parameters at base-case values).
The sequencing conclusion—source reduction first, segregation improvement second, treatment pathway selection third—is supported by the full scenario-band comparison (Table 6) and by the interaction structure identified here, not by the OAT ranking alone. Table 6 varies all parameters simultaneously across a realistic operating range, and the combined conservative-to-ambitious shift reduces Wd from 1.64 to 0.76 t/week. The OAT contributes structural insight by identifying γ as the individual parameter with the largest leverage, while the interaction analysis clarifies that segregation and contamination control are complementary rather than independent targets.
Cross-Prototype ComparisonTable 9 compares all five prototypes using base-case points and prototype-specific low-high ranges. The ranges apply the parameter bounds in Table 4 to every prototype, correcting the unequal uncertainty treatment in the original manuscript.
Evidence strength differs across the rows. The traditional public hawker-centre prototype is the main observation-grounded case. The integrated community and educational prototypes have stronger public and observational handling evidence than the mall and tourist-intensive prototypes, which rely more heavily on scale indicators and management logic.
The comparison shows that stronger-control settings do not necessarily generate the smallest absolute food-waste flow. The new integrated community prototype produces 1.74 t per week in the base case, close to the traditional public prototype’s 1.72 t. Its advantage lies in the contamination-adjusted treatment-ready mass: 1.24 t per week, compared with 0.46 t in the traditional prototype. Similar total waste therefore has a different routing implication when return infrastructure and handling control are stronger.
The high-end mall and educational prototypes show the same pattern more clearly. Their base treatment-ready masses are 0.75 and 0.66 t per week, respectively. These settings benefit from single-operator or institutional authority, repeated rules, cleaner contracts, and more controllable collection points. Their comparative advantage is less a simple reduction in waste generation than a stronger ability to keep waste inside a controlled chain. The cross-prototype comparison is visualized in Figure 4.
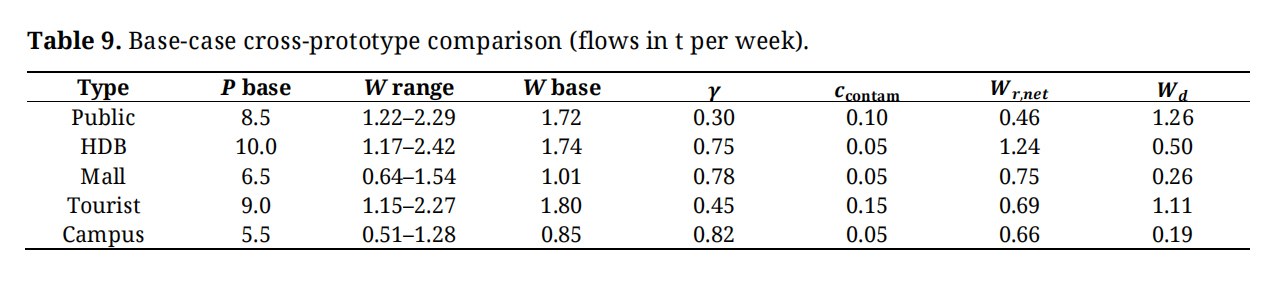 Table 9. Base-case cross-prototype comparison (flows in t per week).
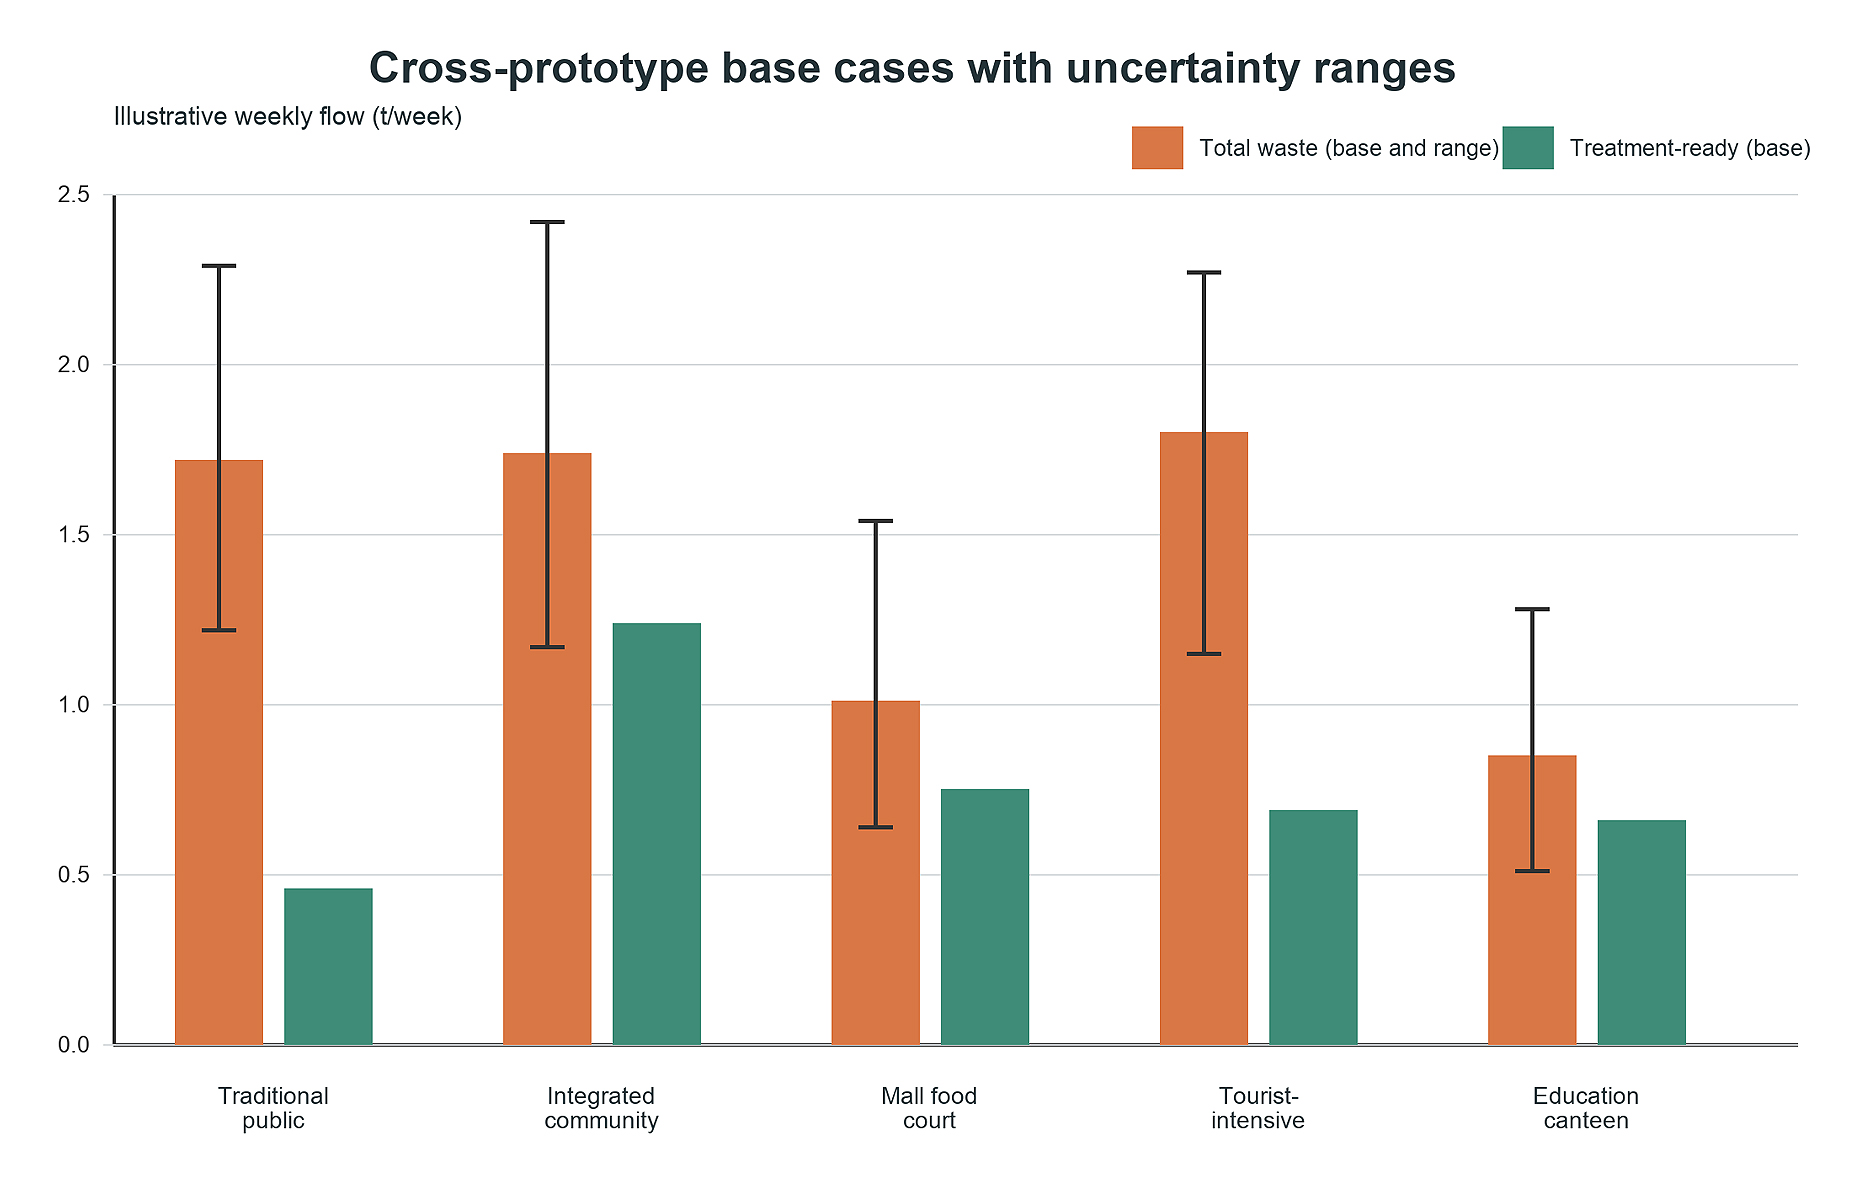 Figure 4. Cross-prototype base cases with total-waste uncertainty ranges and contamination-adjusted treatment-ready mass.
The tourist-intensive prototype is different. It has a base total waste flow of 1.80 t per week and 1.11 t remains disposal-oriented after the 15% contamination adjustment. Its β value is the highest in the base-case set, reflecting peak demand, visitor churn, and more variable tray-return behaviour. The result suggests that a centre can have formal management attention and still struggle to maintain treatment readiness when diner behaviour is inconsistent and cleaning pressure is high.
The traditional public prototype remains disposal-dependent because its midstream control is weak. Its γ value is lower than the newer, mall, and campus prototypes, and a large residual share remains disposal-oriented. This does not mean that traditional public hawker centres lack scope for improvement. It means that the first improvement target is usually the operating chain: stall-level separation, tray-return design, cleaner workflow, covered storage, and measurement at consolidation points.
The cross-prototype results also show why a single food-waste benchmark can be misleading. If policy tracked only t of waste generated, the integrated community prototype would appear similar to the traditional public prototype. If policy tracked only recycling intent, the difference could still be unclear because both settings can install bins or send a share of waste to treatment. The accounting distinction that matters is how much of the generated waste remains segregated and usable. This is the practical bridge between behavioural measures and treatment outcomes.
As an order-of-magnitude calibration check, applying the traditional prototype’s 1.22–2.29 t/week range to 123 NEA-managed markets and hawker centres gives approximately 7,800–14,600 t per year, or about 1.0%–1.9% of Singapore’s 784,000 t of annual food waste. This does not validate an individual centre, and the 123 facilities are heterogeneous, but it shows that the assumed scale does not create an obvious contradiction with the national total. The comparison is not a sectoral burden estimate: its numerator covers NEA-managed markets and hawker centres, whereas the prototype set also includes mall food courts and institutional canteens that are outside that count. Its purpose is to calibrate the order of magnitude of a representative public-centre prototype, not to imply that hawker centres account for a large share of national food waste.
The results therefore support a sequence: reduce avoidable generation, improve segregation and contamination control, then select treatment pathways. For traditional public hawker centres, this sequence is especially important because downstream treatment equipment cannot compensate for an unstable feedstock. For integrated centres, malls, and institution-managed canteens, the stronger routing base allows more advanced treatment trials to be considered earlier, provided labour, odour, storage, utility, and contractor issues are managed.
The mass-flow results do not establish whether AD, composting, BSF, or incineration has the lowest greenhouse-gas impact or cost. They establish the quantity and quality of feedstock that a subsequent technology-specific appraisal must use.
The results support a hawker-centre-specific decision-support framework in which the prototype determines the binding operational constraint. In the traditional public prototype, the OAT sensitivity analysis showed that the gross segregation rate (γ) has the largest single-parameter effect on disposal-oriented waste, confirming that midstream handling quality is the most influential variable. In tourist-intensive centres, elevated plate waste and peak-period contamination may dominate. In campus canteens and mall food courts, stronger governance makes treatment routing and measurement the next constraint. Grouping all centres under one generic waste category would hide these operational differences that determine treatment readiness.
The integrated accounting chain that separates preparation loss, plate waste, segregation, contamination, and routing provides more actionable information than total waste alone. As Table 9 shows, the traditional public and integrated community prototypes generate similar total waste but differ by more than a factor of two in contamination-adjusted treatment-ready mass. The chain also clarifies the complementary roles of source reduction, which prevents waste, and segregation, which determines the fate of waste that still occurs. Treatment pathways should therefore be compared only after a stable feedstock exists.
The practical sequence combines waste-hierarchy logic with the model’s sensitivity results. Prevention remains the first normative objective because it removes downstream handling needs, although the OAT analysis shows that γ has the largest marginal effect on Wd within the tested ranges. Segregation quality and contamination are therefore the main operational diversion targets. Treatment should be matched to the quality and reliability of the stream that a centre can actually produce, not to an assumed feedstock.
The same logic supports differentiated policy. Integrated centres, malls, and campus canteens may be better early candidates for controlled segregation pilots or decentralised treatment trials because their governance is stronger. Traditional public hawker centres need staged improvements in return infrastructure, cleaner workflow, and measurement before treatment technology can perform credibly. Tourist-intensive centres need designs that account for crowding and visitor churn.
For traditional public hawker centres, implementation should begin with modest but measurable controls: clearer tray-return nodes, food-only collection points where feasible, cleaner-assisted separation during peak periods, covered storage, routine contamination checks, and weekly measurement at consolidation points. For newer integrated centres and institution-managed settings, stronger management authority allows more advanced routing to be tested earlier, provided labour, odour, pest, storage, and utility constraints are managed.
Policy Implications and International ExperienceThe framework supports a staged policy package rather than an immediate universal tax or technology mandate. Stage 1 is a 12-week measurement protocol at representative centres covering Wk, Wp, Wr, contamination, and cleaner time. Stage 2 places food-only collection points, covered storage, contamination thresholds, and weekly reporting into operator and cleaning contracts, supported by targeted infrastructure grants. Stage 3 pilots weight-based or contamination-adjusted charges only at sites with reliable measurement and viable separate collection. Stage 4 evaluates AD, composting, BSF, or residual WTE using site-specific greenhouse-gas and cost data. This sequence makes the proposed innovation a monitored collection-and-routing system, not a single treatment machine.
South Korea provides the clearest international lesson for economic incentives: separate food-waste collection is paired with volume-based fees, including RFID weight measurement, so the generator receives a direct quantity signal [40]. Japan’s Food Waste Recycling Act provides a complementary producer-side lesson through sectoral reduction and recycling targets for food-related businesses [41]. Singapore should not copy either system wholesale. Hawker centres involve shared trays, multiple stallholders, common cleaners, and limited back-of-house space. A suitable adaptation is therefore centre-level measurement and operator accountability first, with stall- or diner-level charging considered only after responsibilities and data quality are clear.
The international circular-economy evidence also cautions against relying on one instrument. Taxation, research and development, education, and producer responsibility work as a package [23]. For Singapore hawker centres, the corresponding package is measurement, infrastructure co-funding, contract standards, cleaner training, public communication, and a later performance-linked fee or rebate. The present model can identify where these instruments act in the chain, but it does not estimate their fiscal or welfare effects.
The analysis also points to a monitoring agenda. Four measurements would substantially improve future calibration: kitchen-stage loss, plate waste, gross source-segregated mass, and contamination-adjusted treatment-ready mass. These data are simple relative to full LCA or project appraisal, but they would allow future work to replace scenario assumptions with centre-specific evidence.
Several limitations define the scope. The model compares flows within a hawker-centre decision context and does not estimate market responses or upstream food-production burdens. It does not include direct weighing audits, so most parameters remain partly assumption-driven. Site-observation coverage is limited to three locations, and Bukit Batok West is an operational analogue rather than the source of the main mass calibration. The prototype approach simplifies heterogeneity in centre size, stall mix, and customer turnover. No greenhouse-gas or cost results are computed; treatment rankings are therefore outside the findings. These limitations make the outputs illustrative, but the explicit ranges and equal-footing sensitivity checks make them testable in future field audits.
This paper has developed a Singapore hawker-centre and food-court-specific decision-support framework for food-waste analysis. It begins from five operational prototypes and applies an accounting model that links procurement, preparation loss, plate waste, source segregation, contamination adjustment, routing, and treatment. The purpose is to support bounded scenario comparison under practical operating constraints.
The results show that the decisive divide across settings is the ability to keep food residuals inside a controlled chain. Stronger-control settings do not always produce less waste in absolute terms, but they retain a larger treatment-ready share. In the traditional public hawker-centre prototype, weak midstream segregation and contamination control keep much of the stream disposal-oriented. In integrated centres, malls, and institution-managed canteens, stronger authority and infrastructure make separate treatment more plausible.
The main practical conclusion is sequential. Source reduction comes first because it prevents waste generation. Segregation quality and contamination control come second because they determine whether a usable stream exists. Treatment comparison comes third because AD, composting, and BSF can only perform well on material that remains treatment-ready. The paper’s contribution is therefore a structured way to compare intervention priorities across Singapore public dining settings without overstating empirical precision.
Future work should add direct weighing audits, contamination checks, and labour-time measurement before introducing Singapore-specific cost and greenhouse-gas factors. Those additions would allow the framework to move from illustrative scenario analysis toward site-level evaluation and implementation planning.
The model inputs used in this study are reported in the manuscript. Supporting source documentation, calculation notes, and non-participant site-observation notes are available from the corresponding author upon reasonable request, subject to removal of any incidental identifying information.
Conceptualization, HZ and LL; methodology, HZ and LL; investigation and evidence compilation, HZ; formal analysis, HZ and YL; writing—original draft, HZ; writing—review and editing, YL and LL; supervision, LL. All authors reviewed and approved the final manuscript.
The authors declare no conflicts of interest.
The authors declare that no specific funding was received for this work.
The authors have no specific acknowledgements to declare. Any remaining errors are the authors’ responsibility. During the preparation of this work, the authors used an AI-assisted coding tool for language editing. The authors take full responsibility for the content and conclusions of the manuscript.
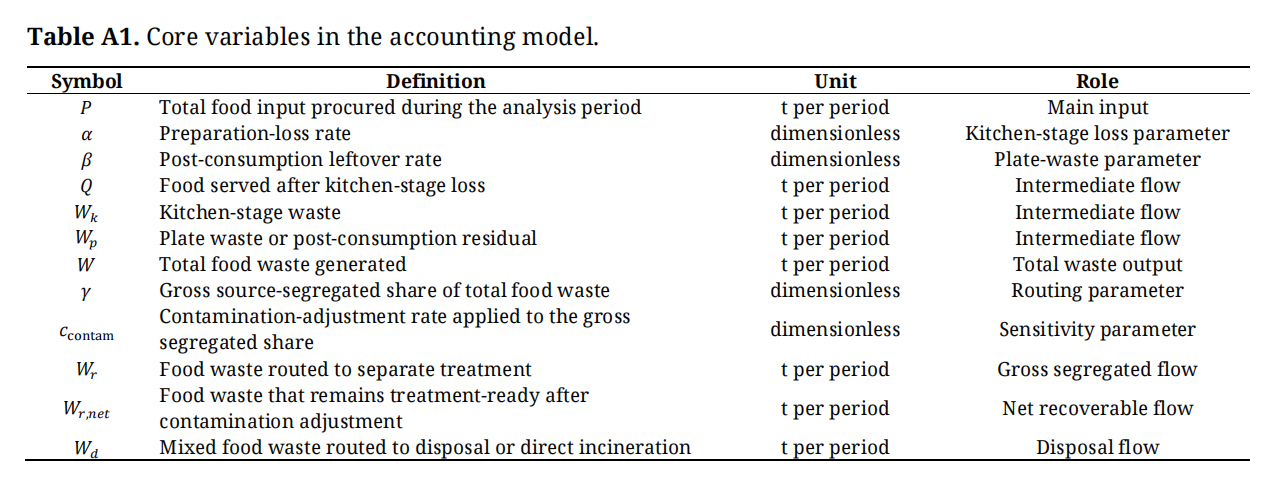 Table A1. Core variables in the accounting model.
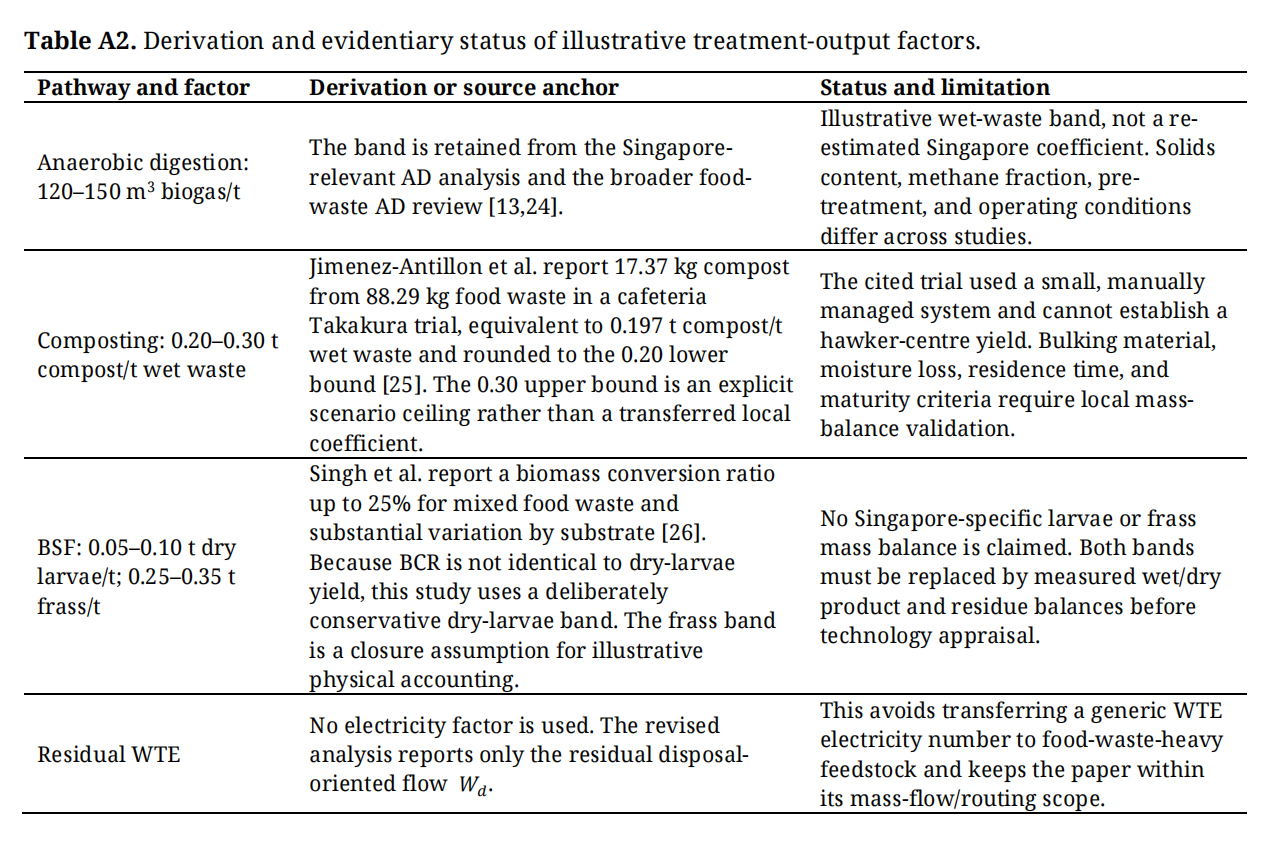 Table A2. Derivation and evidentiary status of illustrative treatment-output factors.
1.
2.
3.
4.
5.
6.
7.
8.
9.
10.
11.
12.
13.
14.
15.
16.
17.
18.
19.
20.
21.
22.
23.
24.
25.
26.
27.
28.
29.
30.
31.
32.
33.
34.
35.
36.
37.
38.
39.
40.
41.
Zhu H, Li Y, Loh L. Singapore Food Waste in Hawker Centres: A Scenario-Analysis Decision-Support Framework. J Sustain Res. 2026;8(3):e260073. https://doi.org/10.20900/jsr20260073.

Copyright © Hapres Co., Ltd. Privacy Policy | Terms and Conditions


