Location: Home >> Detail
J Sustain Res. 2026;8(4):e260087. https://doi.org/10.20900/jsr20260087
 ,
Elena Maggi *
Department of Economics, InExEc Research Center, University of Insubria, Varese 21100, Italy
* Correspondence: Elena Maggi.
Reducing carbon dioxide (CO2) emissions associated with higher education is a critical challenge for achieving sustainability goals. In this paper, the emissions of a multicampus university are analysed, with the goal of quantifying and assessing the main emission sources and providing recommendations for improving carbon accounting and reporting practices in the context of Italian universities. Emissions are examined across Scopes 1, 2 and 3, with a specific focus on the most impactful sectors: energy consumption and transportation. The assessment provides a baseline for future emission mitigation efforts, allowing comparison with other higher education institutions in Europe. The findings indicate that indirect emissions from commuting represent the greatest contribution to the University’s overall impact. On the basis of these results, a series of strategies for emission reduction and enhanced reporting transparency are proposed. This case study contributes to the growing research on carbon management in universities by offering insights and practical guidance for sustainability reporting in the Italian higher education sector.
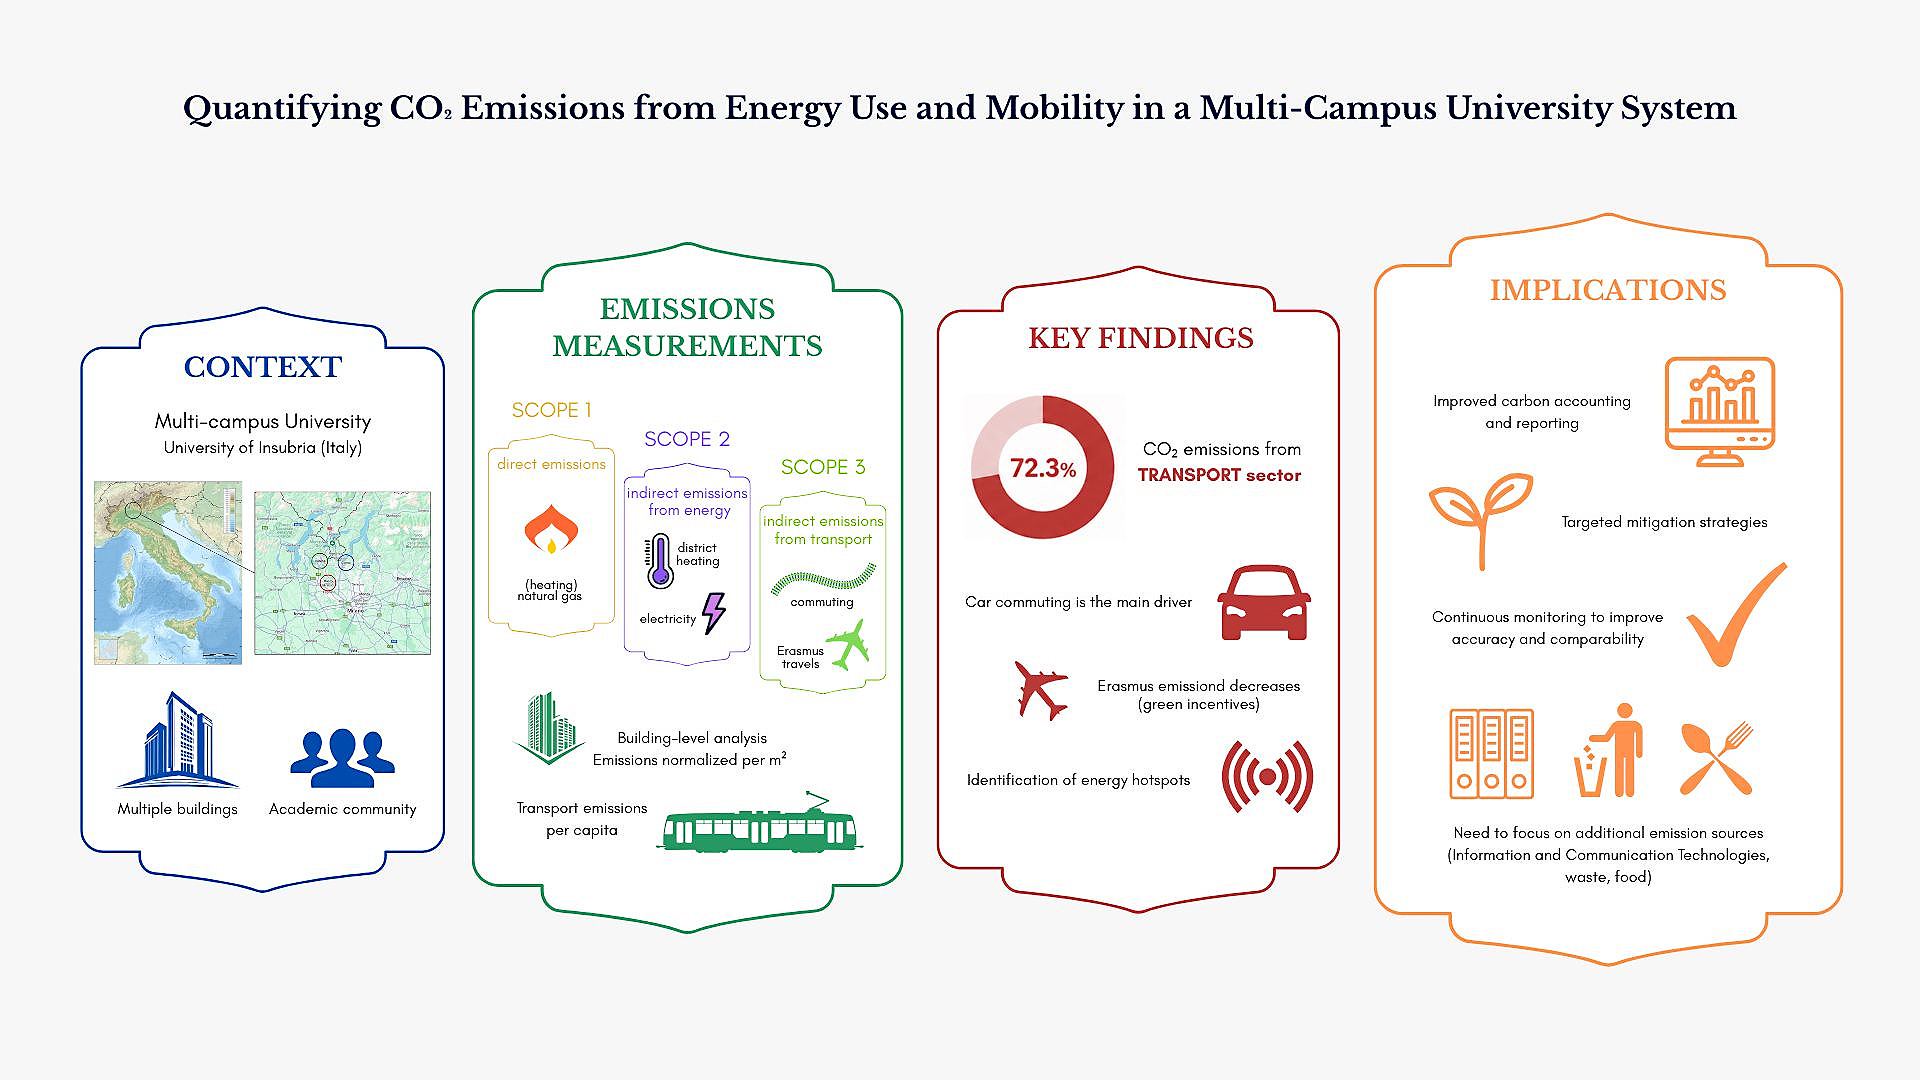
In recent years, higher education institutions have emerged as key actors in the transition to climate neutrality. Beyond their traditional roles in research and education, universities are increasingly engaging in operational sustainability, adopting measures to reduce their own environmental impact and to act as models for society [1]. Within this framework, the systematic measurement and reporting of carbon emissions represent crucial steps towards greater accountability and transparency. Across Europe, an increasing number of universities have undertaken comprehensive assessments of their greenhouse gas emissions, in accordance with internationally recognized guidelines and developing tools specifically designed for the academic sector [2].
In this context, Fiorani and Di Gerio (2022) [3] highlight that integrating the Sustainable Development Goals (SDGs) of the 2030 Agenda into university reporting frameworks can enhance transparency and comparability across institutions. Their analysis of Italian public universities revealed that only 42% have published sustainability reports, often adopting fragmented or context-specific approaches. There is currently no universally recognized approach for reporting greenhouse gas emissions at the university scale. As a result, higher education institutions have adopted different methodologies depending on data availability, institutional priorities, and the scope of their sustainability strategies. In this context, Boiocchi et al. (2024) [4] highlighted the importance of developing context-independent indicators to ensure fair and unbiased comparisons of environmental performance among universities. Their study demonstrated that normalizing data relative to institutional size, population, and spatial characteristics can significantly improve the objectivity and transparency of sustainability assessments.
Yañez et al. (2020) [5] emphasized the importance of clearly defining system boundaries and including both direct and indirect emission sources in campus-level carbon inventories. Despite this, some universities have focused on quantifying only the main emission sources, such as electricity and natural gas consumption, while others have developed more comprehensive frameworks that integrate multiple emission categories. Among these, Yang et al. (2025) [6] proposed an innovative carbon accounting framework for a university campus in Sichuan, China, which integrates multiple emission sources—including electricity, natural gas, thermal energy, commuting, business travel, and food—and quantifies uncertainty using Monte Carlo simulations, an approach that provides a replicable methodological tool to allow universities to systematically identify the most impactful and uncertain emission sources. Naderipour et al. (2021) [7] conducted a comprehensive assessment of the carbon footprint at Universiti Teknologi, Malaysia, focusing on emissions generated by transportation, electricity consumption, water use, and waste management. Their results revealed that transportation, particularly air travel by staff and students, represented the largest share of total CO2 emissions, followed by electricity consumption.
Focusing on the Italian context, Battistini et al. (2023) [8] carried out a detailed carbon footprint assessment for the University of Bologna, one of the first large multicampus universities to systematically evaluate its emissions. They integrated and multidisciplinary approaches provide valuable examples of how universities can develop comprehensive carbon management systems that support evidence-based decision-making and long-term climate neutrality objectives. Similarly, Genta et al. (2021) [9] applied the ecological footprint methodology to the Politecnico di Torino campus and quantitatively assessed the environmental impacts of energy consumption, transportation, food, waste, land use, and water. They demonstrate how footprint analysis can serve as a practical tool to identify sustainability hotspots and inform targeted management strategies within university settings. These experiences underline how carbon accounting within universities is not merely a technical exercise but rather a strategic instrument to guide sustainability policies, foster behavioural change, and contribute to global climate goals. Complementing these approaches, Lodi et al. (2017) [10] analysed the energy consumption and greenhouse gas emissions of the University of Modena and Reggio Emilia campus, focusing on the role of building management and usage patterns. By normalizing energy consumption to building volume and hours of operation, they identified the most energy-intensive buildings and demonstrated that operational factors, not only building infrastructure, significantly affect emissions.
Building on this growing body of practice, the present research focuses on the case of the University of Insubria (Lombardy, Italy), a significant multicampus institution with several peripheral sites characterized by medium-to-low accessibility, representing a particularly relevant case within Italy’s leading economic region. This study aims to explore the CO2 emissions related to energy consumption and transportation and to provide practical recommendations for improving carbon reporting in the context of Italian higher education. In this regard, the study not only contributes to a deeper understanding of institutional carbon performance but also investigates ways to enhance the accuracy of emission calculations. This research is further distinguished by its focus on a multicampus university with geographically dispersed and peripheral sites, a configuration that introduces additional complexity to emission assessment, particularly in relation to mobility patterns and infrastructure use. By refining the methodology and presenting detailed quantitative results, the research offers insights that can support the development of more precise sustainability policies and benchmarking practices across the academic sector.
The paper is structured as follows. After the Introduction, the Materials and Methods Section defines the organizational and operational boundaries of the study, describes the data collection process, and presents the methodology adopted for emission quantification, including the emission factors used to estimate total CO2 emissions. The Results Section first reports findings related to the energy sector (natural gas, district heating, and electricity) and then presents those related to the transportation sector (commuting and student Erasmus mobility). Finally, the Discussion and Conclusions Section interprets the main findings, outlines their implications, and highlights directions for future research.
The University of Insubria is a multicampus public institution that offers a wide range of undergraduate, graduate, and doctoral programs. Its size is medium in comparison to that of the other Italian universities: the academic community includes more than 13,580 students, PhD candidates, faculty, and technical-administrative staff.
In 2024, the University conducted its first comprehensive greenhouse gas (GHG) inventory to quantify, monitor, and reduce its environmental impact. Covering the 2022 and 2023 calendar years, the initiative aims to identify and mitigate both direct and indirect emissions while applying compensation measures for those that cannot be fully eliminated. By adopting standardized accounting methodologies consistent with ISO 14064-2019 and the GHG Protocol, the University ensures accurate monitoring and benchmarking of its emissions, strengthening its commitment to sustainable practice and responsible innovation.
The analysis is structured in several phases: first, the reference period and operational boundaries are defined; second, the main emission sources are identified, and the calculation methods are described. The results for energy-related emissions (Scopes 1 and 2) are presented in the subsequent sections, followed by an assessment of mobility-related emissions (Scope 3), including the daily commute of students and staff and Erasmus travel.
Organizational BoundariesThe organizational boundaries of the study encompass all the facilities and buildings where the University of Insubria performs its institutional, academic, and administrative activities. As illustrated in Figure 1, the University’s premises are geographically distributed across the main campuses of Varese, Como, and Busto Arsizio, which are located in the Lombardy region of northern Italy. Varese attracts most of the academic population (76%), followed by Como (23%).
The University’s building assets consist of a diverse set of facilities, including both recently constructed structures and older buildings that have been renovated over time to meet academic and operational needs. Emissions are calculated for all buildings under the University’s direct ownership as well as those used under lease or free-use agreements.
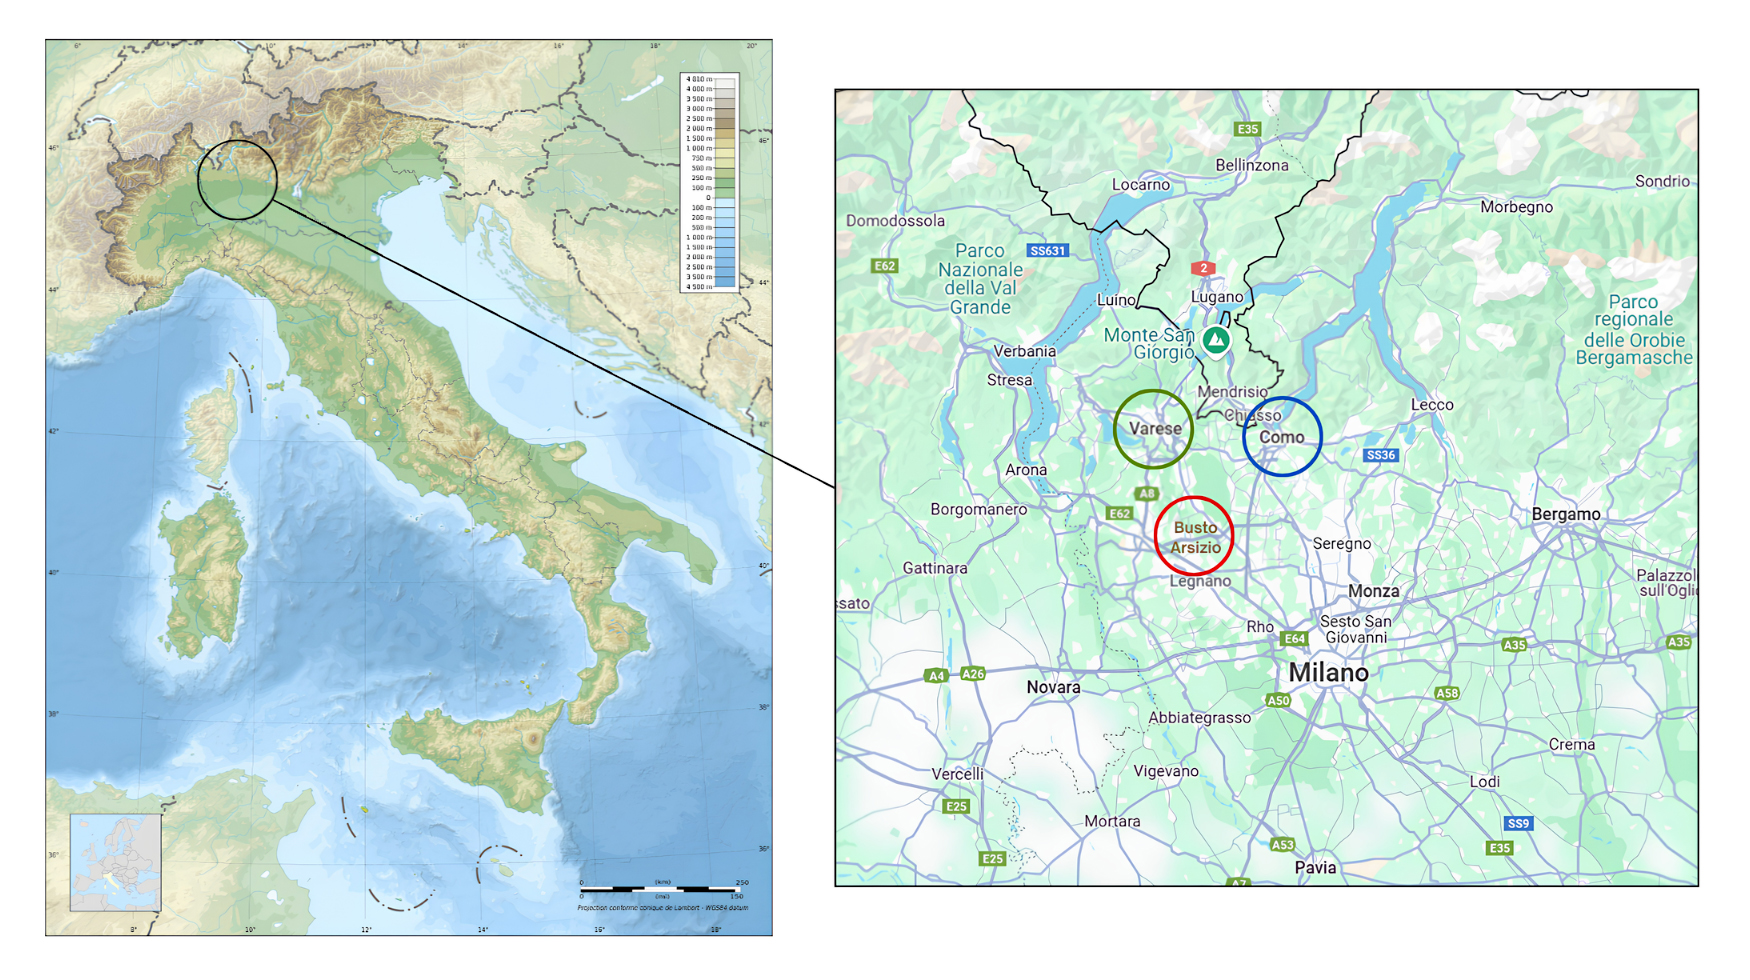 Figure 1. Geographical distribution of the University of Insubria campuses in Varese (V), Como (C), and Busto Arsizio (B). Source: Google Maps and Italy map by Eric Gaba (Sting).
The facilities considered in the study include lecture halls, libraries, laboratories, hospitals, offices, and other academic spaces, each characterized by distinct patterns of energy consumption, particularly for heating, cooling, and electricity. In addition, university residences and sports facilities are included within the defined organizational boundaries.
Operational BoundariesIn defining the scope of analysis, operational boundaries were established to identify all relevant activities and sources of greenhouse gas (GHG) emissions associated with the University’s operations. The classification follows the three internationally recognized categories of the GHG Protocol, distinguishing between direct and indirect emission sources according to the level of institutional control and influence.
Scope 1 includes direct emissions resulting from onsite fuel combustion for heating and energy generation. These activities fall under the direct responsibility of the University and represent the portion of emissions over which the institution has the highest degree of control. Scope 2 covers indirect emissions linked to the consumption of purchased electricity and district heating. Although these emissions occur off-site, they reflect the environmental consequences of the University’s energy supply decisions and thus remain a key area for mitigation strategies. Scope 3 accounts for a wide range of indirect emissions that are generated by activities that take place beyond the University’s physical and organizational boundaries but are nonetheless associated with its operations. These include the daily commuting of students and staff, Erasmus-related travel, water consumption, waste generation, and emissions embodied in goods and services procured by the institution. The incorporation of Scope 3 emissions provides a more comprehensive and realistic representation of the University’s overall carbon footprint.
The present study includes emissions from five main sources: natural gas for heating, district heating, electricity consumption, commuting by the academic community, and Erasmus travel. Some potential emission sources, such as consumable goods, waste, and food services, were excluded because of data limitations. In particular, consumable materials are managed independently by each department, making consistent and verifiable data collection challenging. Similarly, waste data are not currently recorded by weight, and food-related emissions could not be quantified, as the University does not directly operate any canteen or catering facilities.
Data CollectionThe quantification process began with the collection of activity data related to the main sources of greenhouse gas (GHG) emissions within the university’s operational boundaries. Following the methodological approach suggested by the Italian University Network for Sustainable Development (RUS) guidelines [11], the analysis focused primarily on carbon dioxide (CO2), which represents the predominant component of GHG emissions in the academic context. Other gases, such as CH4, N2O, and F-gases, were not included because of their marginal contributions compared with CO2.
Energy consumption represents a major emission source within the University. Heating systems operate either through the direct combustion of natural gas or via district heating supplied by external providers. Emissions from natural gas result from onsite combustion in boilers or heating plants and are classified under Scope 1, as they are directly controlled by the university. Data on gas consumption were collected from monthly utility bills, expressed in standard cubic meters (Smc).
District heating, whose adoption has been growing in recent years because of public incentives and the shift towards more sustainable energy technologies, falls under Scope 2. Consumption data were obtained from supplier invoices and reported in megacalories (Mcal). Electricity consumption data were also sourced from supplier bills and online portals, expressed in kilowatt hours (kWh).
Since all electricity used by the University is purchased from external sources, the related emissions are classified under Scope 2.
Mobility emissions were assessed for two main categories: daily commuting by students and staff and international travel related to Erasmus exchanges. Business travel and emissions from the University’s two institutional vehicles were excluded because of their negligible contribution.
Commuting data were collected through a survey conducted between 2022 and 2023, which gathered information on the average number of days per week spent attending the university, travel distances, transportation modes, and vehicle occupancy rates. For car users, respondents were asked to indicate the number of passengers, allowing for a more accurate estimation of per capita emissions. The average reported car occupancy was 1.67 passengers per vehicle; however, following RUS recommendations, a conservative correction factor of 1.2 commuters per car was applied to account for possible overlaps among respondents. This overlap may have occurred because the questionnaire was administered at the individual rather than at the vehicle level: when multiple passengers sharing the same car each completed the survey, the same carpooling trip could be counted more than once (once per respondent), each reporting the same occupancy value. This tends to inflate the person-weighted average occupancy relative to the actual vehicle-weighted occupancy, justifying the use of a more conservative correction factor. The survey reached approximately 20% of students, 18% of PhD candidates, 13% of research fellows, 58% of academic staff, and 63% of technical-administrative personnel.
Erasmus-related travel was also included in the analysis. In particular, for the analysis, trips that began and ended within the same calendar year (2022 or 2023) were counted as round journeys, while those spanning two years (e.g., departures in 2021 with a return in 2022 or departures in 2023 with a return in 2024) were counted as single one-way trips.
Since travel reimbursements are not typically provided for Erasmus mobility, precise information about the transportation mode is often unavailable. Therefore, it was assumed that most international trips were made by air, except for short distances (<300 km), where train travel was considered, broadly consistent with the transport literature indicating that rail tends to remain competitive with air for distances up to approximately 300–350 km [12–14]. This binary assumption (rail below 300 km, air above) represents a simplification of actual modal choice, which can also be influenced by factors such as ticket cost, route availability, and individual preference. Even so, it was adopted in the absence of more detailed data on transportation mode.
Starting from the 2022/2023 academic year, the University introduced green travel incentives—financial bonuses for students and staff who used low-emission or shared transport (e.g., train, bus, or car sharing) in line with the Erasmus National Agency’s recommendations. Since travellers must declare their transportation mode to qualify for reimbursement, reliable data on alternative modes became available from the second half of 2022 onwards.
MethodologyFollowing data collection, the quantification of greenhouse gas emissions was performed by applying standardized emission factors to the activity data associated with each emission source. The estimation process relies on a proportional relationship between the magnitude of the activity and the corresponding emissions, following a widely adopted approach in environmental accounting. In this framework, emissions are calculated as the product of an activity indicator, such as fuel consumption, energy use, or distance travelled, and a specific emission factor representing the amount of CO2 released per unit of activity.
where Ei denotes the total CO2 emissions (g/year); A represents the activity data (e.g., fuel consumption or electricity use); and FEi is the emission factor associated with the corresponding activity (g/unit of activity).
Emission factors were obtained either directly from energy suppliers or from authoritative national sources. In particular, for district heating systems, the factors were provided by the utility companies on the basis of the certified primary energy conversion factor (FEP), whereas for all other sources, data were drawn from the Italian Greenhouse Gas Inventory 1990–2022, published by the ISPRA [15]. This report, prepared in compliance with the United Nations Framework Convention on Climate Change (UNFCCC) and the EU Greenhouse Gas Monitoring Mechanism, provides harmonized emission factors, data sources, and methodological criteria for estimating national GHG emissions.
Since updated national factors for 2023 were not yet available at the time of this study, emission factors from 2022 were adopted for both years under analysis. The emission factor (EF) for natural gas was set at 58.918 tCO2/TJ. For district heating, values were derived from the energy mix of local networks: in Varese and Busto Arsizio, where the supply is entirely based on natural gas, EFs were obtained by multiplying the supplier’s certified FEP by the national standard factor for natural gas, yielding 242.12 gCO2/kWh for Varese and 487.40 gCO2/kWh for Busto Arsizio. These FEP certifications refer to the 2022 reporting year and remain valid for two years.
With respect to electricity consumption, the University operates both low-voltage (LV) and medium-voltage (MV) connections. The emission factor for electricity consumption (FEMT) was adjusted to account for network losses at different voltage levels according to the following relationship:
where FEISPRA is the national electricity emission factor (289.2 gCO2/kWh for 2022, as reported by the ISPRA in 2023 [16], and PBT represents the distribution losses to the low-voltage network. For northern Italy, losses were assumed to be 0.1% for MV and 0.94% for LV. Considering the University’s balanced mix of MV and LV connections, an average loss of 0.5% was applied, resulting in a final adjusted factor of 287.8 gCO2/kWh.
For transport-related emissions, distances travelled [17] were used as the activity indicator and converted to CO2 emissions using mode-specific factors. Erasmus travel emissions were estimated by multiplying the travel distance by the emission factor of the corresponding transport mode, while commuting emissions were extrapolated from daily trip distances to annual values. Emission factors for road transport were obtained from the ISPRA [18], distinguishing between vehicle-level and passenger-level emissions. The factors for rail and water transport were sourced from the Mobitool database [19], and those for air travel were from the International Civil Aviation Organization (ICAO) [20]. For rail transport, regional train factors were applied to commuting trips, whereas high-speed train factors were used for Erasmus travel.
All the emission factors (EFs) adopted in this study are summarized in Table 1. These include values for both energy consumption (e.g., natural gas, district heating, and electricity) and mobility-related activities (e.g., commuting and Erasmus travel). The EFs were derived from national and international databases, ensuring consistency and comparability with recognized reporting standards.
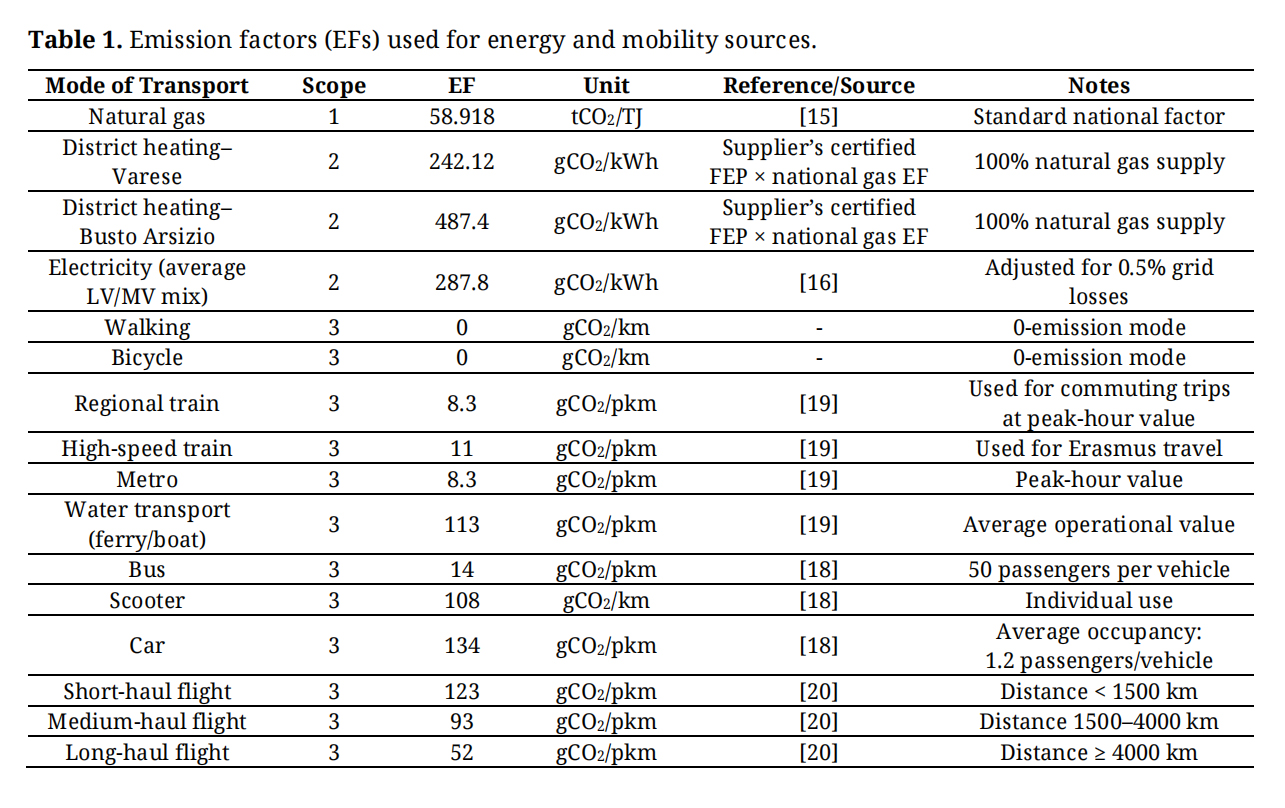 Table 1. Emission factors (EFs) used for energy and mobility sources.
Energy consumption represents one of the main sources of greenhouse gas emissions and plays a crucial role in the environmental balance of university operations. In this section, CO2 emissions associated with heating systems are analysed, considering two main energy carriers: natural gas (Scope 1) and district heating (Scope 2). A subsequent subsection examines electricity consumption and its related emissions.
Natural GasNatural gas produces direct CO2 emissions through combustion processes, which were calculated on the basis of the volume consumed (measured in standard cubic meters, Sm3) and the corresponding emission factor.
The distribution of CO2 emissions per unit of floor area (kgCO2/m2) associated with natural gas use for space heating in different buildings, which is calculated by multiplying the total consumption by the emission factor recommended by the ISPRA for this fuel type, is shown in Figure 2. The inner and outer rings correspond to 2022 and 2023, respectively. These values do not represent the total building emissions but are normalized by the developed area, providing a measure of the specific environmental impact per square meter. This approach allows direct comparisons between buildings of different sizes and usage profiles. In this study, emissions were estimated on a building-by-building basis to identify those facilities that require priority energy efficiency interventions. The results show that facilities such as Villa Toeplitz, the Sports Hall, and the former Ex colonia agricola consistently display the highest emission intensities in both years. In contrast, the city hotel building, which was converted into a student residence in central Varese and became operational in 2023, shows emissions only for that year, as it was not in use in 2022. At the campus level, natural gas emissions were 385.23 tCO2 in Como and 417.84 tCO2 in Varese in 2022 and 369.77 tCO2 and 482.85 tCO2, respectively, in 2023, reflecting a decrease at the Como campus and a corresponding increase at the Varese campus.
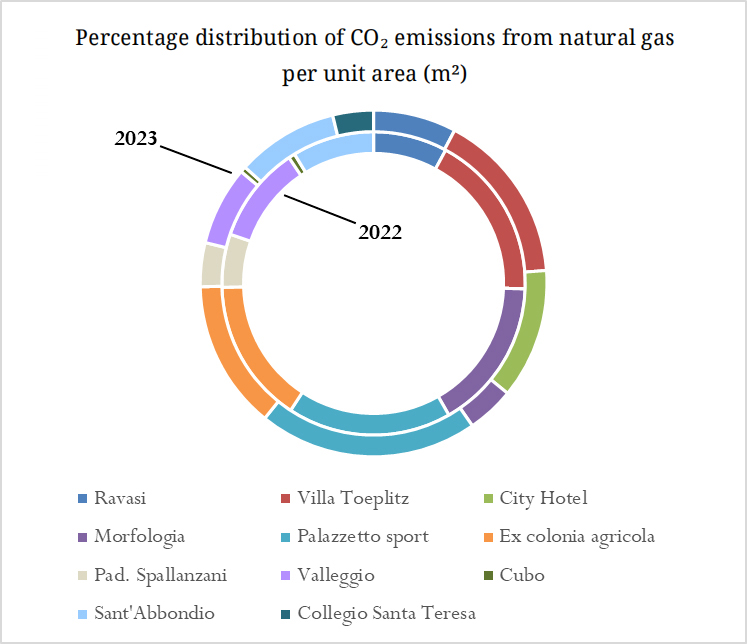 Figure 2. Comparison of 2022 and 2023 in terms of the percentage distribution of CO2 emissions per unit area (kgCO2/m2) from natural gas consumption.
District heating, while generally more energy efficient because of centralized heat generation, involves indirect emissions that are associated with the primary energy source, which in this case is entirely based on natural gas.
CO2 emissions resulting from district heating use in selected buildings located at the Varese and Busto Arsizio campuses were calculated using emission factors provided directly by the respective energy suppliers. Although the same energy company managed both networks, the plants differed in configuration and efficiency; therefore, specific emission factors were applied for each campus.
The percentage distributions of CO2 emissions per square meter associated with district heating for the two years considered are shown in Figure 3. This normalization enables direct comparisons among buildings of different sizes, revealing variations and trends over time. The figure highlights how the specific impact of district heating-related emissions is distributed across buildings and how these values evolve, providing useful insights for identifying targeted energy efficiency interventions. At the campus level, district heating emissions were 1009.44 tCO2 in Varese and 408.83 tCO2 in Busto Arsizio in 2022, changing to 980.84 tCO2 and 431.92 tCO2, respectively, in 2023, showing a slight decrease in Varese and a corresponding increase in Busto Arsizio.
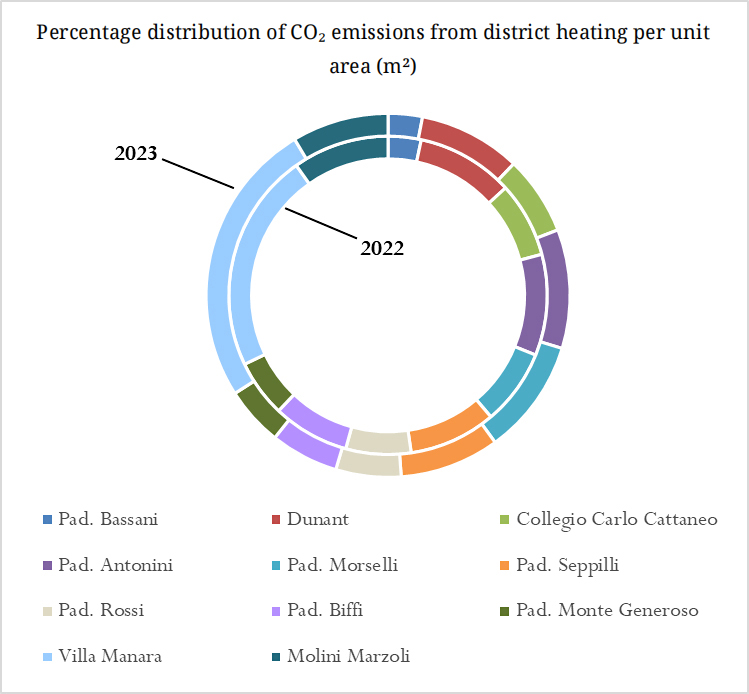 Figure 3. Comparison of 2022 and 2023 in terms of the percentage distributions of CO2 emissions per unit area (kgCO2/m2) from district heating.
Although electricity does not generate direct emissions during its use, it involves indirect emissions associated with its production, which depend on the national energy mix and the primary sources employed. To estimate CO2 emissions, the national average emission factor—updated to the reference year—was applied, accounting for grid losses related to the type of voltage (low and medium voltage in this case).
The double-donut chart in Figure 4 illustrates the percentage distribution of CO2 emissions per square meter resulting from electricity use in 2022 and 2023.
Among the analysed facilities, the buildings showing the highest emission intensity per unit area include Valleggio + Cubo (Como campus) and Dunant (Varese campus), highlighting areas where energy efficiency improvements could yield significant environmental benefits. At the campus level, the electricity-related emissions in 2022 were 1085.11 tCO2 in Como, 286.93 tCO2 in Varese, and 1019.91 tCO2 in Busto Arsizio, decreasing from 2023 to 1034.27 tCO2, 262.39 tCO2, and 994.59 tCO2, respectively, indicating a general downwards trend across all three campuses. These results provide a quantitative basis for assessing the environmental performance of a university’s facilities and identifying potential areas for mitigation.
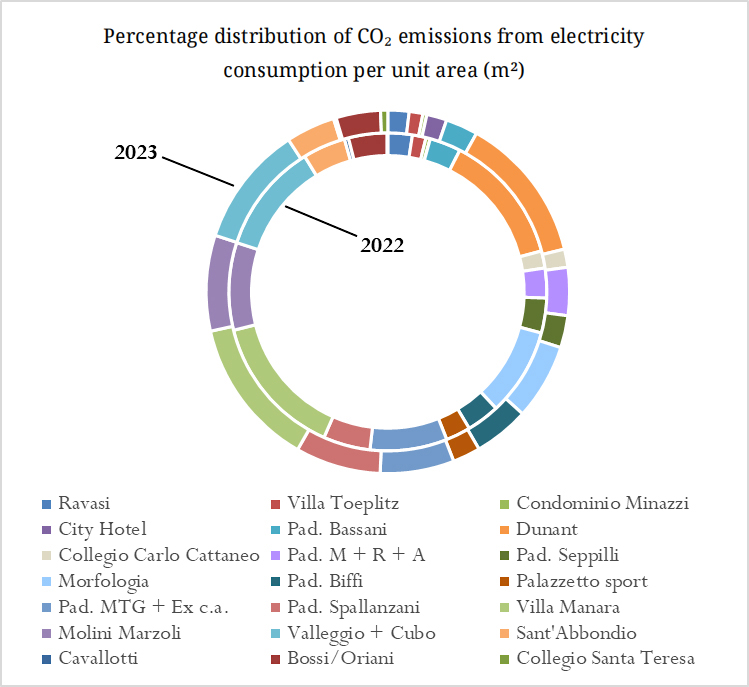 Figure 4. Comparison between 2022 and 2023 in terms of the percentage distributions of CO2 emissions per unit area (kgCO2/m2) from electricity consumption.
Even if the University does not have direct control over transportation-related emissions, since they largely depend on the travel choices of the academic community, this sector represents a significant share of the overall carbon footprint. For this reason, promoting low-impact mobility practices is essential. The University aims to encourage the use of sustainable transport modes through awareness campaigns and by supporting strategies that enhance the accessibility and safety of local public transport and cycling–pedestrian routes.
CompositeData on commuting habits were collected through a survey that was addressed to the entire academic community between December 2022 and January 2023. On the basis of the reported travel distances and transport modes, CO2 emissions were estimated using the emission factors listed in Table 1. Unlike other sectors, these data represent a projection rather than a complete census; for instance, since 20% of the students responded to the survey, their total emissions were extrapolated by a factor of five.
Reported distances were doubled to account for round trips and multiplied by the average number of commuting days per week. These were 4.21 days for technical–administrative staff, 3.83 for PhD students and medical residents, 3.64 for faculty and researchers, 3.63 for students, 3.12 for research fellows and collaborators, and 1.94 for adjunct professors. The total annual commuting days were weighted over approximately 200 working days per year; a figure consistent with the standard Italian academic/working calendar once weekends, public holidays, and university closure periods were excluded from the 365 calendar days.
In Figure 5, the left panel displays the estimated total annual kilometers travelled for each transport mode, while the right panel shows the corresponding total estimated CO2 emissions (in tons of CO2 per kilometer). Among all the modes, private cars account for the greatest share of the total distance travelled, exceeding 80 million kilometers, followed by trains, with approximately 35 million kilometers. Other modes—such as metro, bus (urban and extra urban), motorcycle, bicycle, and walking—contribute significantly less to the total travel distance.
A similar trend is observed in CO2 emissions: cars are by far the main source, with total emissions surpassing 11,000 tCO2, while all other transport modes show substantially lower values. Notably, trains and buses contribute moderately to total emissions because of their collective use, whereas walking, cycling, and electric scooters produce negligible emissions.
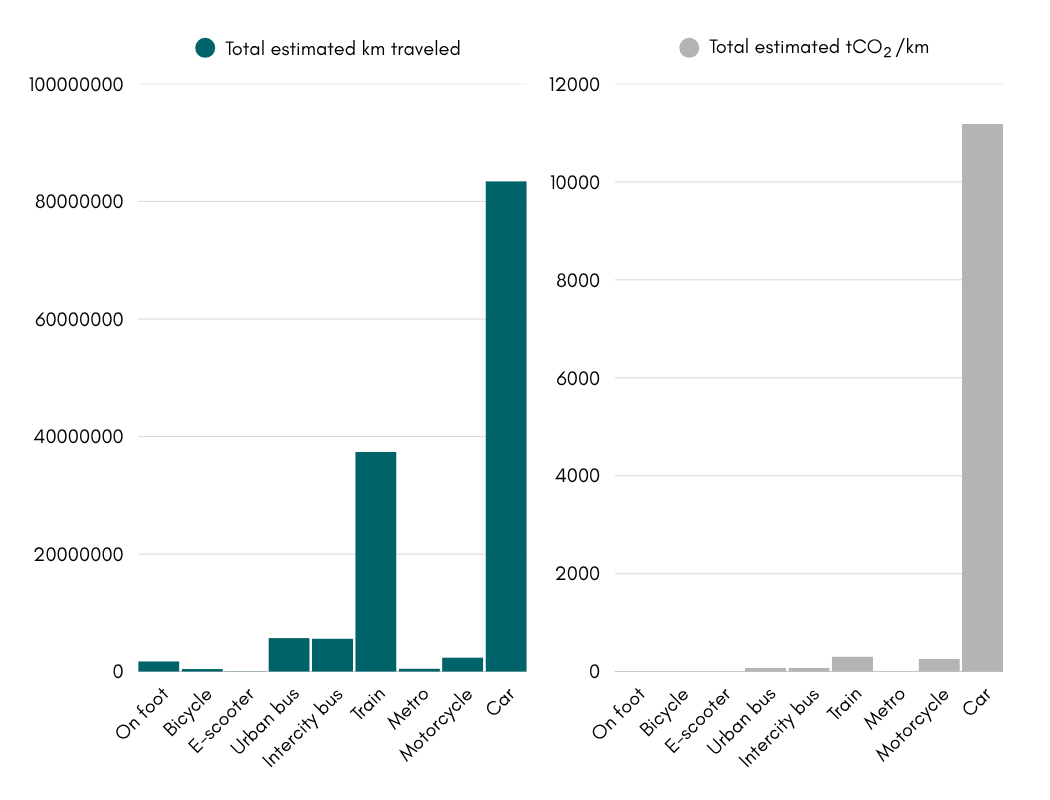 Figure 5. Estimation of the total commuting distance travelled during one year by the academic community and related CO2 emissions.
The estimation of emissions associated with Erasmus mobility was carried out by combining travel distances with transport-specific emission factors. The results indicate that air travel represents the dominant source of CO2 emissions, particularly short-haul flights, which account for more than two-thirds of the total in 2022, corresponding to approximately 33.5 tCO2. Medium-haul flights also contributed significantly, with an additional 14.8 tCO2 estimated for the same year. In 2023, a slight overall decrease in total emissions was observed—from 48.7 to 38.3 tCO2 for departures and from 37.2 to 27.0 tCO2 for returns—yet air transport remained the primary contributor, reflecting the strong dependence on this mode for international exchanges. Other transport modes, such as trains, buses, and cars, showed marginal contributions, each below 0.5 tCO2 per year.
In terms of destination patterns, Spain, Germany, and France emerged as the main receiving countries for Erasmus exchanges in both 2022 and 2023, together accounting for the majority of all departures. In particular, Spain showed a remarkable increase—from 86 students in 2022 to 154 in 2023—confirming its position as the most popular Erasmus destination. Germany and France followed, with 33 departures each in 2023, reflecting their consolidated academic partnerships with the University.
Other frequently chosen destinations included Portugal, Poland, and Ireland, which also recorded notable growth in outgoing mobility between the two years.
The results, summarized in Table 2, show that the largest share of total emissions is derived from Scope 3, particularly from commuting activities, which reflect the collective mobility choices of the academic community. Slight decreases in emissions are observed in Scope 1 and Scope 2, which are mainly associated with natural gas, district heating, and electricity consumption, suggesting partial improvements in energy efficiency and possibly more conscious user behaviour. Emissions related to Erasmus mobility also decreased between 2022 and 2023, partly because of changes in travel destinations and increased environmental awareness in the choice of transport modes, as well as the introduction of green travel incentives that may have further encouraged more sustainable mobility options.
Transport-related activities represent a major contributor to the total carbon footprint of the University of Insubria. In both 2022 and 2023, emissions from commuting and Erasmus mobility together accounted for approximately 72.3% of total emissions, highlighting the dominant impact of mobility within the university’s overall carbon profile. Within this category, commuting alone contributed approximately 99% of transport-related emissions, confirming that daily travel to and from the university by students and staff is by far the most impactful component of this sector. However, it should be clarified that as the commuting data were obtained directly from the respondents (approximately 20% in the case of students, according to the questionnaire response rate) and the results were projected from the respondents to the full population of each category, the findings provide a rough, but important, estimate of the impact of transport.
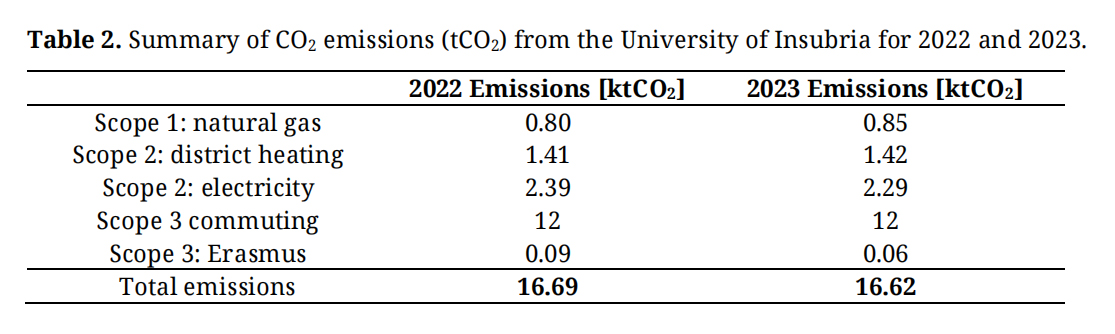 Table 2. Summary of CO2 emissions (tCO2) from the University of Insubria for 2022 and 2023.
Furthermore, since participation in the questionnaire was voluntary, the sample may have been affected by self-selection bias: respondents with more sustainable commuting habits could have been more likely to participate, potentially leading to an underestimation of commuting-related emissions. This type of bias is frequent and well documented in the travel survey literature [21].
A similar trend was observed at the University of Bologna [8], where transport also accounts for a substantial share of total emissions. In that case study, approximately 74% of the university’s transport-related emissions were linked to commuting, highlighting once again the relevance of mobility patterns in shaping the carbon footprint of higher education institutions. However, the University of Bologna adopted a broader accounting framework, including not only energy consumption (electricity, natural gas, and district heating) and transport but also business travel, waste management, procurement of goods and IT equipment, paper consumption, and building maintenance activities. These additional sources have not yet been assessed in the present analysis but could affect the total balance once included. Even Clabeaux et al. (2020) [22], in their analysis at Clemson University (USA), revealed that commuting alone accounted for more than 80% of transport-related emissions, with private car use responsible for approximately 78% of the total commuting footprint.
These results on commuting highlight the dominant environmental impact of private car commuting in terms of both total distance travelled and CO2 emissions, emphasizing the potential benefits of promoting more sustainable transport alternatives for university commuters. Similarly, the findings on Erasmus travel highlight that, despite the increasing availability of low-impact alternatives, air travel remains the primary mode of transport, underscoring the need for targeted mitigation strategies, such as promoting rail travel for medium-distance European destinations.
Energy consumption patterns and building-level emissions, as discussed in Section Energy sector, further contextualize these findings. Heating through natural gas and district heating represents a significant share of Scope 1 and Scope 2 emissions, with certain buildings, such as Villa Toeplitz and the Sports Hall, showing particularly high CO2 intensities per square meter. These observations align with those of Lodi et al. (2017) [10], who reported that both the physical characteristics of buildings and operational factors, such as occupancy and usage hours, strongly influence normalized energy emissions. The separation of emissions by energy source and normalization per unit area allows the identification of emission “hotspots,” providing actionable insights for energy efficiency interventions. Similarly, electricity-related emissions show distinct high-intensity buildings (e.g., Valleggio + Cubo and Dunant), demonstrating that simple, normalized indicators can guide targeted campus sustainability strategies even when detailed monitoring data are limited. Integrating this information with mobility-related emissions emphasizes that both building energy management and transport behaviour are key for reducing a university’s overall carbon footprint.
The study provides a snapshot of the current state of university emissions and serves as a baseline for defining targeted mitigation and adaptation strategies. The tool developed in this study not only enables performance measurement but also supports the development of evidence-based policies aimed at achieving broader sustainability goals, in line with national and international climate commitments.
The results also represent a starting point for encouraging behavioural change among university students and employees, in line with the concept of a “green campus” proposed by Naderipour et al. (2021) [7], which positions universities as effective testing grounds for carbon reduction strategies and sustainability education.
Finally, this work highlights important achievements in terms of methodological advancement and data collection optimization, establishing the foundation for a continuous monitoring process and the adoption of increasingly sustainable practices within the academic community. In this regard, the results of this study align with the approach proposed by Liu et al. (2024) [23], where the refinement of calculation parameters is used to improve the accuracy and representativeness of campus-level environmental assessments. Similarly, this research strengthens the reliability of emission accounting by carefully defining system boundaries and applying context-specific emission factors, thereby improving the robustness and comparability of the results and supporting more informed sustainability planning at the institutional level.
Future PerspectivesThe University of Insubria’s emission inventory represents an essential first step, yet its evolution should involve additional areas that are not currently monitored. A first direction concerns the inclusion of indirect emissions linked to business travel, as well as visiting professor mobility and joint PhD programs. While documentation on such travel is already available through administrative offices, data processing remains complex because of the need to reconstruct distances and transport modes. In the present study, business travel data were indeed collected but could not be reliably used to estimate emissions; for international flights, sometimes only the country of origin and destination is recorded, without city- or airport-level detail, whereas for train and other public transport, no information on specific routes is available. Establishing a standardized methodology would allow for more accurate estimates of the environmental impact associated with international academic mobility. A related limitation concerns Erasmus mobility emissions, which were estimated by assuming train travel for distances below 300 km and air travel otherwise, in the absence of detailed modal information; furthermore, it was not possible to account for occasional return trips to the home country that may have occurred during the exchange period because of a lack of data.
Another relevant line of improvement involves emissions from data centres and digital infrastructure. Considering the increasing role of ICT systems in university operations, assessing the carbon footprint of digital activities is crucial, as data centres are among the most energy-intensive components of modern institutions, with impacts highly dependent on energy efficiency and the source of electricity used.
In parallel, future assessments could include a carbon sequestration analysis of the green areas within and around university campuses. Estimating the pollutant absorption capacity of vegetation would allow a more balanced understanding of the net carbon impact and the potential for natural offsetting.
Although the present study focused primarily on the energy and transport sectors—which are identified as the main contributors to the University’s greenhouse gas emissions—other relevant sources deserve consideration in future assessments. These include food consumption, waste management, and water use, which, while not currently quantified, have the potential to significantly influence the institution’s overall environmental footprint.
Food systems play a substantial role in global CO2 emissions, particularly within university contexts where a large portion of the academic community consumes one or more meals daily on campus. Since the University does not directly manage canteens or cafeterias, it currently lacks operational control over food-related emissions. Nonetheless, indirect mitigation strategies could be adopted—such as including sustainability criteria in future tenders or partnership agreements. For instance, requiring that a significant share of products offered be locally sourced (zero-kilometer products) and plant-based would align with low-carbon dietary principles and promote climate-conscious food choices within the campus community.
Although the emissions associated with waste treatment are generally lower than those from energy or mobility, this sector remains an important component of a comprehensive carbon assessment. Within the university, waste streams can be divided into urban waste and special waste, the latter mostly originating from laboratory activities (e.g., chemistry, biology, and health care). However, assessing the impact of urban waste remains challenging because of the lack of consistent weight-based monitoring. Future improvements could include the implementation of sample-based weighing campaigns and waste management plans aimed at reducing the total amount of waste generated, yielding both environmental and organizational benefits, even if not directly reflected in GHG metrics.
While water use contributes only indirectly to greenhouse gas emissions, it represents a critical element of sustainable resource management. Current estimates of water consumption are still being refined and will be included in future inventories. The main objective is to establish a continuous monitoring system (expressed in cubic meters per year) capable of identifying consumption trends and supporting strategies to reduce water waste. Over time, integrating water efficiency measures with energy-saving interventions could further strengthen the University’s environmental performance and resilience.
Expanding the analysis to include these aspects will enable its transition from a descriptive accounting tool to a dynamic management model, supporting environmental planning and more integrated and scientific sustainability strategies.
The dataset of the study is available from the authors upon reasonable request.
Conceptualization, ACC and EM; methodology, ACC; software, ACC; validation, ACC and EM; formal analysis, ACC; investigation, ACC; resources, EM; data curation, ACC; writing—original draft preparation, ACC; writing—review and editing, EM; visualization, ACC; supervision, EM; project administration, EM; funding acquisition, EM. Both authors have read and agreed to the published version of the manuscript.
The authors declare that they have no conflicts of interest.
This research was funded by MUR (Italian Ministry of University and Research) Project ‘Department of Excellence 2023-2027 grant number CUP J37G22000330001’ and by the project “Uninsubria Sostenibile” of University of Insubria, which have financially supported a postdoctoral scholarship.
The authors gratefully acknowledge the support of the University of Insubria Administrative and Technical Staff during data collection, in particular the property office, maintenance office, international relations office, payroll office, departmental administrative secretariats, and the phd school.
1.
2.
3.
4.
5.
6.
7.
8.
9.
10.
11.
12.
13.
14.
15.
16.
17.
18.
19.
20.
21.
22.
23.
Caspani AC, Maggi E. Quantifying CO2 Emissions from Energy Use and Mobility in a Multi-Campus University System. J Sustain Res. 2026;8(4):e260087. https://doi.org/10.20900/jsr20260087.

Copyright © Hapres Co., Ltd. Privacy Policy | Terms and Conditions


