Location: Home >> Detail
J Sustain Res. 2025;7(3):e250047. https://doi.org/10.20900/jsr20250047
 ,
Zlatina Genisheva 1,2 ,
Tiago Miranda 3 ,
Eduardo Pereira 3 ,
Cândida Vilarinho 2 ,
Joana Carvalho 1,2
,
Zlatina Genisheva 1,2 ,
Tiago Miranda 3 ,
Eduardo Pereira 3 ,
Cândida Vilarinho 2 ,
Joana Carvalho 1,2
1 CVR—Centro para a Valorização de Resíduos, University of Minho, Guimarães 4800-058, Portugal
2 MEtRICs—Mechanical Engineering and Resource Sustainability Center, Campus de Azurém, Universidade do Minho, Guimarães 4800-058, Portugal
3 Institute for Sustainability and Innovation in Structural Engineering, Department of Civil Engineering, Campus de Azurém, Universidade do Minho, Guimarães 4800-058, Portugal
* Correspondence: Margarida Soares
In today’s global landscape, a key challenge is balancing rapid population growth with sustainable agro-waste management. As demand for food and agricultural products rises, so does the volume of waste across the supply chain. It is vital to understand how demographic expansion affects waste generation, quantify this waste, and identify its geographic distribution within the European Union (EU). This study provides a statistical analysis of waste from agriculture, forestry, and fishing in the EU and assesses agricultural land use linked to crop production. By mapping this data across member states, it establishes a foundation for future research on the links between agricultural activity, land use, and waste. This will inform strategies for waste prevention, recovery, and valorization at both national and European levels. The study’s relevance lies in its ability to guide policymakers, researchers, and industry. Identifying countries with the highest waste output enables targeted interventions to foster circular economy practices, reduce environmental harm, and improve resource efficiency. These insights also support the adoption of sustainable farming technologies amid climate change and resource depletion. According to EUROSTAT, in 2020, EU agriculture, forestry, and fishing generated over 21 million tons of waste. Spain accounted for 30%, while five countries—Spain, the Netherlands, France, Sweden, and Germany—produced more than two-thirds. Similarly, two-thirds of agricultural land were in France, Spain, Germany, Poland, Romania, and Italy. This data-driven approach lays the groundwork for better agro-industrial waste management, aligning agricultural progress with sustainability and resilience, and contributing to future generations’ well-being.
In the current global panorama, we are confronted with a growing and complex challenge: the rapid expansion of the world population and the consequent pressure it exerts on natural resources and waste generation, particularly in the agricultural sector. Projections by the United Nations estimate that the global population will reach approximately 9.8 billion by 2050 and 11.2 billion by 2100. This demographic growth, coupled with longer life expectancy due to medical and technological advances, translates into an increasing demand for food, materials, and energy—all of which lead to higher levels of waste production and environmental impact [1].
Within the EU, this pressure is acutely felt. To meet the nutritional demands of a growing and aging population, global food production is expected to double by 2050 [2]. Simultaneously, EU countries must cope with the adverse effects of climate change, which threaten biodiversity, soil quality, and water availability, while remaining competitive in an increasingly globalized market [2–4].
As illustrated in Figure 1, the EU population has increased significantly in recent years.
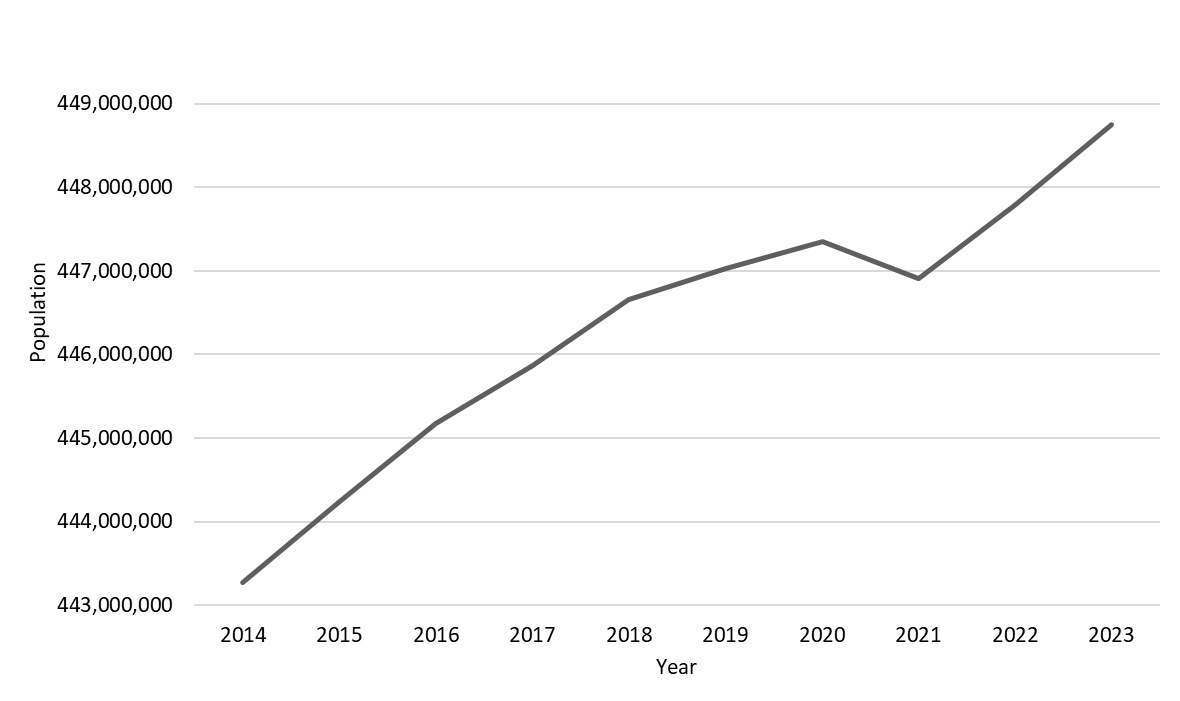 Figure 1. Population in the EU.
In 2014, there were 443,274,551 people in the EU. In a time gap of 9 years, until 2023, there was an increase of 5,479,272 people. However, there was a population decline in 2021, interrupting the growth trend observed until 2020, which is justified by Covid-19.
According to Eurostat data, population dynamics vary among Member States, demonstrated in Figure 2 [3,4].
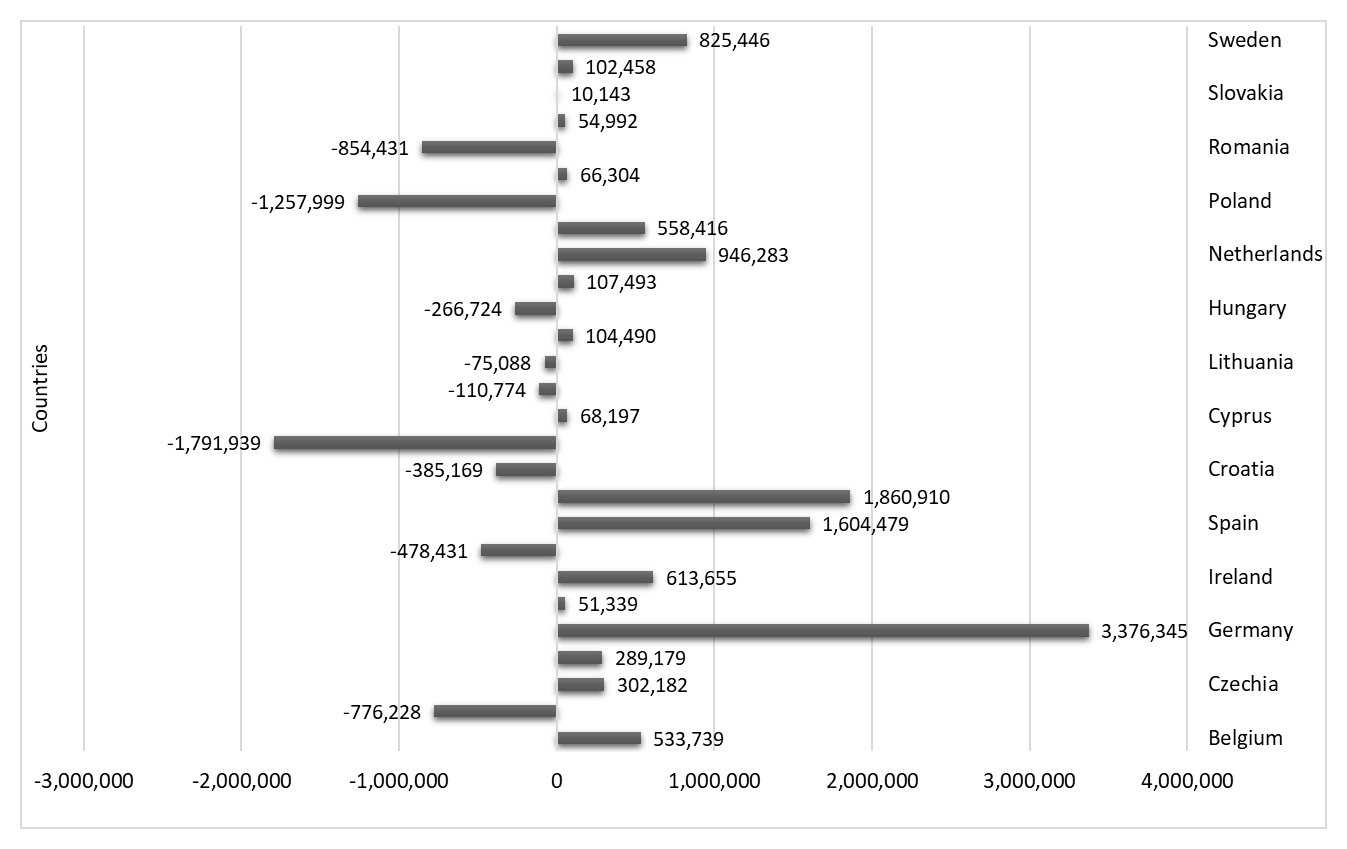 Figure 2. Difference between the population of 2014 and 2023.
It is important to highlight that Germany was the EU country with the highest population increase in the last 9 years, followed by France, Spain, Netherlands, and Sweden, respectively. On the other hand, there was a population decrease in some countries, such as Romania, Poland, Hungary, Latvia, Italy, Croatia, Greece, and Bulgaria.
There is a direct link between the most populated countries and waste production, as you will see in Section 3. Furthermore, population increase reflects the growing need for sustenance and intensifies pressure on natural resources, resulting in a corresponding increase in waste production, mainly in the agricultural sector [5].
Specifically, non-edible materials from various agricultural activities constitute agro-wastes. These encompass residues from slaughterhouses and meat processing, crop residues, leftover harvest materials, animal excrement or manure, as well as waste generated from food consumption and processing [6–8]. This heterogeneous variety of waste includes fruit peels, vegetable remains, bagasse, pomace from fruit processing, straw, husks, shells, spent grains, poultry feathers, bones, and offal, among others [9].
The prevalent approaches to managing such agricultural waste include disposal in landfills, incineration, and composting, all of which raise significant environmental apprehensions. While a significant portion of these waste materials is biodegradable, improper disposal practices can lead to a cascade of environmental issues, including contamination of soil and water sources, as well as the release of greenhouse gases into the atmosphere [10]. Furthermore, the rapidly increasing amount of waste requires the exclusion of agricultural and forestry areas from use and the installation of landfills in these areas. Its discomfort is also evident through the harmful effect on vegetation, the aesthetic and scenic values of the environment, as well as the increased risk of sanitary and epidemiological threats [5,6]. A paramount obstacle we face is devising effective strategies to handle this waste, turning it from environmental burdens into valuable assets, taking into account population growth and increased life expectancy. Encouragingly, a multitude of sustainable solutions are currently being investigated globally to address this pressing challenge.
It has become imperative to address this kind of waste not only as discarded debris but as valuable raw materials with potential economic benefits for various stakeholders, including farmers, consumers, and investors across different industries. These waste products represent a rich and versatile source of resources that can be utilized in various industrial applications, spanning from agricultural and animal production to animal and human health, and sectors such as food, beverages, nutraceuticals, pharmaceuticals, cosmetics, and materials. Recognizing and harnessing this potential promotes environmental sustainability, stimulates innovation, and creates new business opportunities throughout the agricultural and industrial value chains. A promising approach is the recovery of this waste through recycling and reuse processes, through innovative and sustainable techniques. In addition to composting, this waste has been used as a source of energy. A viable alternative is to convert biomass into useful energy, such as heat, through direct combustion or co-incineration processes, also representing a valuable raw material for the production of biogas. This biofuel is generated by the decomposition of organic matter by microorganisms under anaerobic conditions, with methane emerging as its main component [5,6,11].
It is fundamental to promote awareness and education about sustainable agricultural practices and effective waste management methods at all stages of the food production chain. This includes encouraging farmers to adopt cultivation techniques that minimize waste and maximize efficiency in the use of natural resources. Investing in research and development of innovative technologies for the recovery and use of agro-industrial waste is also essential. To attain efficient management of agro-industrial waste necessitates a concerted and cooperative endeavor among research institutions, local communities, industries, and governments. Essential elements for driving this transition toward a more circular and sustainable economy include favorable public policies, investments in research and development, financial incentives, as well as environmental education and public awareness initiatives. Therefore, facing the challenge of agro-industrial waste in the context of population growth requires a holistic and integrated approach that considers environmental issues, and social, economic, and cultural aspects. The first step in the sustainable practices of waste management is a comprehensive understanding of the current situation. In this context, the present article aims to gather data and represent an overview of production quantities of agro-industrial wastes within the EU [12].
Purpose and Research QuestionsThe purpose of this study is to provide a detailed overview of the current state of agricultural waste production across the EU, by compiling and analyzing the most recent data available. Specifically, it aims to:
●
●
●
In doing so, the study addresses the following research questions:
1.
2.
3.
Although the existing literature offers valuable insights into specific agro-waste streams, such as crop residues or manure, and various waste valorization techniques including composting, anaerobic digestion, and bioenergy production, most studies are limited in geographic or thematic scope. Many focus on isolated case studies, single countries, or particular types of waste, without capturing the broader, systemic picture needed to support EU-wide strategies.
There is currently a notable lack of harmonized and integrated data at the EU level that links demographic trends, particularly population growth and distribution, with the generation of agro-waste. This gap impedes the ability of researchers, policymakers, and stakeholders to fully understand how societal dynamics influence waste production patterns across member states. Without this insight, it becomes difficult to develop coherent policies or invest in regionally appropriate waste management infrastructures and valorization technologies.
Furthermore, while Eurostat and other databases provide partial information on agricultural production and waste volumes, these are often presented in fragmented or inconsistent formats, making comparative analysis across countries both complex and unreliable. There is also limited investigation into the correlations between agricultural land use, demographic evolution, and waste production—key parameters in understanding sustainability challenges and opportunities in the agro-industrial sector.
This study aims to address this research gap by compiling and analyzing comparable, statistically grounded data on agro-industrial waste production and population dynamics across the EU. By offering a comprehensive overview that links these variables, the work provides a much-needed foundation for future interdisciplinary studies, strategic planning, and evidence-based policymaking. In doing so, it contributes to the transition toward a more data-informed, circular, and sustainable agro-industrial economy.
To contextualize the empirical findings within a sustainability-oriented approach, Figure 3 presents a conceptual framework illustrating the circular bioeconomy system in which agricultural waste flows. This graphical representation integrates key components (agricultural land, crop production, agro-waste, and its transformation into value-added outputs such as sustainable construction materials). The framework underscores the potential of circular practices to reduce environmental impacts and promote resource efficiency across the EU.
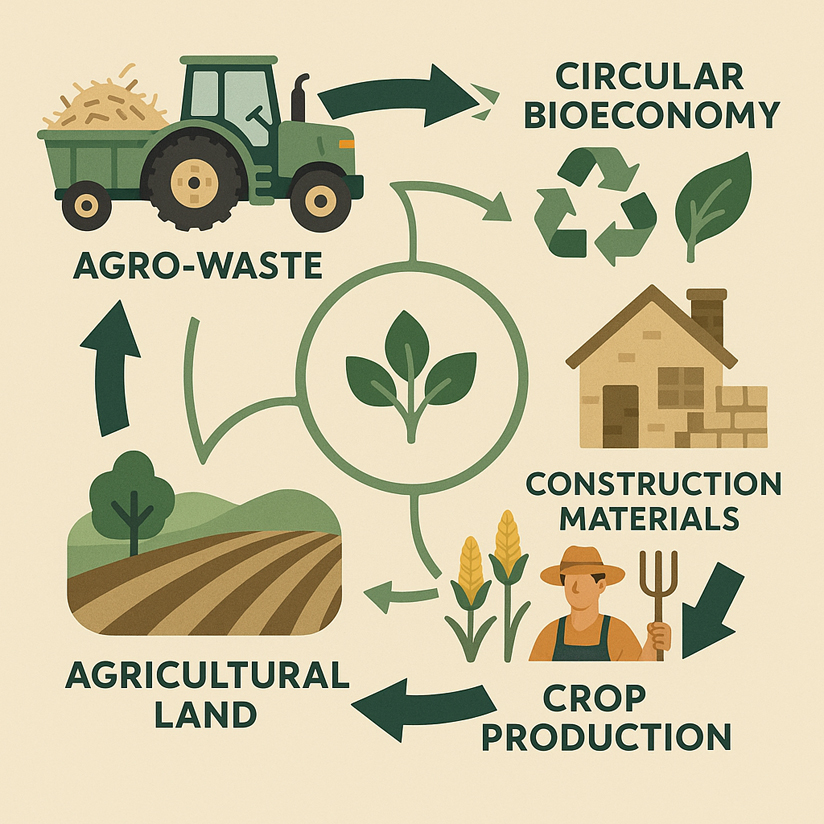 Figure 3. Agricultural waste in a circular bioeconomy.
This visualization highlights the interconnectionbetween food production, land use, and waste management, while reinforcing the role of agricultural residues as inputs for bio-based industries. It also serves as a policy-relevant tool, showcasing pathways toward sustainable development through waste valorization.
This study employed a quantitative, descriptive approach to analyze agricultural waste production within the EU (EU27), focusing on its generation, distribution, and correlation with agricultural land use and farm typologies. The methodology was grounded in the statistical evaluation of official datasets sourced from Eurostat, with reference to the most recent and comprehensive data available for the year 2020.
While this approach provides a valuable comparative view and a broad geographical coverage, it is subject to certain limitations that may affect the robustness and comparability of the results.
One key limitation lies in the differences in national reporting standards and methods of waste classification. Although Eurostat aims to harmonize data collection across the EU, variation in definitions, categorizations, and measurement criteria can result in inconsistencies between countries. Furthermore, some member states report missing or zero values which may reflect gaps in data collection, different agricultural practices, or administrative choices in waste recording.
By acknowledging these constraints and making them explicit, we aim to provide greater transparency and context for the interpretation of our results, while offering a basis for future research to further improve the comparability and completeness of agricultural waste data across the EU.
Data SourcesThe primary data used in this study were extracted from Eurostat databases, official publications, and country reports from the European Commission. The dataset included information on:
●
●
●
●
Additionally, statistical tables and visualizations were developed to facilitate comparative analysis between countries and farm types. These were constructed using normalized and absolute values to assess both total and per capita waste production as well as the typological distribution of agricultural land.
Waste Quantification and MappingA key element of the methodology was the mapping and quantification of organic agro-waste. This process involved:
1.
2.
3.
4.
This comprehensive mapping aimed to assess the magnitude of waste produced and to uncover regional patterns and typologies of waste generation, particularly in countries with large agricultural sectors (e.g., Spain, France, Germany, and the Netherlands). In countries like Finland, the absence of reported agricultural waste highlighted best practices in waste valorization, such as its conversion to bioenergy, and was considered a model for circular economy integration.
Typological Classification of FarmsIn order to understand the type of waste being generated, a classification of agricultural holdings was performed. Farms were grouped into four primary categories:
1.
2.
3.
4.
These were further subdivided into specific typologies (e.g., dairying, poultry, cereals, olives, horticulture), as defined by Eurostat. Farm specialization was linked with the type and expected quantity of waste generated. For instance, livestock farms tend to generate more organic and slurry-based waste, while crop farms produce large volumes of plant residues.
Analysis StrategyData were analyzed through descriptive statistics and visual representations to:
●
●
●
●
Through this methodology, the study establishes a solid foundation for understanding agricultural waste flows within the EU and sets the groundwork for future research into waste reuse technologies, bioresource recovery, and inter-industrial synergies aimed at sustainable development.
Agricultural industries play a vital role in the sustainability of society, but they face the challenge of dealing with large volumes of organic waste at all stages of production. From transportation to storage and processing, a variety of by-products are generated, including crop residues, animal manure, animal by-products, and waste, as well as forest residue biomass. However, it is essential to see this waste not as a burden to be discarded, but rather as a valuable opportunity to use resources intelligently and sustainably.
The essential starting point is to carry out detailed mapping and thoroughly quantify this waste. By understanding the origin and magnitude of these organic materials, it is possible to begin exploring their valorization. Valorization involves discovering alternative uses for waste and studying and developing technologies and processes that transform them into usable resources. Furthermore, by investing in the recovery of this waste, industries can enjoy a series of benefits, contributing to waste reduction and environmental preservation and discovering opportunities to generate additional revenue and create products with greater added value.
Thus, mapping and quantifying agro-waste establishes a robust basis for enabling the recovery of these materials, making it an accessible and beneficial practice for industries. This approach improves the efficiency of agricultural systems and drives the transition to a more circular and sustainable economy, fostering potential synergies and inter-industrial collaboration [12].
In 2020, 2,153,950,000 t of waste was produced in the EU, of which 21,350,000 t correspond to waste from the agricultural sector, more specifically around 1% of total waste [13,14]. According to Eurostat data, Table 1 was created showing the generation of total and sector waste in the EU.
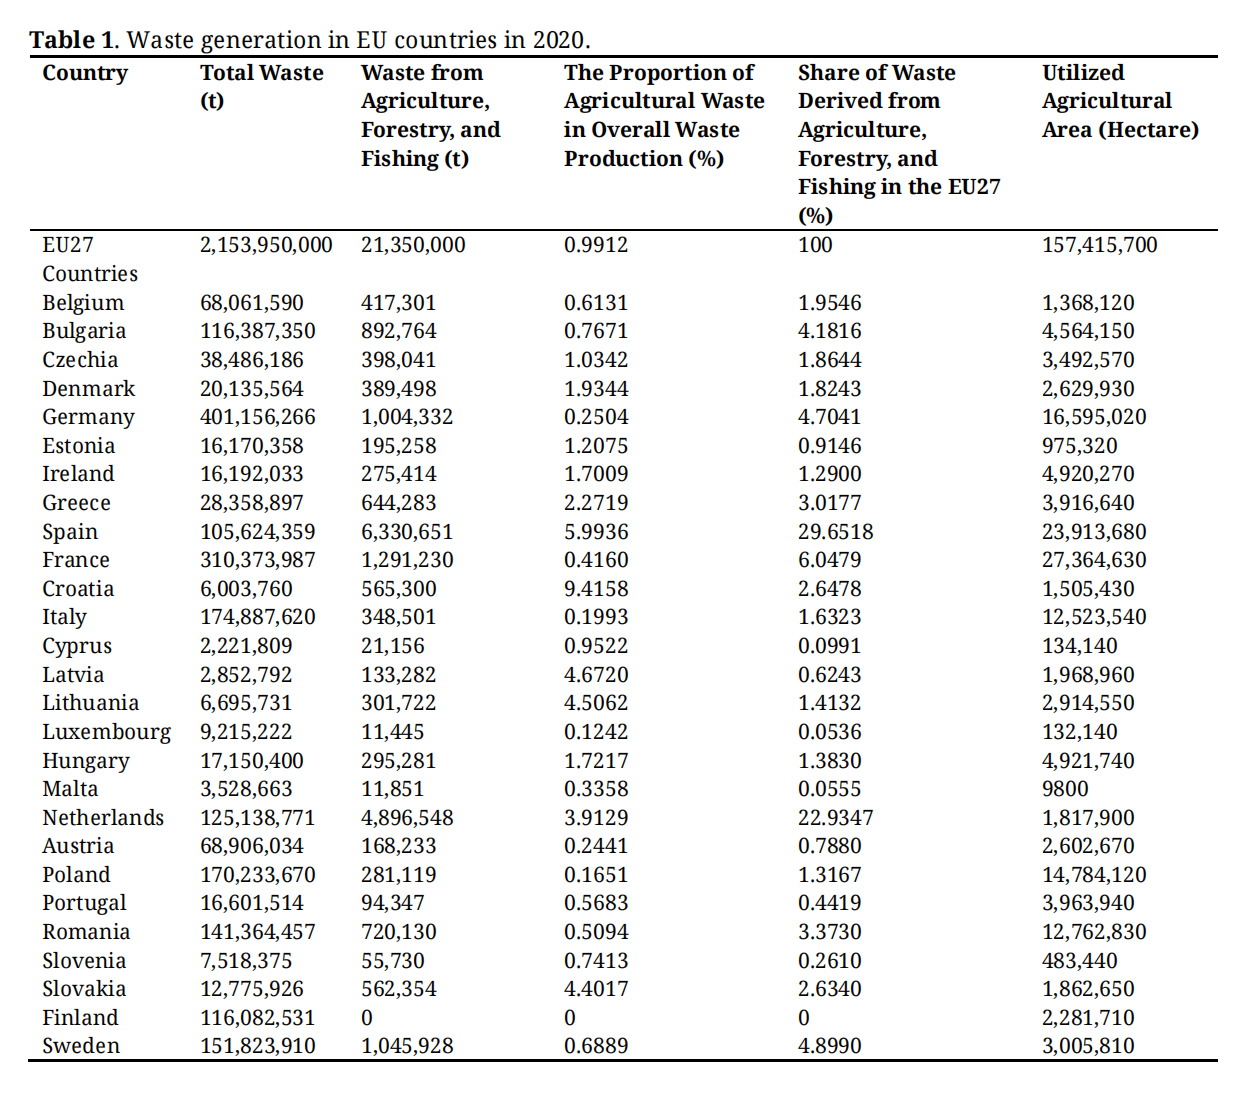 Table 1. Waste generation in EU countries in 2020.
As indicated in Table 1, in 2020, Germany was the country with the highest total waste production, possibly explained by the fact that it is the most populated country in the EU. However, regarding waste from the agricultural, forestry, and fishing sector, Spain led with a production of 6,330,651 t.
It is important to highlight that, as is visible in the table, Finland has zero waste production associated with this sector. According to the European Commission's 2023 country report, Finland has made considerable progress in recent years when it comes to reducing the rate of landfill waste by increasing the country's incineration capacity. Furthermore, bioenergy production has played a fundamental role in the production of renewable energy, being linked to the forestry sector and forestry industries, particularly wood fuels. This energy source represents around 30% of the country's total energy consumption, being the most used energy source. Bioenergy is generated from by-products of the forestry industry, logging residues, low-value biomasses from harvesting operations, biodegradable waste, and secondary streams from agricultural and industrial production [15].
In Figure 4, which shows the share of waste derived from agriculture, forestry, and fishing in the EU27 in 2020, it is possible to see that Spain holds almost 30% of the sector's waste production in the EU. It is important to highlight that Spain is the second EU country with the largest agricultural area used in the EU as can be seen in Figure 5 [16].
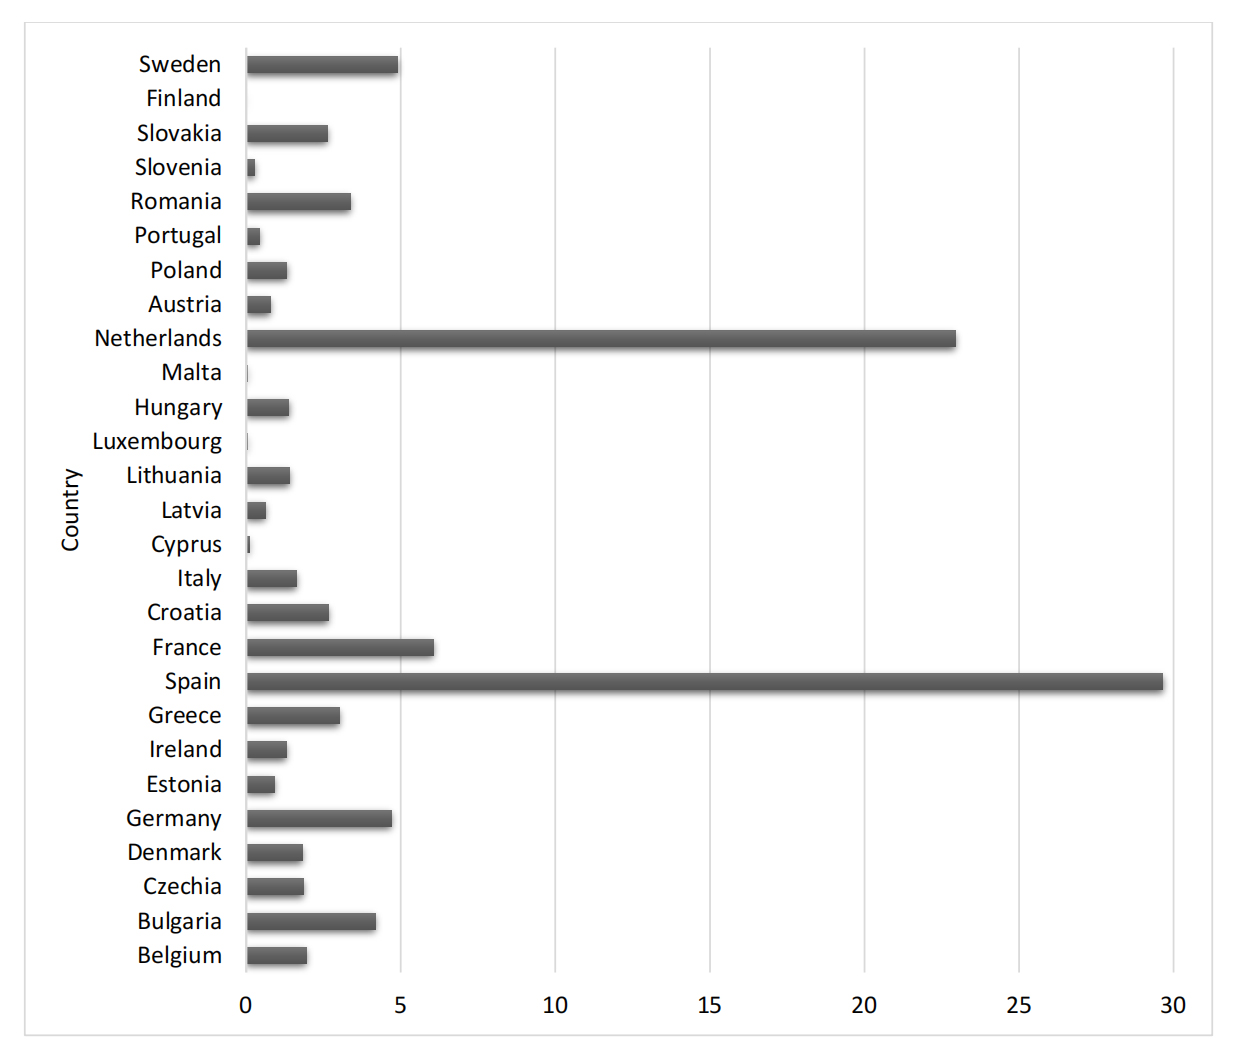 Figure 4. Share of waste derived from agriculture, forestry, and fishing in the EU27 in 2020.
The Netherlands is the second country with the highest percentage of sector waste in total waste, with approximately 23%. Spain and Netherlands account for more than half of the production of waste from agriculture, forestry, and fishing, with almost 53% of production, being the countries that stand out most in this field. Furthermore, these two countries, together with France, Sweden, and Germany, traditionally agricultural-producing countries, generate more than two-thirds of the sector's waste in the EU, demonstrating an unequivocal centralization of their production. An important fact is that these five countries comprise half of the total population of the EU, specifically 225,982,575 people.
Regarding the use of agricultural areas in the EU, it is important to note that agricultural holdings used more than 157 million hectares of land in 2020. This value corresponds to around 38% of the total area of the EU [16,17]. For better visualization of the percentage of the agricultural areas utilized in each country (EU27) Figure 5 was constructed.
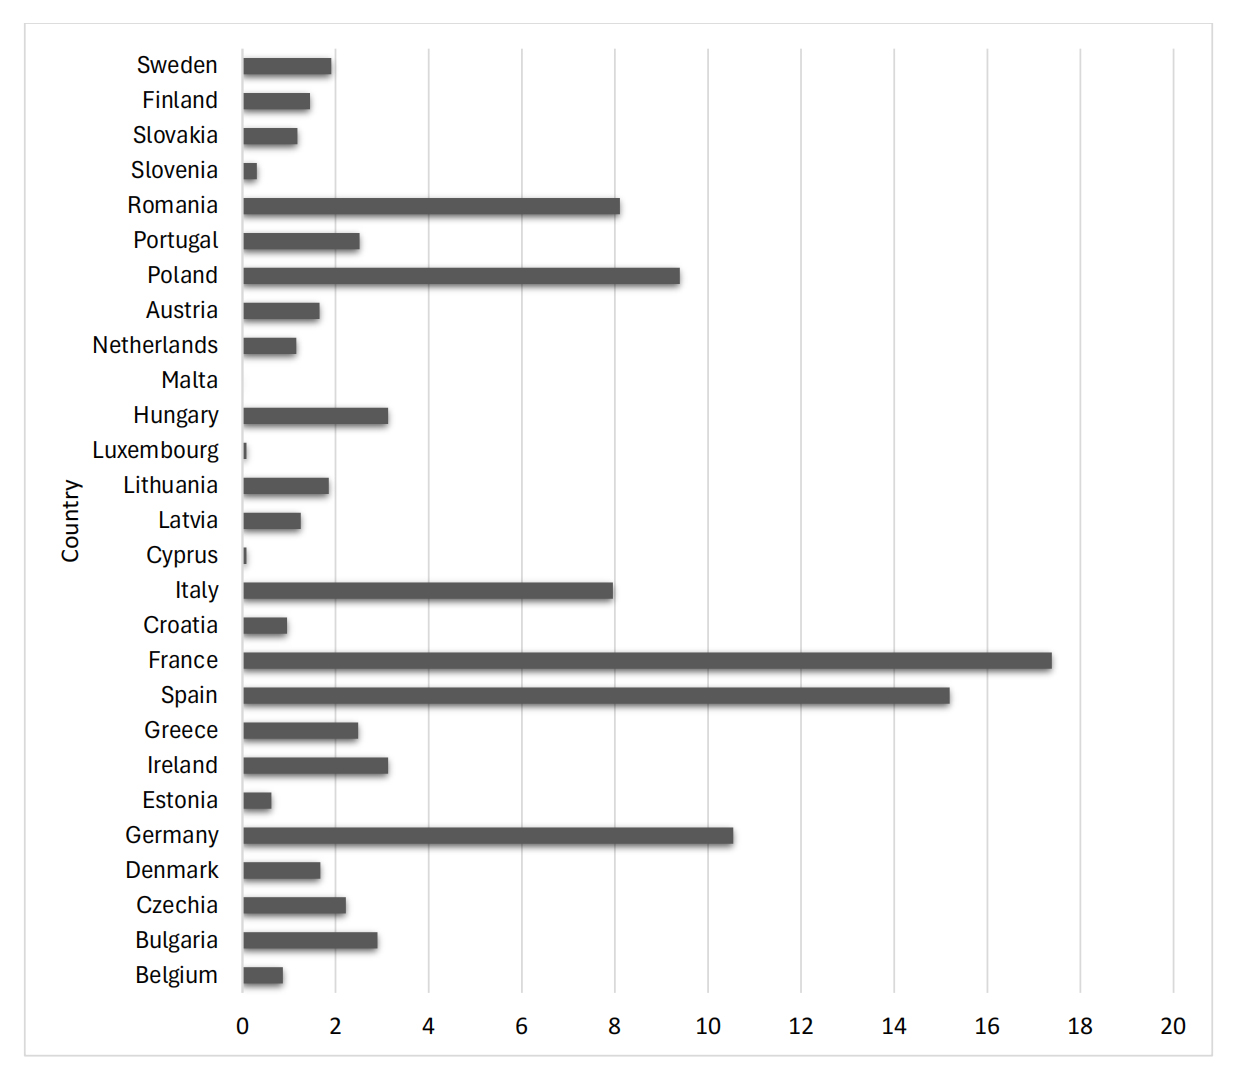 Figure 5. Share of utilized agricultural area in EU27, in 2020.
Analyzing Figure 5, it is possible to verify that around two-thirds (68.6%) of the EU's Utilized Agricultural Area in 2020 was cultivated in six main countries, namely in France (17.4%), in Spain (15.2%), in Germany (10.5%), in Poland (9.4%), in Romania (8.1%) and in Italy (8.0%). All other EU countries have a utilized agricultural area of less than 5 million hectares [16,17].
Furthermore, agricultural landscapes were predominant in several EU countries, with more than half of their area devoted to agriculture. This is the case for Ireland, Denmark, Romania, Hungary, the Netherlands, and Luxembourg [16]. Although the number of farms in the EU has decreased over the years, the amount of agricultural land used has remained stable. Most of the farms that disappeared were small farms, measuring less than 5 hectares, with an increase in large farms, larger than 100 hectares [16].
Checking Figure 6, it can be seen that not all countries with the largest agricultural area used are the countries that produce the most waste from the sector, such as Romania, Poland, and Italy. This fact may be due to the already use of these wastes as by-products, as was verified for Finland.
The sector's waste production per capita was also analyzed, to understand the differences between EU countries. In Figure 6 it is possible to verify these differences, showing the waste generated by this sector, in kg per capita, in 2020.
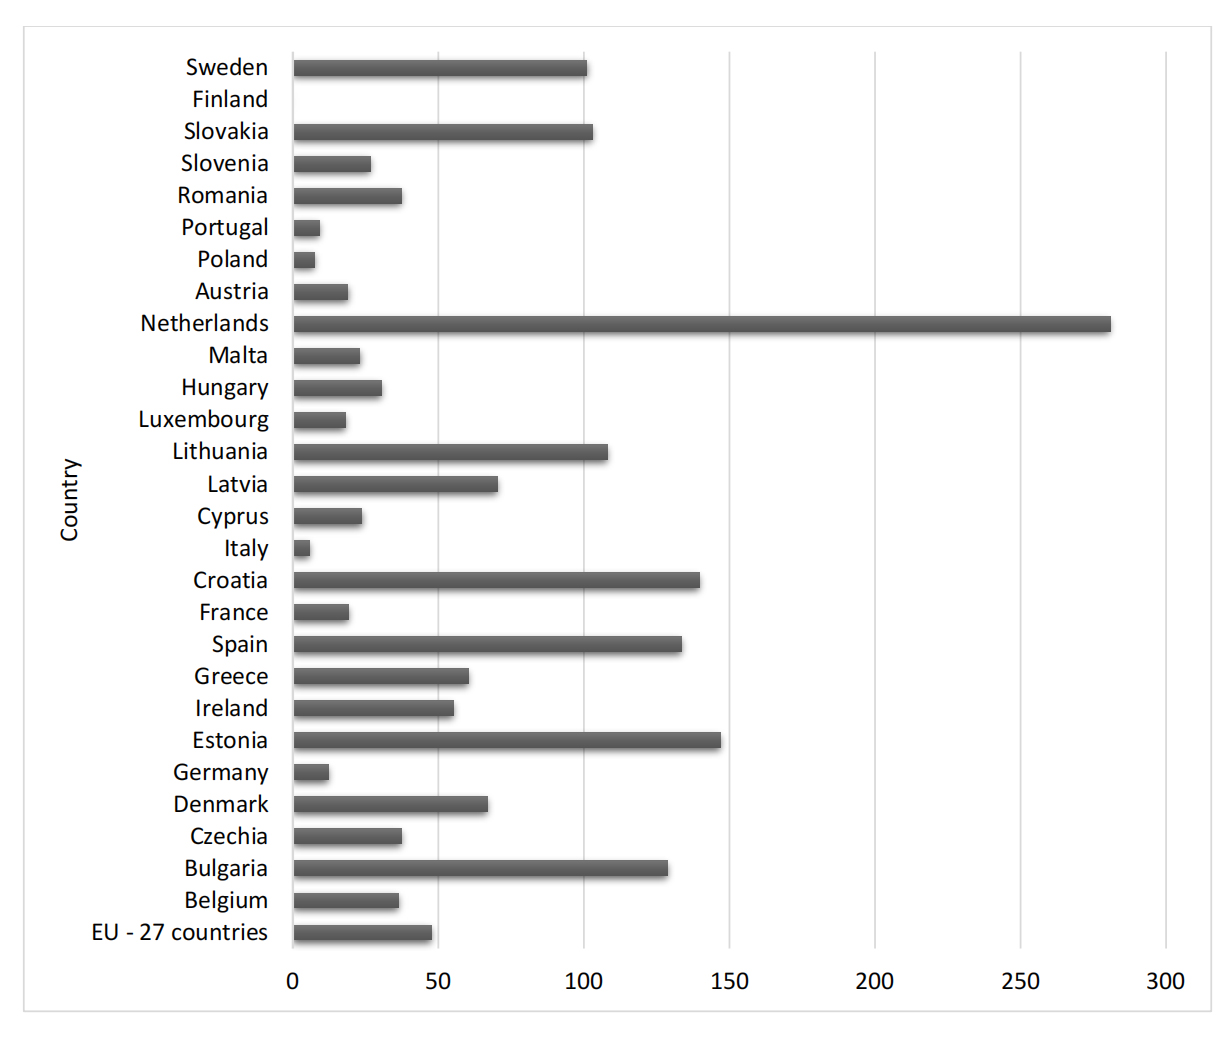 Figure 6. Kg of waste generated from the sector per capita, in 2020.
Figure 6 shows that the Netherlands has the highest value of waste production from agriculture, forestry and fishing, with 280.74 kg per capita, followed by Estonia (146.86 kg), Croatia (139.67 kg), Spain (133.65 kg), Bulgaria (128.75 kg), Lithuania (107.96 kg), Slovakia (103.02 kg), Sweden (101.02 kg), Latvia (70.13 kg), Denmark (66.79 kg), Greece (60.22 kg) and Ireland (55.24 kg). It is important to highlight that in all these countries, waste production from this sector was higher than the EU average of 47.73 kg. All the others have a per capita waste generation lower than the EU average in 2020.
Among the different types of agricultural holdings, it is crucial to identify those that predominate in the EU. Although these data do not provide precise information on the amount of waste produced, as this depends on the size of each farm, knowing the type (agricultural, horticultural, or animal production) of the farms is very useful. There are various types of farms, some of which combine different agricultural activities. However, when an activity is predominant (representing at least two-thirds of production), exploration is considered specialized in that activity. To understand which activities are predominant in different types of agricultural holdings, Table 2 was created, based on the report prepared by Eurostat [16].
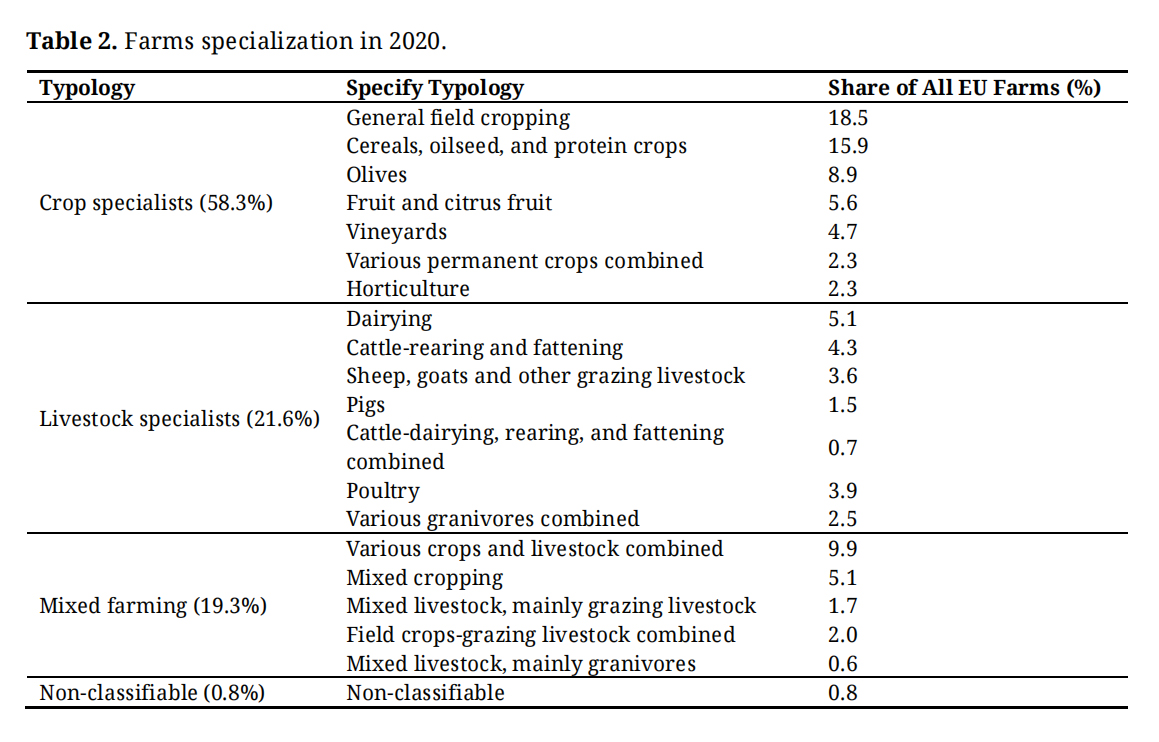 Table 2. Farms specialization in 2020.
Examining the data in Table 2, we can see that approximately 60% of EU agricultural holdings specialize in cultivation. In the second place, with 21.6%, are farms dedicated to livestock farming. Finally, mixed farms represent 19.3% of the total in the EU [18].
It is extremely important to understand in depth the largest agricultural activities in EU countries. With this purpose in mind, Figures 7 and 8 show the production and land use patterns in each nation, according to Eurostat data [17]. Such information is essential to anticipate the type and quantity of waste generated by the agricultural sector in each country. This in-depth understanding is essential for guiding agricultural waste management policies and practices to promote environmental sustainability and develop effective strategies to mitigate adverse environmental impacts.
To facilitate the analysis, the values of the agricultural area used were divided into specific types and typologies, as follows:
● Crop specialist farms:
o
o
o
o
o
o
o
o
o
● Livestock specialist farms:
o
o
o
o
o
o
o
● Mixed farms
o
o
o
o
o
● Non-classified farms
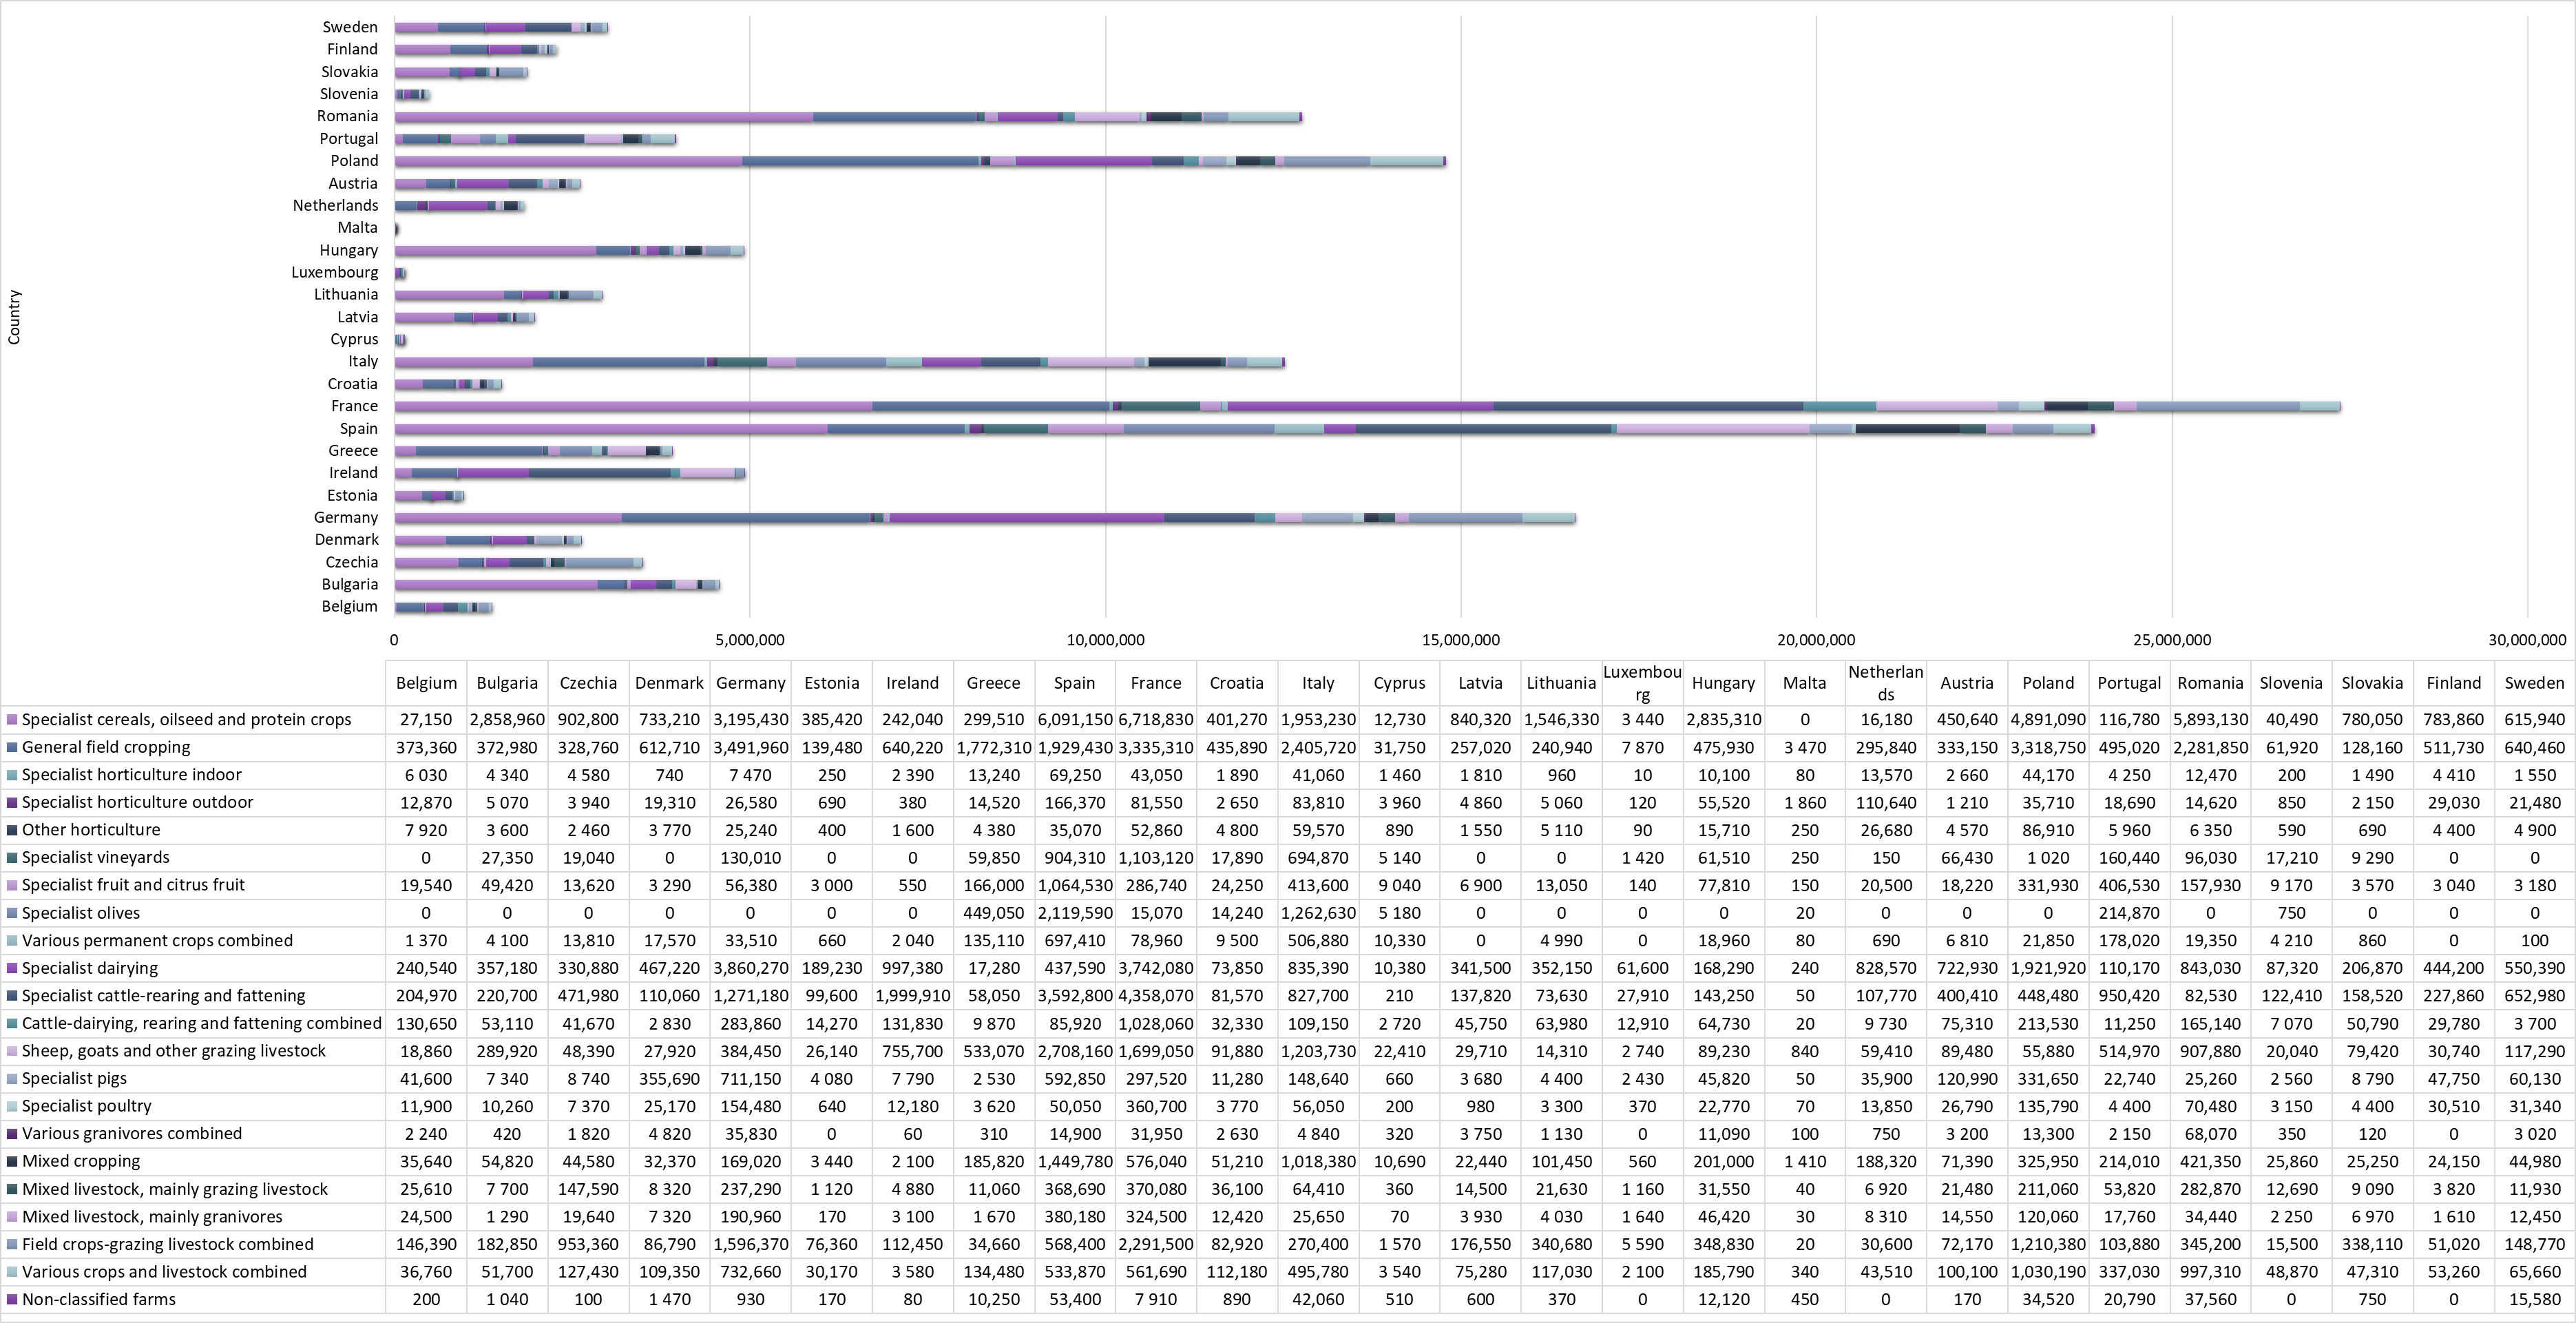 Figure 7. Utilized agricultural area, by farming type, in 2020.
To simplify the analysis of this topic, Figure 8 was developed. It depicts the normalized values associated with the previous Figure 7, i.e., utilized agricultural area is divided into four general typologies, namely crop specialist farms, livestock specialist farms, mixed farms, and non-classifiable farms. So, Figure 8 shows which type of agricultural holding is most used in each EU country.
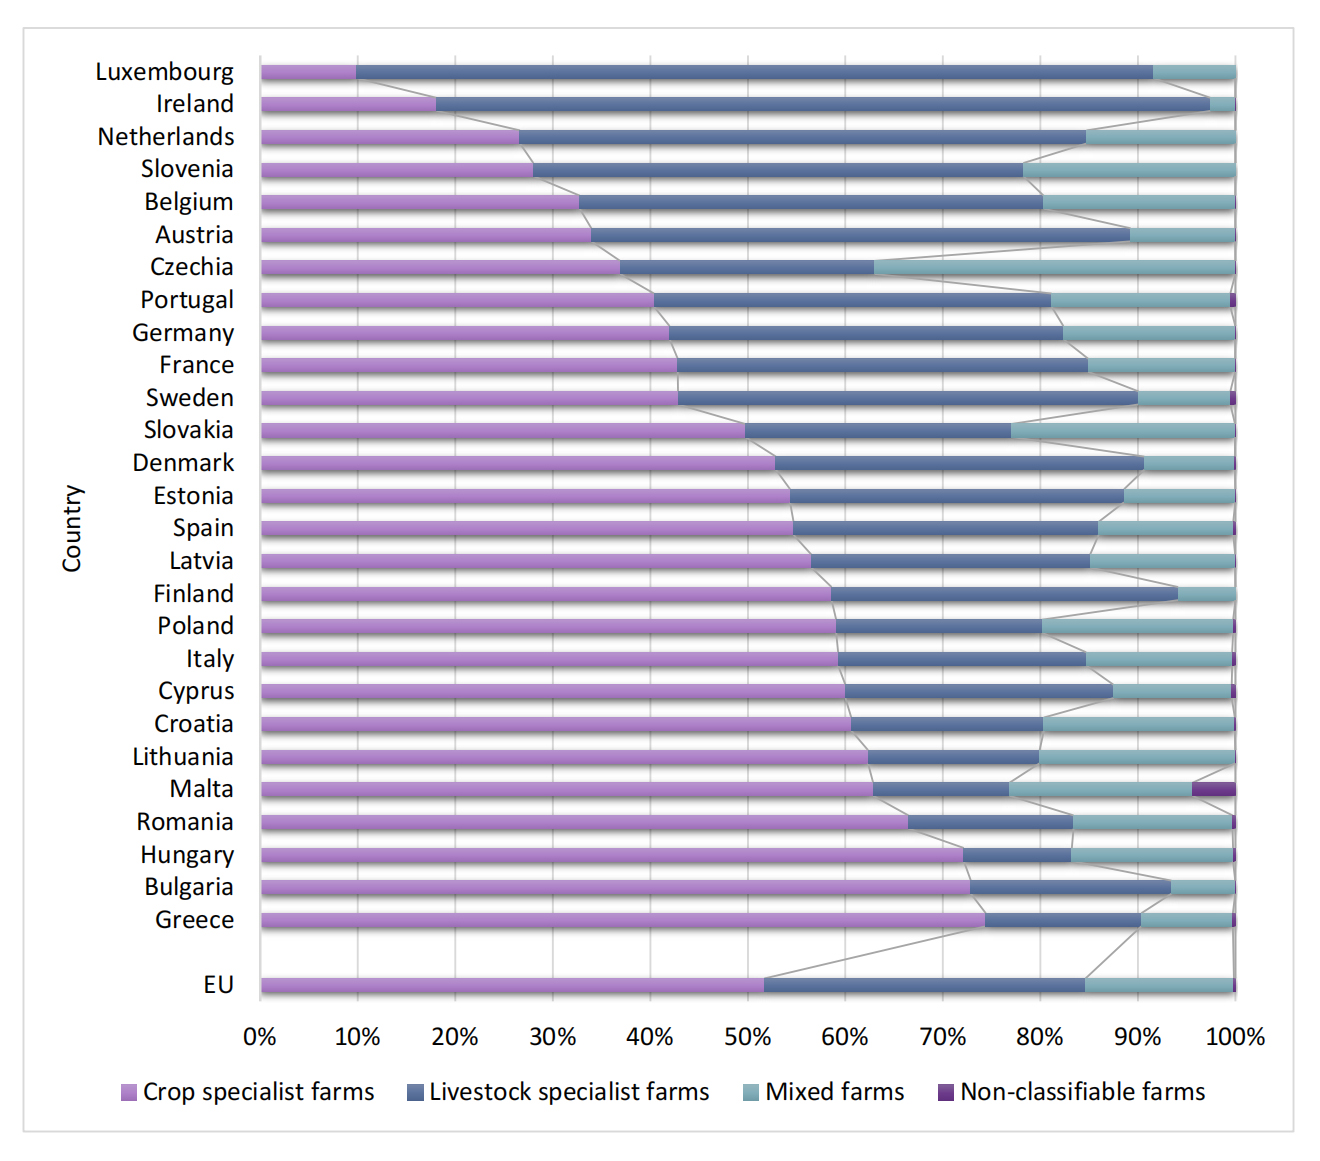 Figure 8. Utilized agricultural area, by farming type, in 2020.
As already seen in Figure 5, the country with the largest agricultural area used in the EU was France (27.4 million ha). Analyzing Figure 8, it can be seen that the percentages of the specific typologies crop specialist and livestock specialist are very similar, approximately 42%. The most representative specific typologies in this country, as can be seen in Figure 7, are specialist cereals, oilseed, and protein crops (included in crop specialist), with an agricultural area of more than 6.7 million hectares and, soon after, the specialist cattle-rearing and fattening (included in the livestock specialist), with an agricultural area used over 4.3 million hectares. It is worth highlighting the fact that France is the EU country with the largest agricultural use for these two specific typologies. Additionally, it is the country with the largest agricultural area used in 5 other specific typologies, namely, and decreasingly, in field crops-grazing livestock combined (2,291,500 ha), in specialist vineyards (1,103,120 ha), specialist cattle-daiyring, rearing and fattening combined (1,028,060 ha), mixed livestock, mainly grazing livestock (370,080 ha) and specialist poultry (360,700 ha).
In turn, Spain was the second EU country with the highest use of agricultural area in 2020 (around 24 million ha). Looking at Figure 8, it can be seen that the majority of Spain’s agricultural area is used for crop specialist, specifically 13,077,110 ha, which corresponds to more than 50% of Spain's agricultural area. On the other hand, the livestock specialist typology holds around 31% of the agricultural area used in Spain. Furthermore, Spain is the EU country that dominates the most specific typologies, with regard to the agricultural area used, namely specialist indoor and outdoor horticulture, specialist fruit and citrus fruit, specialist olives and various permanent crop combinations. Concerning livestock specialist, Spain has the largest agricultural area used in the sheep, goats, and other grazing livestock typology. Furthermore, it is the country with the largest agricultural area used in mixed cropping, mixed livestock, and unclassified farms. Additionally, it is important to note that, within the country, the largest fraction of agricultural area used is in specialist cereals, oilseed, and protein crops, with approximately 25% of Spain's total.
Germany was the third EU country with the largest agricultural area used in 2020, as can be seen in Figure 5. Most of this area is occupied by crop specialist farms, specifically a percentage of 42% of the total area used by this country, mostly by the specific typology General field cropping (3,491,960 ha). It is important to note that Germany is the EU country with the highest use of agricultural land in this specific typology, corresponding to around 13.91% of the total in the EU. In turn, within the country itself, the most representative specific typology is included in the livestock specialist farms typology, namely specialist dairying. Germany is the EU country with the largest area used in this specific typology, occupying approximately 23.3% of the entire area used by the country. In addition to this typology and general field crops, Germany is the EU country with the largest agricultural area used in the specific specialist pigs typology, with 711,150 ha.
In turn, in fourth place and with 9.4% of the agricultural area used in the EU in 2020 is Poland, specifically with 14,784,120 ha. Within the country, and as can be seen in Figure 8, almost 60% (8,731,430 ha) is in the crop specialist typology. The livestock specialist type holds 21.1%. The specific type with the greatest representation is specialist cereals, oilseed, and protein crops, with around 33% of the agricultural area used in the country. Furthermore, it is the EU country with the greatest representation in two specific typologies, namely in various crops and livestock combined, with 1,030,190 ha, and in other horticulture, with 86,910 ha.
Romania was the fifth EU country with the largest agricultural area used in 2020, around 12,762,830 ha. The agricultural area is mainly distributed by the crop specialist farms typology, corresponding to 66.5%. In turn, the livestock specialist typology holds 16.9%. Concerning the crop specialist typology, the specific typology with the greatest representation is the specialist cereals, oilseed, and protein crops, with 5,893,130 ha. Furthermore, it is the specific typology that holds the highest percentage of agricultural area within the country, with a percentage of 46%, ranking third in the EU. It should also be noted that it is the EU country with the largest agricultural area available for the specific typology various granivores combines, with 68,070 ha.
Italy was the sixth country with the largest agricultural area used in 2020, with 12,523,540 ha. Most of its agricultural area is used in the crop specialist typology, with 59.3%, more specifically in the specific general field cropping typology, with 2,405,720 ha.
It is important to note that in 2020, all other EU countries had a utilized agricultural area of less than 5,000,000 ha. Malta was the EU country with the smallest agricultural area used in 2020, justified by the fact that it is the smallest country in the EU.
As mentioned previously, the countries with the highest production of waste from agriculture, forestry and fishing are, in descending order are Spain (6,330,651 t), the Netherlands (4,896,548 t), and France (1,291,230 t). These three countries account for almost 59% of waste production from this sector in the EU. Spain and France are the countries with the largest agricultural area used, being the countries with the largest waste production. However, in 2020, France had a used agricultural area greater than Spain by 3,450,950 ha, contrary to the production of waste from agriculture, forestry and fishing, which was greater in Spain. It is important to note that the area used in each typology differs. France has 10% more area usage in Livestock specialist than Spain.
In turn, the Netherlands, although with a significantly smaller agricultural area used than Spain and France (1,817,900 ha), was the second EU country with the highest production of waste from this sector in 2020. Furthermore, it was the country of EU with a higher generation of this type of waste per capita. It should be noted that in the Netherlands most of the agricultural area used is in the Livestock specialist typology (around 58%), with the largest percentage associated with the specific specialist dairying typology, with 828,570 ha. The Netherlands has about half of its area used as agricultural land.
In general, the dominant type of agricultural holding in Mediterranean countries is the crop specialist. On the other hand, in northwest European countries, such as the Netherlands, livestock farming is the predominant activity.
In turn, in the EU, most of the agricultural land used is in the crop specialist farm type, with 51.7%, followed by livestock specialist farms with 32.9%.
As a final remark: it is observed that there is a mismatch between the used agricultural area and the amount of waste produced. For example, France has the largest used agricultural area, surpassing Spain by 3.45 million ha, yet it generates significantly less waste. The Netherlands, with a much smaller used agricultural area than either Spain or France, still ranks second in waste production. This challenges any simple correlation between land area and waste output, suggesting other factors are more influential. Waste generation is also dependent on the agricultural typologies: France and Spain differ in how their land is used. France has 10% more land in livestock specialization, which may affect waste outputs. The Netherlands is heavily specialized in livestock (58%), especially dairying, which is typically resource-intensive and waste-generating. Thus, intensity of use, especially in animal agriculture, appears to be a stronger determinant of waste production than total land area. The Netherlands is also noted as the highest per capita producer of waste in this sector. This highlights the environmental burden per individual, suggesting issues of efficiency, sustainability, and possibly over-industrialization in agriculture.
Land area and typology of wastes are not the only drivers of wastes, it should be considered other variables like: technology used in waste processing or reporting; policy differences in how waste is measured; export/import dynamics and intensity of input use such as fertilizers, water, and feed, which can dramatically alter waste profiles.
This study underscores the potential of agricultural waste as a valuable secondary resource and laid the groundwork for developing a sophisticated digital matchmaking platform designed to connect agricultural producers directly with the construction industry. By identifying which countries generate the highest volumes of agricultural waste, which types of crops predominantly contribute to these streams, and where this waste is most geographically concentrated, the research provides a rich, granular data foundation for the platform's functionality. Drawing on these insights, the platform will be able to map available by-products in real time, match agricultural producers who have surplus residues with nearby manufacturers looking to incorporate organic materials into their production process, and foster synergistic partnerships across sectors. Furthermore, by pinpointing which crop residues are most abundant and accessible in a given region, the platform can help stakeholders prioritize the highest-potential waste streams for valorization, strengthening local supply chains, reducing waste disposal, and adding value to agricultural by-products, all while contributing to a more circular and sustainable materials ecosystem. Importantly, the extensive data and knowledge generated by this study will be fundamental to developing and optimizing the platform, making it a profoundly useful and important tool for transforming agricultural waste into a key resource for sustainable production in the future.
Through the research carried out, it was concluded that population growth significantly intensifies the pressure on natural resources and leads to a proportional increase in the generation of waste, particularly agro-waste. This trend is especially concerning in the context of environmental sustainability, as the growing demand for food driven by population increases requires more intensive agricultural practices, which, in turn, generate greater volumes of waste.
In 2020 alone, more than 21 million tons of waste were produced by the agriculture, forestry, and fishing sectors within the EU. Spain stood out as the leading producer, accounting for nearly 30% of the total sectoral waste in the EU. Furthermore, over two-thirds of this waste originated from just five countries: Spain, the Netherlands, France, Sweden, and Germany. This geographical concentration of waste production reveals a strong correlation between population size, the scale of agricultural activity, and the volume of waste generated. It highlights the pressing need for tailored and efficient waste management strategies in countries with higher agricultural output and population densities.
Regarding the use of agricultural land, data from 2020 show that nearly two-thirds of the total utilized agricultural area in the EU was concentrated in six countries: France, Spain, Germany, Poland, Romania, and Italy. These nations play a pivotal role in European food production and, by extension, bear significant responsibility for implementing sustainable waste management practices that reflect the scale of their agricultural sectors.
A particularly noteworthy finding was that, in terms of agricultural waste generation per capita, the Netherlands recorded the highest value among EU countries in 2020. This per capita metric underscores the importance of evaluating not only total waste volumes but also the efficiency of agricultural systems relative to population size. It offers insight into the environmental impact of national agricultural models and highlights areas where improvements in sustainability may be most needed.
To obtain a more detailed understanding of agricultural waste origins, this study also analyzed the most commonly produced crops in each EU country. This approach provides a crucial foundation for future research that can link waste production to specific crop types and regional characteristics. Such insights will be instrumental in developing targeted strategies for waste management and recovery, tailored to the biological and economic traits of each agricultural system.
Crucially, this study also laid the groundwork for the development of a digital matchmaking platform aimed at connecting the agricultural sector with the construction industry. By identifying which countries produce the most agricultural waste, which types of crops are most prevalent, and where waste is most concentrated, this research provided key data inputs for the design of the platform. The platform will be able to use this information to map available by-products and connect agricultural producers with construction material manufacturers interested in incorporating organic residues into sustainable building materials. For example, by knowing which crop residues are most abundant in a given region, the platform can help prioritize high-potential waste streams for valorization.
In this way, the study in addition to contributing to a broader understanding of agricultural waste dynamics across the EU, also offers actionable insights that directly support the creation of a circular economy bridge between agriculture and construction. The digital platform will serve as a tool to facilitate resource efficiency, reduce waste, and promote innovation in green construction materials, turning an environmental challenge into an economic opportunity.
In conclusion, the findings of this study reinforce the urgent need for the agricultural sector to align with scientific and technological advancements in order to address the challenges posed by climate change. Embracing innovation is essential not only for protecting the environment but also for ensuring food security and public health. The sector's long-term sustainability will increasingly depend on its ability to adopt circular economy practices and implement efficient waste recovery systems that reduce environmental impact while maximizing resource use.
Conceptualization MRS, ZG, JC; writing—original draft preparation, MRS, ZG; writing—review and editing, MRS, JC, ZG, TM and EP; project administration, JC, CV; funding acquisition, MRS, JC, CV, TM and EP All authors have read and agreed to the published version of the manuscript.
The authors declare no conflicts of interest.
This work was supported by FCT—Fundação para a Ciência e Tecnologia, I.P. by Grant 2023.00533.BDANA and https://doi.org/10.54499/2023.00533.BDANA, and project projeto nº 17789, Wastesinmotion.
1.
2.
3.
4.
5.
6.
7.
8.
9.
10.
11.
12.
13.
14.
15.
16.
17.
18.
Soares M, Genisheva Z, Miranda T, Pereira E, Vilarinho C, Carvalho J, et al. Agricultural waste: The picture of European Union countries. J Sustain Res. 2025;7(3):e250047. https://doi.org/10.20900/jsr20250047.

Copyright © Hapres Co., Ltd. Privacy Policy | Terms and Conditions


