Location: Home >> Detail
J Sustain Res. 2026;8(1):e260007. https://doi.org/10.20900/jsr20260007
 ,
Suan Phaik Khoo 2,* ,
Shahanapriyatinii M. Ganesan 3 ,
Pui Ee Seow 3 ,
Ke Shuen Yeo 3 ,
Kerthana Devi Premanenth 3 ,
Sarvesen Chithiramanaalan 3 ,
Muhammed Ellhaam bin Juahir 3
,
Suan Phaik Khoo 2,* ,
Shahanapriyatinii M. Ganesan 3 ,
Pui Ee Seow 3 ,
Ke Shuen Yeo 3 ,
Kerthana Devi Premanenth 3 ,
Sarvesen Chithiramanaalan 3 ,
Muhammed Ellhaam bin Juahir 3
1 IMU University Centre for Education, IMU University, Kuala Lumpur 57000, Malaysia
2 Community Engagement, IMU University, Kuala Lumpur 57000, Malaysia
3 School of Medicine, IMU University, Kuala Lumpur 57000, Malaysia
* Correspondence: Pathiyil Ravi Shankar, Suan Phaik Khoo
Background: Healthcare students and practitioners should develop appropriate knowledge, attitudes, and practice of sustainability. This study examined students’ perceived knowledge, perceptions, and readiness toward sustainability education and practices at a private healthcare university in Kuala Lumpur, Malaysia.
Methods: Foundation, undergraduate, and postgraduate students at the university were invited to participate in this cross-sectional study conducted using a validated questionnaire administered online. Students were invited to participate through institutional emails and social media platforms. Quantitative (Likert-type scale and multiple-choice items) data and responses to open-ended questions were collected.
Results: The study recruited 427 respondents (women: 328, Malaysian: 351). The majority (83.6%) were undergraduate students, and 81% had not taken any courses related to sustainability. With respect to environmental health and planetary health, 92.3% and 87.2% rated their knowledge level as fair or good, respectively. Climate change, pollution, and deforestation were mentioned by the respondents as key challenges to sustainability. Workshops or seminars were preferred for learning these topics. Conserving water/energy, using reusable materials, and reducing plastic use were the most common measures employed by the respondents. Their levels of concern about current sustainability challenges were moderate.
Conclusions: The findings can serve as a reference for the university’s efforts to integrate sustainability into its curriculum and promote sustainable practices among students. By identifying knowledge gaps and attitudes, this study can help in developing targeted educational strategies and institutional policies that other institutions may also consider. Similar studies in other universities are required.
The United Nations Educational, Scientific, and Cultural Organization describes education for sustainable development (ESD) as vital for promoting a sustainable future by empowering individuals to acquire the required knowledge, skills, attitudes, and values [1]. ESD includes critical topics such as climate change, disaster risk reduction, biodiversity, poverty alleviation, and the sustainable use of resources, which are crucial for the future of the planet. ESD provides learners with knowledge about and motivates them to embrace sustainable practices and engage in efforts to promote sustainability. To effectively advocate for and practice sustainability, university students must have knowledge of the United Nations Sustainable Development Goals (SDGs). They should be aware of the importance of integrating these goals into their educational, personal, and professional journeys [2]. To be effective advocates, good perceived knowledge (self-assessment of one’s understanding of specific subjects [3]) and perceptions (a person’s interpretation of a situation or stimulus based on past experiences [4]) are crucial.
Universities have an important role in educating students about sustainability and can greatly impact their attitudes and behaviors. An understanding of students’ knowledge, perceptions, and readiness regarding sustainability is important for improving educational experiences and cultivating a sustainable culture both at the university and in the future. In a pilot study at Universiti Teknologi Mara (UiTM), Malaysia, students exhibited basic knowledge of energy efficiency and sustainability practices but faced challenges in applying it to daily life [5]. A similar study conducted by the School of Social Sciences at Universiti Sains Malaysia (USM) revealed that students held positive perceptions about sustainability initiatives. They strongly believed in simple but effective practices such as banning plastic bags on campuses [6]. These two studies were conducted at public universities in Malaysia.
Recent research that offers updated insights into the perceptions and readiness of students at Malaysian private universities regarding sustainability practices is needed. The research should focus on changes over time, demographic variations, and the increased importance of the topic. Teaching and learning sustainable healthcare are becoming increasingly important in medical colleges, and students’ demand for its inclusion in the curriculum is rising [7]. Faculty and students can learn from one another in this developing field, while the wider determinants of disease are incorporated in assessments given the heightened demand for limited curricular time in medicine. University students in Albania strongly desired to incorporate sustainable development (SD) into existing educational strategies [8]. Students’ levels of ESD knowledge may not substantially differ across regions and countries, however, research reveals that students from urban areas engage in sustainability behaviors more effectively compared with their peers in rural areas. This aspect may be influenced by factors such as university administration and community organizations, which contribute to students’ exposure to ESD knowledge and sustainable consumption practices [9]. Out of 12 recommended strategies for teaching environmental sustainability to health professionals mentioned in a recent study, two highlight the integration of topic(s) into the core curriculum and the use of formative assessments, tasks, and portfolios [10]. Prioritizing content for local situations and linking sustainability to broad objectives in professional practice are also important. Parker et al. [11] conducted a scoping review to examine the environmental competencies of healthcare professionals and identified general management skills (40%) and research skills (37%) as competencies that align with professional practice. The authors highlighted three competencies specific to the environment, namely, resource stewardship, system thinking, and social and environmental justice. Thus, compared with other universities, sustainability education in healthcare-oriented universities may have several distinct features, especially in terms of demands on curricular time and integration with healthcare competencies.
An extensive assessment of ESD knowledge can help identify knowledge and readiness gaps, thereby enabling universities to customize their sustainability education [12]. The current study investigates these issues among students in a private university in Malaysia. By analyzing students’ perceptions and readiness to engage in sustainability education, the study may provide strategies for enhancing educational practices to better align with the objectives of sustainability education. This study uses a questionnaire (with close-ended and open-text questions) to gain an in-depth understanding of students’ involvement in sustainability.
The objectives of the study are as follows:
1.
2.
3.
Subjects and setting: The researchers recruited students enrolled at IMU University (IMU) campuses.
The inclusion criteria were as follows: 18 years of age or older and enrolled in foundation, undergraduate, or postgraduate programs at the university campuses.
Students from other universities who were participating in exchange or student mobility programs, distance learning/online learning students, and those aged below 18 years were excluded.
Sample size determination: This was determined via Raosoft, an online sample size calculator. The sample size was calculated for a finite population size. With a total estimated population of 4500 and a distribution percentage of knowledge, perception and practices of 50%, the minimum calculated sample size was 355. An additional 20% was included to account for dropouts and attrition, which led to an adjusted minimum sample size of 426 [13].
Data collection: The English language questionnaire was entered into Microsoft Forms. Students’ demographics, perceived knowledge, perceptions, and preparedness regarding sustainability education and practice were studied using a combination of closed-ended multiple-choice questions, Likert-type scale ratings, and open-ended questions. The questionnaire was designed considering the objectives of the current study. It was sent to student participants via institutional and personal emails and was also shared with batch representatives, who used social media platforms such as WhatsApp to remind their batchmates and encourage participation. During the two-month period that the survey was conducted, weekly reminders were sent via email to increase response rates. All students who completed the questionnaire within a two-month period were given an online voucher as a gesture of appreciation. The participants completed the questionnaire during their free time; in the case of questions or concerns, they could contact the researchers using the details provided in the informed consent form. A total of 4123 students in the programs were selected for the study, which was concluded after the desired sample size was achieved.
Statistical analysis: IBM SPSS Statistics version 30 was used for analysis. Descriptive statistics were employed to summarize the average, dispersion, frequency, and proportion of the participants’ attributes. Scores for certain statements were calculated and compared among groups of respondents.
Questionnaire validation: Four experts in the field conducted content validation, and the questionnaire was modified according to their inputs. The revised version was sent to the same experts for review and comments. Face validation was performed by six respondents who matched the inclusion criteria. A pilot test on 10 students was subsequently conducted to identify ambiguous questions and ensure that the items accurately reflect the intended information to be collected. The method outlined by Yusoff [14] for content validation was used.
The content validation index (CVI) was calculated as per the author’s description. The item-level (I-CVI) and scale-level content validity indices (S-CVI/ave) were 1. Additionally, the S-CVI/UA (scale-level content validity index based on the universal agreement method) was recorded as 1, which indicates strong agreement among the experts regarding the validity of the questionnaire. The questionnaire demonstrated good internal consistency during the pretesting phase, with a Cronbach’s alpha value of 0.807.
Analysis: The Supplementary File presents the questionnaire used in the study. Cronbach’s alpha value for the questionnaire following its administration to the respondents reached 0.79. Questions B1 and B2 addressed students self-rated knowledge of environmental health and planetary health; questions C1–C6 identified levels of concern with different issues; the total score was computed by summing the scores for C1–C6. These questions were coded. Additionally, question E1 was coded, and a score was calculated. For questions B1 and B2, which focused on self-rated knowledge and understanding, poor, fair, good, and excellent knowledge were scored 1, 2, 3, and 4, respectively. For questions C1–C6 (concerns about different sustainability challenges), the responses not concerned, neutral, slightly concerned, and very concerned were given scores of 1, 2, 3, and 4, respectively. For item E1 (willingness to participate in sustainability initiatives), the responses not willing, neutral, somewhat willing, and very willing were given scores of 1, 2, 3, and 4, respectively. The other items were analyzed based on the number and frequency of responses. A one-sample Kolmogorov-Smirnov test was employed to determine the normality of the distribution of scores (p < 0.05). The distribution of the scores was non-normal, and the median and interquartile ranges were calculated as measures of central tendency and dispersion, respectively. The scores were compared between male and female respondents, among age groups, nationalities (Malaysian and non-Malaysian), programs of study (preuniversity, undergraduate, or postgraduate), years of study, and student who had and had not completed any course on sustainability or environmental health via the independent-sample median test (p < 0.05).
A total of 427 respondents completed the questionnaire. Table 1 presents their demographic characteristics.
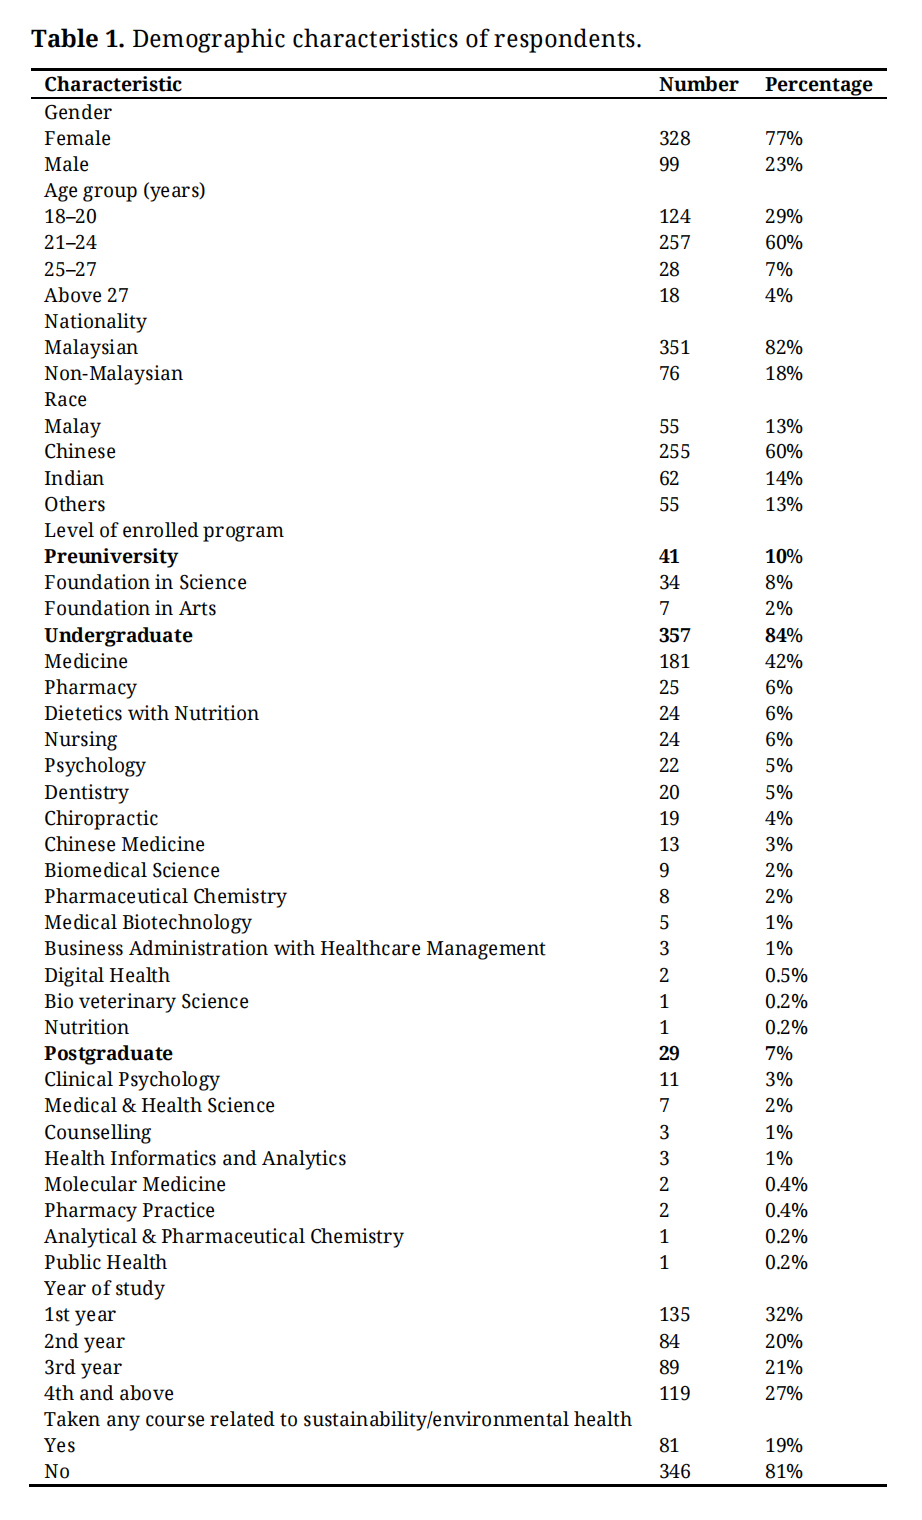 Table 1. Demographic characteristics of respondents.
In the undergraduate programs, 181 (42.3%), 25 (6%), 24 (6%), 24 (6%), and 22 (5%) respondents were enrolled in medicine, pharmacy, nursing, dietetics and nutrition, and psychology, respectively, while 71 students (17%) did not provide information on their area of study.
The respondents were familiar with different aspects of sustainability. Table 2 outlines responses to different questions. The respondents were most familiar with climate change, renewable energy, and waste management. A total of 395 respondents (92%) rated their current knowledge of environmental health as fair or good. For planetary health, 373 (88%) regarded their knowledge as fair or good. Table 3 illustrates the respondents’ perceptions of environmental and planetary health. They mentioned climate change, pollution, and deforestation as key challenges to sustainability. These three challenges mentioned by the respondents may be interconnected and changes in one can influence and affect others. Pollution has become a major issue in several nations Approximately 90% of the respondents were somewhat or very concerned about climate change, while 75% were concerned about challenges related to biodiversity loss.
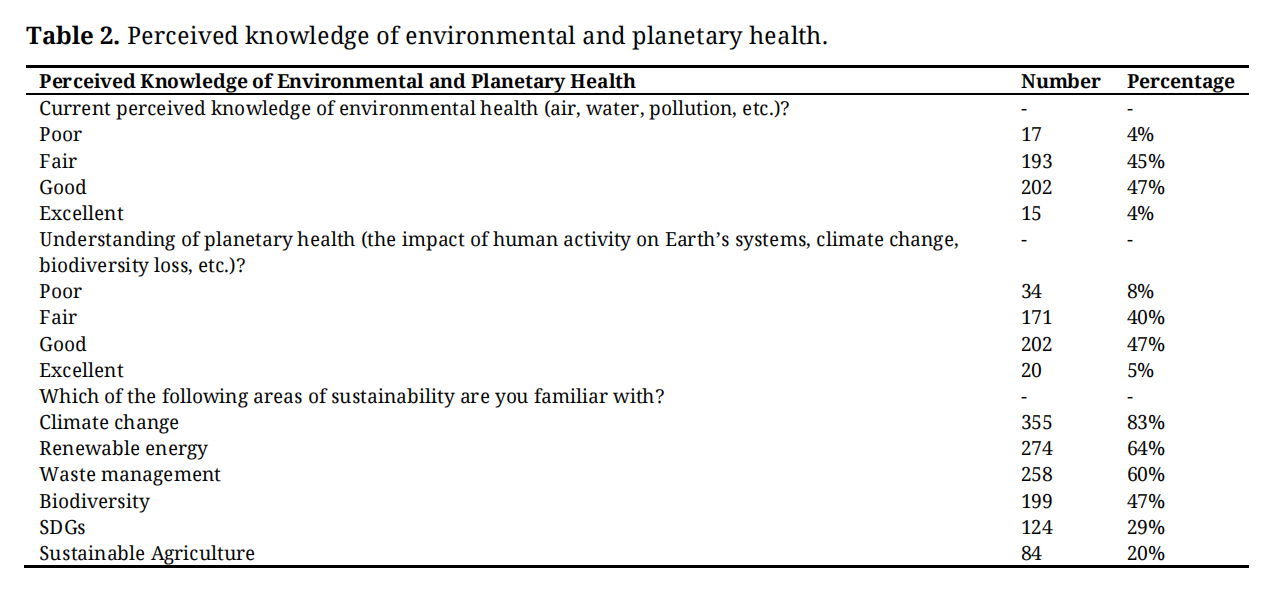 Table 2. Perceived knowledge of environmental and planetary health.
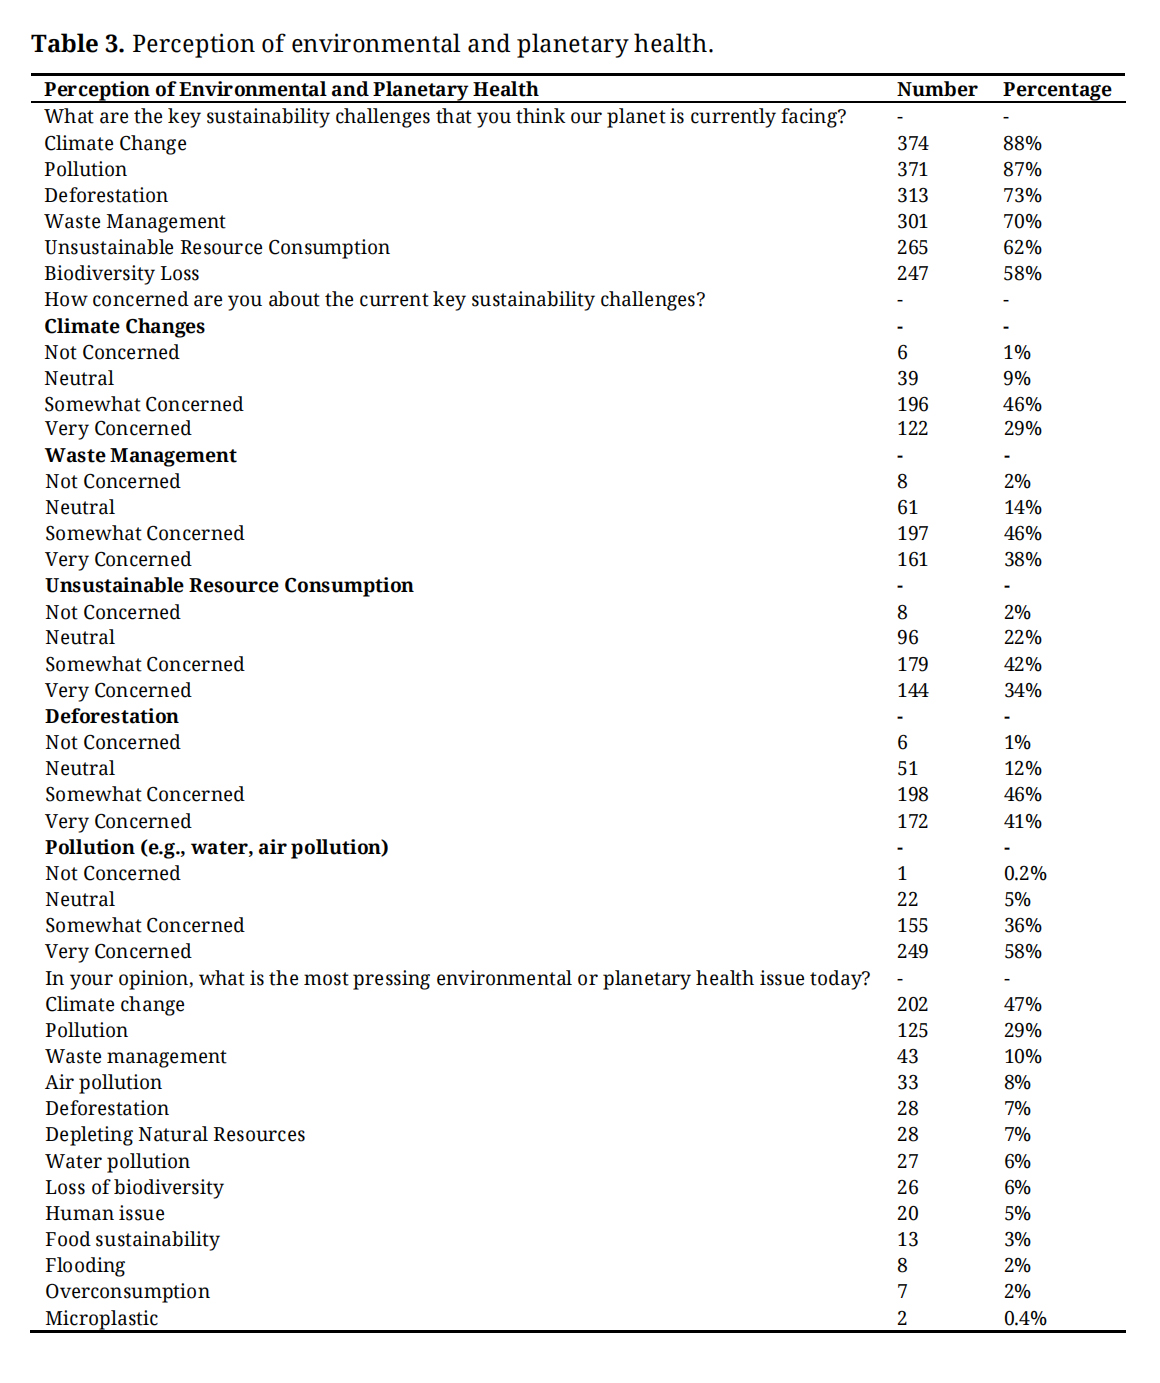 Table 3. Perception of environmental and planetary health.
Table 4 indicates that median and knowledge scores were high, while concern scores were moderate except for pollution, which exhibited a high score. The total score for concerns regarding current sustainability challenges was calculated. The maximum possible score was 24 (median score: 13, interquartile range: 4). Table 5 demonstrates that there was a difference in the knowledge and understanding of the environment and planetary health among males and females though the median scores were the same. The mean scores were higher among males in both categories, and the non-parametric median test showed a significant difference. Scores for concerns regarding deforestation and waste management were higher for older respondents (those aged more than 27 years). The total score did not significantly differ among the subgroups of respondents.
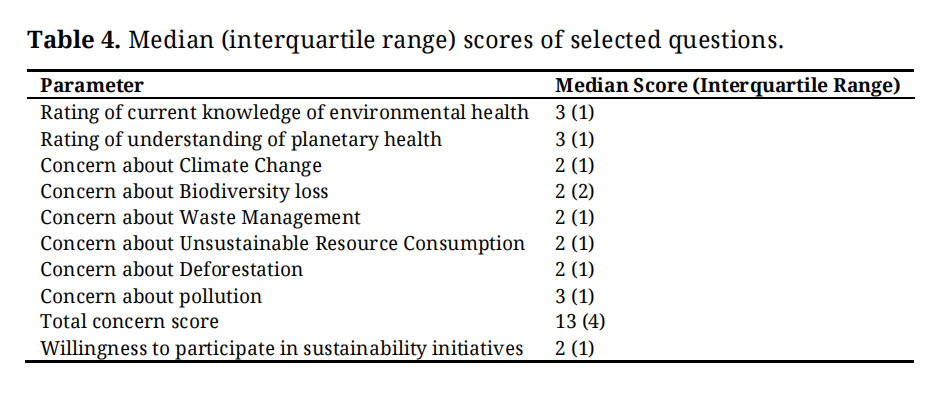 Table 4. Median (interquartile range) scores of selected questions.
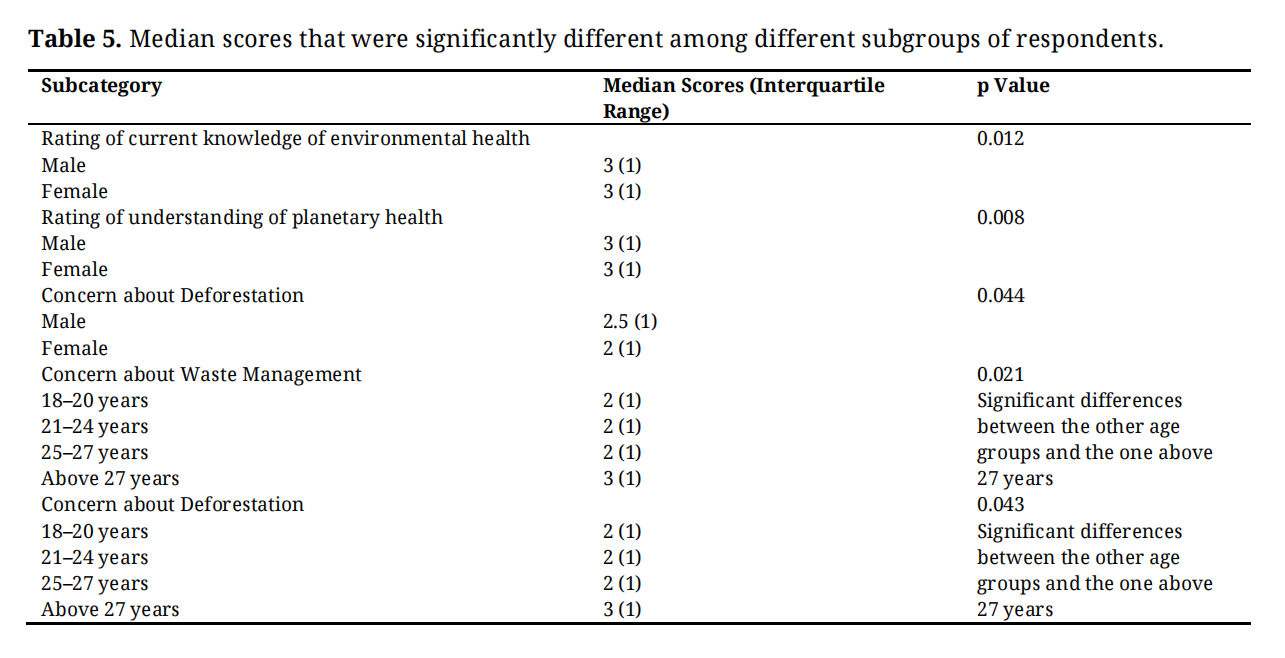 Table 5. Median scores that were significantly different among different subgroups of respondents.
Table 6 depicts the respondents’ opinions on sustainability education. Creating knowledge of environmental outcomes and developing awareness and understanding were the two most common responses regarding how sustainability education can help the respondents. Sixty-four percent were in favor of the inclusion of sustainability education as a mandatory component of the university’s curriculum. Many respondents preferred workshops or seminars as teaching-learning methods, while others opted for extracurricular activities or integration into existing courses. They mentioned the need for prioritization of climate change, waste management, and sustainable resource use in the curriculum. When asked whether sustainability education should be a mandatory component of the university’s curriculum, 272 respondents (63.6%) agreed, whereas 126 respondents (29.4%) were unsure. Moreover, 126 (24.8%) were somewhat willing to be involved in sustainability initiatives.
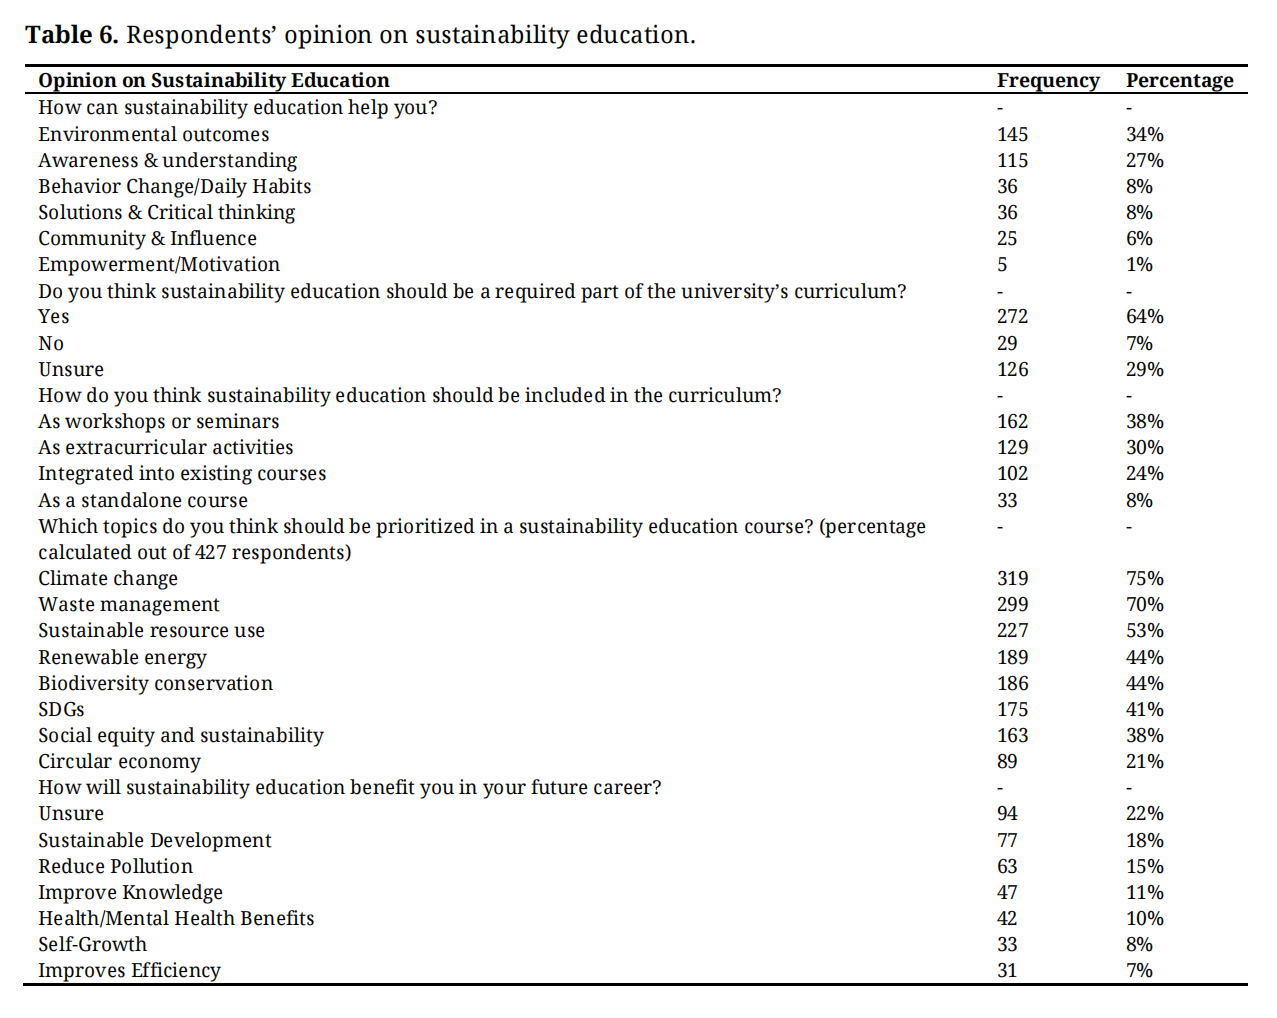 Table 6. Respondents’ opinion on sustainability education.
Table 7 indicates the respondents’ readiness for action on sustainability. During the past six months, the most common measures they have undertaken to promote sustainability include conserving water/energy, using reusables, and reducing plastic use. A total of 322 respondents (75.4%) were somewhat or very willing to participate in sustainability initiatives on campuses. Approximately 83% were willing to be involved in sustainability efforts. Tree planting, recycling programs, sustainable transportation, waste reduction initiatives, energy conservation efforts and campus clean-ups were mentioned. Students should be involved in planning and implementing sustainability efforts on campuses. Improvement in recycling, reducing the use of single-use plastic, and energy conservation for fostering sustainability on campuses were mentioned. The main barriers to the adoption of sustainable practices on campuses were the lack of awareness, inconvenience, and resistance to change. Approximately 82% of the respondents expressed that they should be involved in planning and implementing sustainability initiatives on campuses.
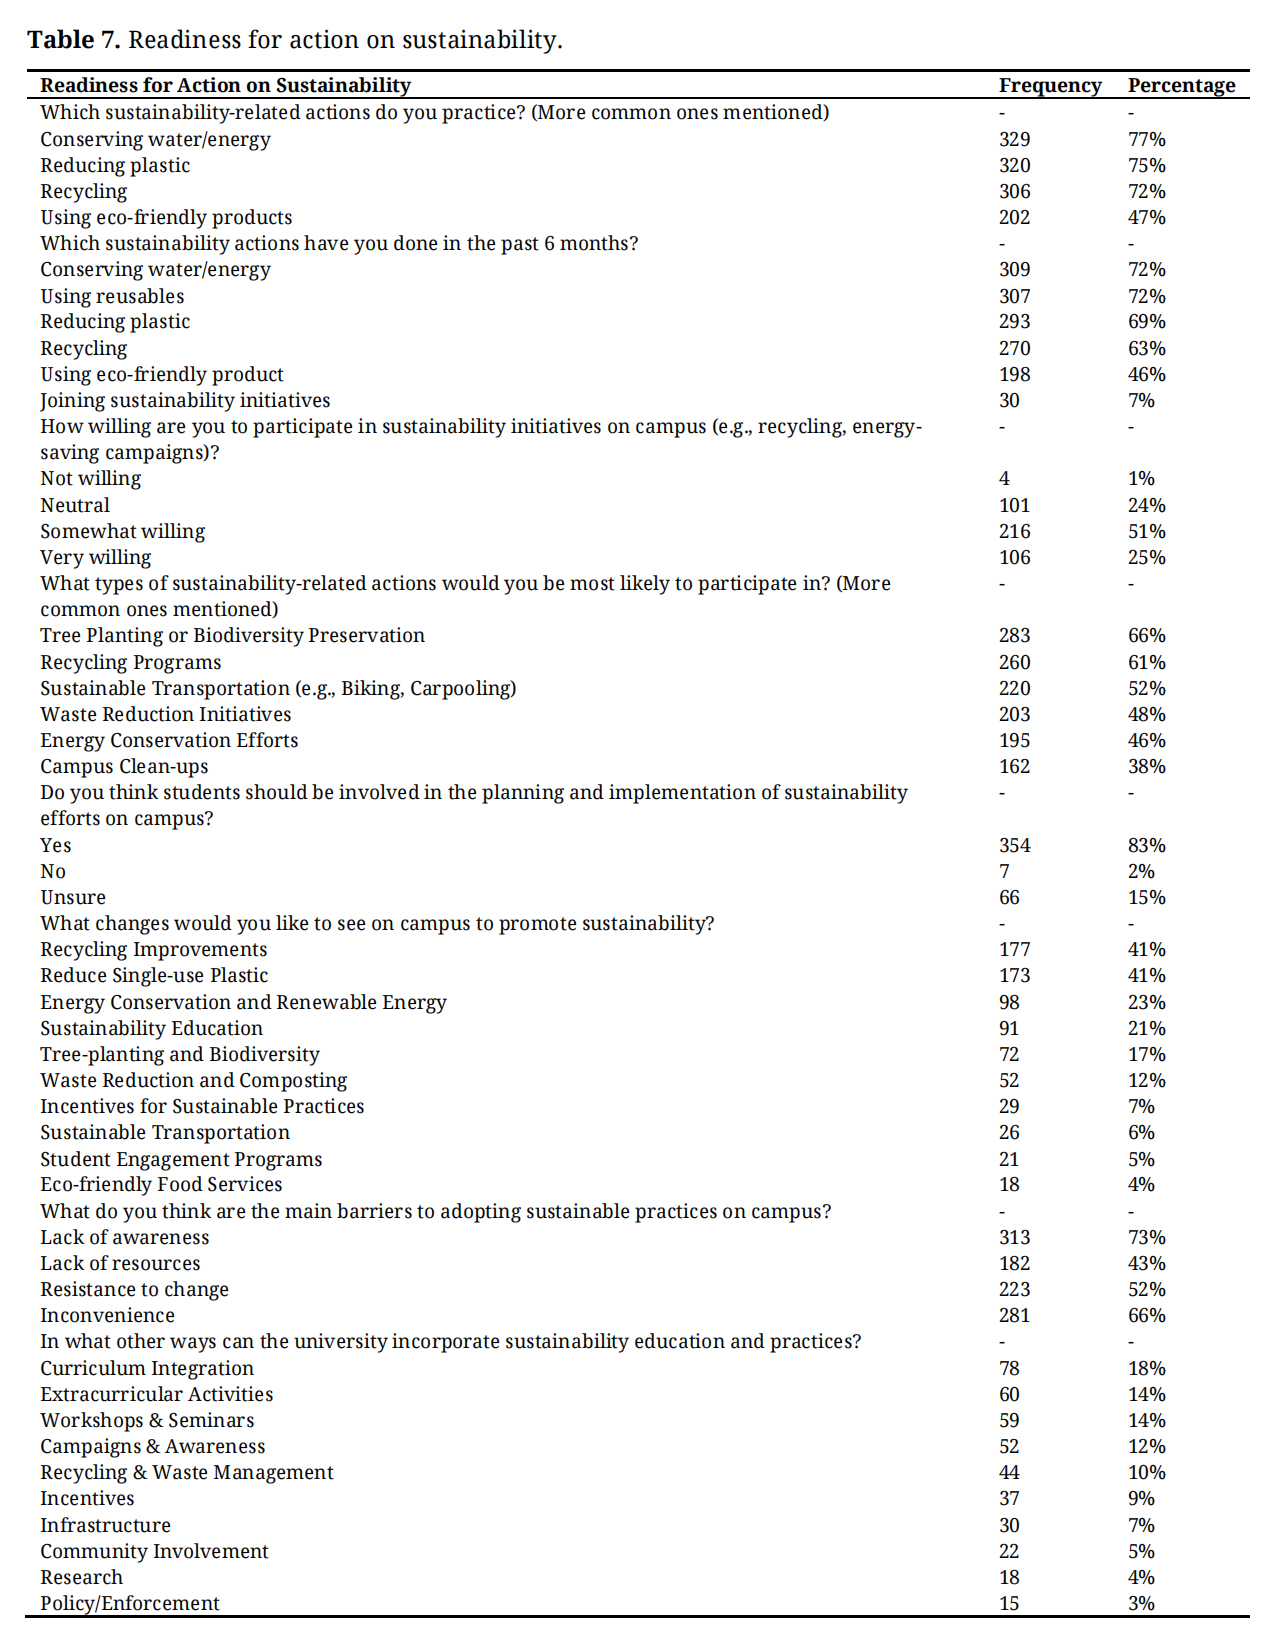 Table 7. Readiness for action on sustainability.
Most of the participants were women (76.8%); ages primarily ranged from 21 to 24 years (60.2%); 84% were undergraduate students, particularly in medicine, pharmacy, and dietetics and nutrition. This distribution is consistent with earlier patterns observed in higher education institutions in Malaysia, especially in health sciences. For example, a study conducted at USM reported that 78.4% of mixed sciences students were women [6]. In the present study, only 19% of the respondents reported taking courses related to sustainability or environmental health. There was a lack of formal exposure to sustainability education. Although students may informally obtain information on sustainability through media or personal interests, the low offering of formal courses may indicate that universities have only partially integrated sustainability systematically into their curricula, particularly in professional healthcare programs, as in the present study.
We will now explore and discuss the findings according to the study objectives.
Study objective 1: Assess the perceived knowledge of students at a healthcare university on sustainability education and practice.
Formal exposure to sustainability in the curriculum: The low level of curricular exposure in the current study agrees with the findings of a cross-sectional study on health sciences students at Haramaya University, Ethiopia, by Nigatu et al. The results indicated that 77.5% of the respondents acknowledged awareness of the health effects of climate change, while 87.7% perceived that their knowledge was lacking. They mentioned insufficient coverage of sustainability in the curricula as an important reason underlying these results [15]. In contrast, a study conducted at the University of Malaya [2] on the knowledge, attitudes, and practices of university students toward the SDGs, which included 382 respondents, indicated respondents have high knowledge with a positive attitude towards SDGs. The authors reported high levels of overall knowledge. This finding may indicate an increased emphasis on sustainability within the institution compared with the limited formal exposure observed in the current study [2]. A manuscript on faculty development in sustainable healthcare education highlighted interdisciplinary collaboration (e.g., medicine and nursing) among students in educational institutions from the United States (US), the United Kingdom (UK), and Australia using case studies. The results revealed that student engagement frequently helped in addressing knowledge gaps in curricula that lack sustainability integration [16]. A study on Arab nursing students from Egypt, Iraq, the Palestinian Territories, and Saudi Arabia (n = 1059) reported the predominance of women students and the minimal curricular integration of sustainability [8].
At the University of Cape Town (UCT) in South Africa, a study among 264 students in the health sciences (80% medical students) reported limited curricular exposure to sustainability [17]. Research at Osun State University, Nigeria (n = 450), revealed that 66.9% of participants (academic staff and students) were aware of sustainability, with the academic staff reporting a higher level of awareness [18]. A study on 1200 nursing students from three universities in Egypt revealed significant demographic variations, with rural students exhibiting higher levels of sustainability awareness [19]. While studies typically reflect the predominance of women and of undergraduates in developing countries, formal curricular exposure to sustainability remains low. The University of Plymouth in the UK developed the conceptual ESD framework, which stresses the importance of integrated educational approaches in increasing sustainability awareness [20].
Knowledge of SD and environmental issues: The current findings are more favorable than those of a study conducted on medical students in Turkey, where a large percentage of students (63.6%) were unfamiliar with SD, and only 7.9% indicated familiarity with the definition of SD [21]. Women with good economic status had higher SD scores. Nearly half of the respondents mentioned that physicians may play an active role in achieving SD. Research at Yale University in the US, conducted on students from various healthcare fields, revealed that physicians, nurses, and physician assistants agreed that conserving resources and mitigating pollution is part of their duty and professional responsibility. Most participants in the US study agreed or strongly agreed that the connection among pollution, climate change, and health should be included in the curriculum and reinforced during clinical practice. Approximately 85% of the respondents in the US study perceived that insufficient education on disease burdens caused by healthcare-related pollution limited their ability to take responsibility for resource conservation and pollution prevention. Compared with their male and medical student counterparts, women and physician assistant students demonstrated greater dedication [22].
In the current study, scores for knowledge were higher for men (the mean scores were higher, and the non-parametric median test showed a significant difference). This finding is in contrast with those of previous studies that reported higher scores for female students [17,23]. However, other studies found no significant difference or reported that male students supported the mandatory inclusion of environmental education, which resulted in higher levels of awareness [24,25]. The number of male students at the university and in the current study was low; therefore, a possibility exists that students with a greater interest in sustainability may have participated. The scores for concern were higher for older students, which has been noted in the literature [26]. Ecological knowledge and the development of understanding over time may be mainly responsible for the higher average scores among middle-aged adults. The South Australian study found that the ecological literacy component of environmental and sustainability knowledge was strongly correlated with age, given one’s accumulation of diverse life experiences. Adults in the middle age range (35–54 years) possessed higher levels of ecological literacy compared with younger adults (18–34 years) [27].
In the current study, the students primarily rated their knowledge of environmental and planetary health as fair (92.3%) or good (87.2%). The median score was 3, while the maximum possible score for each field was 4, which indicates a moderate level of awareness. This result is similar to those of studies in other Malaysian institutions, such as UiTM and USM, where students exhibited considerable levels of awareness but lacked depth in application [5,6]. Climate change, renewable energy, and waste management were more familiar to students compared with concepts such as the SDGs or sustainable agriculture. This disparity can limit students’ capacity to critically evaluate the implications for healthcare systems and healthcare delivery [8].
Study objective 2: Explore the perceptions of students toward sustainability education and practice
Potential consequences of limited knowledge of planetary health and sustainability: The limited understanding of concepts such as planetary health, which connects environmental changes to human health, among healthcare students, is concerning. For this reason, educational curricula that integrate sustainability with public health and healthcare practices are required. Similar gaps were observed among health sciences students in Ethiopia, as previously mentioned. This finding was particularly common among medical and pharmacy students, who mentioned the inadequate coverage of sustainability in the curricula and dependence on mass media for information on the topic as potential reasons [15]. A Malaysian study similarly reported high levels of awareness of the SDGs among university students, with a positive correlation between knowledge and practice (r = 0.4). However, the authors emphasized that global agendas, instead of curricular integration, may influence such awareness.
Educators and students have collaboratively developed sustainable practices and worked toward implementing health-promoting practices [16]. Nevertheless, an understanding of the interconnectedness of sustainability issues and their health implications is crucial to understanding the relationship between environmental changes and human health and to engage in sustainable practices. Sustainability education is required not only to enhance knowledge and awareness but also to encourage a systems-thinking method, helping students comprehend the influence of these interconnected issues on human health and well-being.
The current results correspond with the perceptions of Ethiopian students, 53.6% of whom regarded climate change as a serious health concern, and students with awareness of these issues were 16.8 times more likely to view it as a threat compared with those without awareness. Abstract topics such as biodiversity loss have received less emphasis due to insufficient knowledge [15]. Conversely, Malaysian students displayed favorable attitudes toward the SDGs, and attitudes showed a strong correlation with practices, but a weak negative association was noted between attitudes and practices. The level of recognition of the importance of sustainability is high, but systemic hurdles may hinder its implementation [2].
Student advocacy can shift the perceptions of faculty and communities. Case studies conducted in UK and Australian institutions demonstrated the influence exerted by students on faculty in prioritizing systems thinking and nurturing perspectives addressing the interconnectedness of issues such as pollution and health. In the current study, however, these topics received less representation in the students’ responses [16]. UCT students emphasized industrialization and human activities as contributing factors, with 58.3% recognizing the role of health professionals in education regarding these topics [17]. Approximately 56.3% of the Nigerian students exhibited positive attitudes despite limited knowledge [18]. Diverse student perspectives regarding pressing environmental threats may necessitate system-thinking methods that bridge perceptions with health-focused and equitable sustainability measures.
Students’ views on sustainability education and perceived obstacles: The current study identified positive engagement and gaps that the university could address to enhance curricular sustainability integration. A significant proportion of the respondents (63.6%) were in favor of sustainability education as a mandatory part of the curriculum. Improved environmental outcomes, enhanced awareness, and behavioral changes were mentioned as the primary advantages of such education. This agrees with the global definitions of ESD, which seek to inculcate knowledge, values, and actions toward a sustainable future [1].
Healthcare students preferred workshops, extracurricular activities, and integration into current courses as delivery methods, favoring flexible and hands-on learning experiences over traditional teaching methods. Standalone courses were preferred by a very small percentage, likely due to the very demanding nature of healthcare education and limited curricular time to learn and be assessed in an additional subject. Climate change, waste management, and sustainable resource use were the topics of greatest interest to students, which aligns with the findings of a previous study on environmental awareness among Malaysian students [5].
Nonetheless, 94 students expressed uncertainty regarding how education on sustainability could enhance their careers. This may signal a gap between sustainability concepts and their perceived importance in health-related fields. Sustainability education may be perceived as secondary to essential discipline content [8]. Universities should work to make explicit to students the connections between sustainability and the future roles of healthcare, public health, and systems thinking. This is highlighted in the next paragraph, where an initiative from Canada is presented.
In Canada, the Project Green Healthcare initiative involved seven teams of medical students implementing sustainability projects within local healthcare settings and medical schools. The project aimed to achieve net-zero healthcare by equipping future physicians with the knowledge and skills for practicing environmentally responsible healthcare and also encouraging them to become leaders in sustainability in healthcare [28]rch conducted in 17 African nations, among undergraduate medical students and surgical trainees, revealed low levels of knowledge on sustainability. More than 60% of the participants stated that they did not receive any training on the topic [29], while approximately 75% did not engage in any sustainability-related projects. In Europe, the European Network on Climate & Health Education proposed a framework for incorporating climate realities into medical training [30]. In Malaysia, a recent publication advocated a comprehensive strategy for incorporating the SDGs and planetary health into undergraduate medical education [31].
Most students highlighted practices such as conserving water and energy, minimizing plastic use, and recycling. These behaviors were consistently reported during the past six months. However, while 25% of students expressed a strong desire to participate in sustainability programs on campus, a greater percentage of 51% were only relatively inclined, while 24% remained neutral. This finding revealed a gap between willingness and actual participation. The students demonstrated the most interest in tree planting and biodiversity efforts, followed by recycling initiatives, sustainable transportation options, waste reduction activities, and energy conservation efforts. Campus cleanups were also supported. A significant majority (n = 354) (83%) believed students should actively participate in the design and execution of campus sustainability initiatives. The current study also identified various barriers to the incorporation of sustainability and sustainable behaviors. The main challenges mentioned by the respondents were a lack of or low awareness, inconvenience, and resistance to change. These findings agree with those identified previously [4].
Study objective 3: Assess the levels of readiness of students for sustainability education and practice
The study provided valuable insights into the level of readiness and perceived barriers regarding sustainability education and practices. Previous studies were conducted mainly at government universities. The demographic and socioeconomic characteristics of the students may differ between these two types of institutions [32].
Readiness assessment and behavioral indicators: The varying readiness levels among the respondents may require differentiated approaches to engage students with sustainability education. Multiple factors, including varying levels of awareness of the relevance of sustainability to healthcare professions, differences in perceived feasibility to engage in sustainable practices, and confidence in their ability to contribute meaningfully to sustainability initiatives, may be responsible.
Behavioral practices and sustainability engagement: Most students highlighted practices they engaged in consistently over the past six months. Students have adopted relatively basic, simple-to-implement individual-level practices. However, this may also raise questions about the depth of students’ engagement with sustainability and their readiness to engage in more complex or systemic sustainability initiatives. There may be less engagement with concepts such as organizational sustainability, supply chain management, or systems-level sustainability interventions.
Organizational readiness and participation structures: Students should actively participate in the design and execution of sustainability initiatives on campus, suggesting a high level of readiness among students to take on leadership and decision-making roles in campus sustainability efforts. Students recognized the importance of student agency and participation in driving sustainability change.
Barriers to readiness and implementation challenges: Various barriers to incorporating sustainability and sustainable behaviors among students were identified. The main challenges were reduced awareness among respondents, inconvenience, and resistance to change. This agrees with previous studies [4]. Awareness of how sustainability relates to their professional practice or how to engage in sustainability initiatives within their disciplines may be low. Inconvenience refers to practical constraints that students face in carrying out sustainable behaviors. These may include limited access to sustainable options, time constraints within demanding academic schedules. They may also face difficulty in accessing information about available sustainability programs.
Readiness across professional disciplines: Students across multiple healthcare disciplines (medicine, pharmacy, dietetics and nutrition, and others) were studied, however, specific variations in readiness levels across disciplines were not extensively explored. Findings from the knowledge and perception sections suggest that readiness may vary by discipline. Medical and pharmacy students demonstrated concerns about inadequate coverage of sustainability in their curricula. Understanding these variations would be valuable for designing discipline-specific approaches. The strengths and interests of each professional group vary, and these should be leveraged to promote sustainability.
Strengths and limitations: A total of 427 students foundation, undergraduate, and postgraduate students were studied via a validated and pretested questionnaire. One of its limitations was that the survey was conducted mainly among health science students at one university. Participation was voluntary, which may have resulted in a higher participation of students who were more interested in sustainability issues. Moreover, the study may not have explored the participation and voluntary responses of students who did not engage in sustainability issues. The study was self-reported, and vouchers were provided as a token of appreciation. This may have influenced participation in the study. Thus, the sample may only be partially representative of the population of students in the courses included. The study was cross-sectional and causal implications cannot be examined. Finally, the students’ perceptions were collected using a questionnaire but were not triangulated with information from other methods and sources.
Students’ perceived knowledge, perceptions, and readiness for sustainability education and practice at a Malaysian private university were assessed in the current study. Respondents showed fair to good knowledge of environmental and sustainability issues. There were differences noted among certain subgroups. Male students expressed greater concern about deforestation, while older students (over 27 years) showed heightened concerns about environmental issues. Less than 20% of respondents had completed formal sustainability coursework, revealing a curriculum gap. This may be a matter of concern. Sustainability and one health courses are being developed at many universities. Students expressed strong positive perceptions toward sustainability education. They preferred diverse and non-conventional delivery formats including workshops, symposia, practical sessions, and online courses. A high level of readiness to engage with sustainability education and participate in campus initiatives was seen. Healthcare universities should develop and offer formal sustainability courses and actively involve students in designing and implementing sustainability on campus and prepare students to be future sustainability champions.
Similar studies should be carried out at other health and general universities. Formal sustainability curricula should be developed and integrated, with student involvement in course design and participation in campus sustainability initiatives. This can improve student knowledge, strengthen positive perceptions, and improve students’ level of readiness for sustainability education and practice.
The authors have used the program Grammarly to paraphrase the text and Quillbot to copyedit the manuscript.
“The study was approved by the Joint Committee on Research and Ethics of IMU University (project ID CSc-Sem6(02)2025 on 4th April 2025).”
"Regarding the Informed Consent Statement, informed consent was obtained from all subjects involved in the study"
Ethical consideration: The IMU Joint Committee on Research and Ethics approved the study protocol on April 4, 2025 (project ID: CSc-Sem6(02)2025). The ethical guidelines for ensuring the confidentiality of participant data were strictly followed. Written informed consent was obtained from the participants prior to completing the questionnaire. The study adhered to the principles outlined in the Declaration of Helsinki. All data were stored on a password-protected cloud drive, which could be accessed only by the team members.
Declaration of Helsinki STROBE Reporting GuidelineThis study adhered to the Helsinki Declaration. The Strengthening the Reporting of Observational studies in Epidemiology (STROBE) reporting guideline was followed.
The following supplementary materials are available online, RESEARCH QUESTIONNAIRE.
The data from the research is made available on the tables. The anonymized data set will be available from the corresponding authors upon reasonable request.
Conceptualization: Ideas, formulation or evolution of overarching research goals and aims, PRS, SPK, SMG, PES, KSY, KDP, SC, MEbJ; Methodology: Development or design of methodology; creation of models, PRS, SPK, SMG, PES, KSY, KDP, SC, MEbJ; Validation: Verification, whether as a part of the activity or separate, of the overall replication/reproducibility of results/experiments and other research outputs, PRS, SPK, SMG, PES, KSY, KDP, SC, MEbJ; Formal analysis: Application of statistical, mathematical, computational, or other formal techniques to analyze or synthesize study data, PRS, PES, KSY, SMG, KDP, MEbJ, SC ; Investigation: Conducting a research and investigation process, specifically performing the experiments, or data/evidence collection, PES, KSY, SMG, KDP, MEbJ, SC; Resources: Provision of study materials, reagents, materials, patients, laboratory samples, animals, instrumentation, computing resources, or other analysis tools, PES, KSY, SMG; Data Curation: Management activities to annotate (produce metadata), scrub data and maintain research data (including software code, where it is necessary for interpreting the data itself) for initial use and later reuse, PRS, PES, KSY, SMG, KDP, MEbJ, SC; Writing—Original Draft: Preparation, creation and/or presentation of the published work, specifically writing the initial draft (including substantive translation), PRS, SPK, PES, KSY, SMG, KDP, MEbJ, SC; Writing—Review & Editing: Preparation, creation and/or presentation of the published work by those from the original research group, specifically critical review, commentary or revision—including pre-or postpublication stages, PRS, SPK, PES, KSY, SMG, KDP, MEbJ, SC; Visualization: Preparation, creation and/or presentation of the published work, specifically visualization/data presentation, PES, KSY, SMG; Supervision: Oversight and leadership responsibility for the research activity planning and execution, including mentorship external to the core team, PRS, SPK; Project administration: Management and coordination responsibility for the research activity planning and execution, PRS, SPK; Funding acquisition: Acquisition of the financial support for the project leading to this publication, SPK, PRS.
The authors declare no conflicts of interest.
The project received a funding of RM 6000 with the project ID CSc-Sem6(02)2025 from the IMU University Joint Committee on Research and Ethics (IMUJC). The funder was not involved in study design, data collection and interpretation, manuscript preparation, or the decision to submit the work for publication.
We thank all the participants for responding to the questionnaire. We thank Miguel Leiva-Brondo, Universitat Politècnica de València, Spain, Owen Dan Luo, McGill University, Canada, Ayodeji P Ifegbesan, Olabisi Onabanjo University, Nigeria and Nurul Fatiah, Universiti Putra Malaysia, Malaysia for helping with the content validation of the questionnaire. We are grateful to Ms Katarzyna Paczek, an expatriate faculty at IMU University, for her suggestions to improve language and grammar in the manuscript.
1.
2.
3.
4.
5.
6.
7.
8.
9.
10.
11.
12.
13.
14.
15.
16.
17.
18.
19.
20.
21.
22.
23.
24.
25.
26.
27.
28.
29.
30.
31.
32.
Shankar PR, Khoo SP, Ganesan SM, Seow PE, Yeo KS, Premanenth KD, et al. Perceived knowledge, perception and readiness of university students regarding sustainability education and practice. J Sustain Res. 2026;8(1):e260007. https://doi.org/10.20900/jsr20260007.

Copyright © Hapres Co., Ltd. Privacy Policy | Terms and Conditions


