Location: Home >> Detail
J Sustain Res. 2026;8(2):e260043. https://doi.org/10.20900/jsr20260043
 ,
Kamila Gruskevica 2,* ,
Oskars Purmalis 3 ,
Solvita Kostjukova 4,5 ,
Julija Karasa 4 ,
Ivar Zekker 6 ,
Sandija Ozolina-Grinevica 1 ,
Andrejs Krauklis 7
,
Kamila Gruskevica 2,* ,
Oskars Purmalis 3 ,
Solvita Kostjukova 4,5 ,
Julija Karasa 4 ,
Ivar Zekker 6 ,
Sandija Ozolina-Grinevica 1 ,
Andrejs Krauklis 7
1 Institute of Landscape Architecture and Environmental Engineering, Faculty of Forest and Environmental Sciences, Latvia University of Life Sciences and Technologies, LV-3001 Jelgava, Latvia
2 Water Systems and Biotechnology Institute, Faculty of Natural Sciences and Technology, Riga Technical University, LV-1048 Riga, Latvia
3 Department of Environmental Science, Faculty of Science and Technology, University of Latvia, LV-1004 Riga, Latvia
4 The Faculty of Medicine and Life Sciences, University of Latvia, LV-1004 Riga, Latvia
5 The Faculty of Economics and Social Sciences, University of Latvia, LV-1050 Riga, Latvia
6 Institute of Chemistry, Faculty of Science and Technology, University of Tartu, 50411 Tartu, Estonia
7 MEI Group, Institute of Civil Engineering and Woodworking, Faculty of Forest and Environmental Sciences, Latvia University of Life Sciences and Technologies, Jelgava LV-3001, Latvia
* Correspondence: Ruta Ozola-Davidane, Kamila Gruskevica
The removal and recovery of phosphorus (P) from wastewater is critical for preventing eutrophication and achieving sustainable nutrient management. This review critically evaluates sustainable sorbent materials for P removal and recovery, focusing on mineral-based, bio-based, and recycled sorbents derived from industrial by-products. It compares their P removal efficiencies, adsorption mechanisms, environmental impact, and regeneration potential. A structured application of the Technology Readiness Level (TRL) framework is used to evaluate the maturity, scale-up feasibility, and real‑world implementation potential of the reviewed P sorbents. The TRL‑based assessment complements performance comparisons by explicitly considering cost‑effectiveness, regulatory and policy alignment, and compatibility with existing wastewater treatment infrastructure. Sustainability aspects are addressed through lifecycle‑relevant criteria, including regenerability and reuse potential and valorisation pathways for spent sorbents (e.g., reuse as soil amendments or slow‑release fertilisers). The review concludes by identifying key evidence gaps (notably long‑term validation in real wastewater and robust regeneration/P‑recycling routes) and outlining research priorities to accelerate the development of efficient, scalable, and environmentally viable solutions for phosphorus recovery in wastewater treatment.
WWTP, wastewater treatment plant; TRL, Technology Readiness Level; PRISMA, Preferred Reporting Items for Systematic Reviews and Meta-Analyses; NASA, National Aeronautics and Space Administration; LDH, layered double hydroxides; LCA, Life Cycle Assessment; REE, Rare Earth Element; EPS, Extracellular Polymeric Substances; PVDF, Polyvinylidene Fluoride; GHG, Greenhouse Gas; BET, Brunauer–Emmett–Teller; XRD, X-ray diffraction; ACTW, amine cross-linking of spent tea leaves
Urbanisation, industrialisation, and intensive agriculture are causing an increase in phosphorus (P) levels, impairing water quality and sustainability. One of the most important environmental challenges associated with excess P in aquatic systems is eutrophication. Elevated P concentrations stimulate harmful algal blooms and oxygen depletion, significantly diminishing water quality and biodiversity [1]. Eutrophication poses a substantial threat to ecological stability, fisheries, and recreational water use, making effective P removal a fundamental goal for wastewater treatment plants (WWTPs). In response, regulatory agencies worldwide have tightened discharge standards, often requiring treated effluents to contain < 1 mg P/L [2]. This escalation in regulatory stringency has driven the development and implementation of more effective and reliable P-removal technologies, as many WWTPs currently rely on chemical precipitation or enhanced biological P removal to comply with environmental regulations [3].
The need for improved P management in wastewater is also rooted in sustainability and resource security. P is a limited, non-renewable resource predominantly obtained through phosphorite rock mining. Concerns over the long-term availability and geopolitical distribution of P reserves have intensified interest in P recovery from wastewater streams [4]. By extracting and reusing P as a fertiliser, WWTPs can shift from a linear disposal model to a more circular system, thereby promoting agricultural resilience and reducing reliance on raw P sources.
Conventional methods for P removal achieve significant P reduction in effluents, but generate large volumes of sludge and secondary pollution due to residual metals in the treated effluent [5]. Biological methods can reduce chemical use and facilitate resource recovery, although they remain complex, sensitive to operational conditions, and still produce sludge [6]. These limitations highlight the need for alternative or complementary approaches that balance high removal efficiency, cost-effectiveness, environmental compatibility, and operational simplicity.
In this context, the development and application of sorbent-based technologies have gained attention as a promising strategy for P removal and recovery. Recent studies demonstrate that natural and modified sorbents can achieve efficient nutrient removal, providing enhanced selectivity, reduced chemical consumption, and the potential for their regeneration and reuse [7–9]. Certain sorbents can simultaneously target multiple contaminants, streamline treatment processes, and reduce overall system complexity [10,11].
A sustainable sorbent can be defined as a material that is designed and produced in an environmentally-friendly and resource-efficient manner, while also exhibiting desirable properties for effective pollutant removal and potential for reuse or regeneration. These attributes align with efforts to minimise environmental impacts, lower treatment costs, and ensure long-term ecological stability [12–18]. In practical terms, this implies that sustainable sorbents should combine low energy and chemical requirements during production, the use of abundant or waste-derived materials, cost-effectiveness, high removal performance, and the ability to be regenerated, reused, or safely valorized after use.
This review provides a rigorous and up-to-date evaluation of sustainable sorbent materials and technologies for P removal and recovery from wastewater, synthesising findings from research articles published within the last ten years. Focusing on mineral-based, bio-based, and recycled materials derived from industrial by-products, the paper critically examines their removal efficiencies, sorption mechanisms, environmental impacts, and potential for full-scale implementation, while also addressing the regeneration and recycling of spent sorbents to assess their long-term sustainability. As part of this analysis, the TRL framework is applied to assess the maturity and real-world feasibility of these technologies. By comparing innovative and conventional P removal methods, this review aims to inform researchers, engineers, and policymakers on more sustainable, efficient, and cost-effective strategies for P management in wastewater treatment.
The systematic literature review was conducted in accordance with the PRISMA (Preferred Reporting Items for Systematic Reviews and Meta-Analyses) guidelines [19] to ensure methodological transparency, traceability, and reproducibility. During the identification phase, a comprehensive search was performed across electronic databases, including Scopus, Clarivate Web of Science (Core Collection), ScienceDirect. Boolean operators (AND, OR) were used to construct the search strategy, integrating the following keywords and combinations: “phosphorus removal”, “phosphate adsorption”, “sorbent”, “sustainable sorbents”, “biochar phosphorus”, “mineral-based sorbents”, “industrial by-products”, “wastewater”. Only peer-reviewed research articles were used. The search was restricted to publications from the past ten years, although earlier foundational studies were included where scientifically justified.
Following the removal of duplicate records, an eligibility assessment through full-text review was made, based on predefined inclusion criteria: (i) quantitative or qualitative evaluation of P removal efficiency; (ii) characterisation of sorption mechanisms; (iii) relevance to sustainable, mineral-based, bio-based, or industrial-by-product sorbents; and (iv) applicability to wastewater treatment contexts. The final set of eligible articles was incorporated into the qualitative synthesis and subsequently categorised by sorbent type and technology maturity to support comparative evaluation. Some references may be repeated across Tables 1–3 because information on different materials was obtained from the same article. The PRISMA flow diagram, detailing the study selection process and exclusion rationale, is provided in Figure S1.
To move beyond performance reporting and to address feasibility for implementation, this review applies the TRL framework. TRLs provide a common language to track progress from early research to operational deployment and are widely used across domains where scale-up, compliance, and system integration are decisive barriers (e.g., environmental engineering applications). TRL is a standardised nine-level scale originally developed by NASA and is widely used in fields such as defence [20], pharmaceuticals [21], and environmental engineering [22] to assess technology maturity from basic research to full commercialisation. The TRL scale categorises technological development into 9 distinct levels, from initial concept (TRL 1) through to actual system proven in an operational environment (TRL 9) [21,23].
TRL values were assigned based on the highest demonstrated stage reported in the literature only when supported by explicit evidence of scale and environment, not on theoretical potential. For each technology/material, we screened for: (i) test environment (synthetic vs real wastewater/effluent); (ii) system configuration (batch vs column/continuous); (iii) degree of process integration; and (iv) validation context (lab vs. pilot vs operational setting).
The TRL classification approach applied in this study is illustrated in Figure 1. The following criteria were used for TRL assignment:
●
●
●
●
●
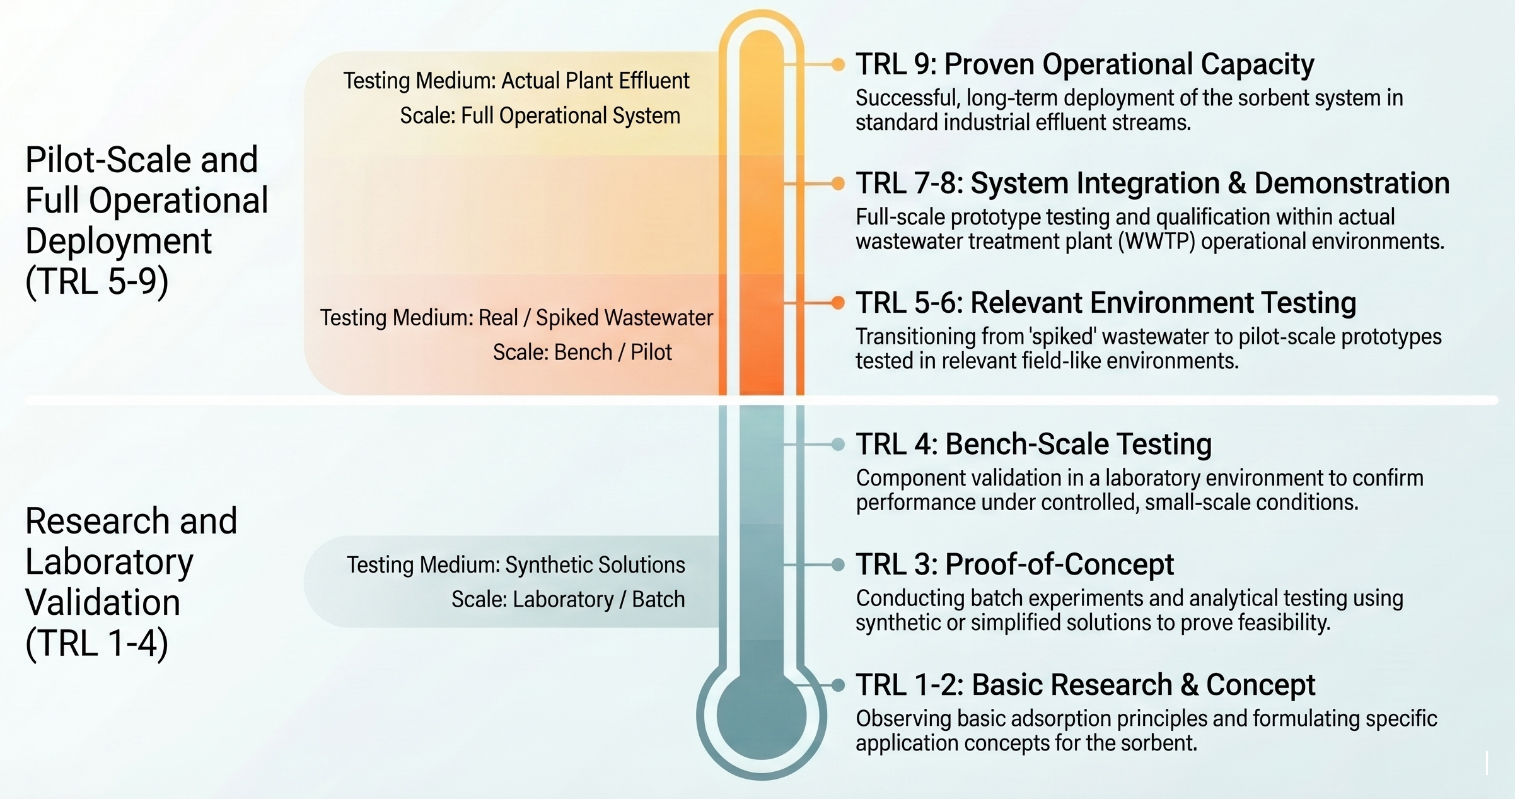 Figure 1. Adapted TRL framework for P sorbent technologies, illustrating the progression from laboratory (TRL 1–4) to pilot (TRL 5–6) and full-scale (TRL 7–9) implementation in wastewater treatment systems (image generated with ChatGPT).
Conservative rule for ambiguous cases. When literature evidence was insufficient to confirm pilot/field integration (e.g., missing matrix definition or unclear operational context), the TRL assignment was not upgraded, and the technology remained at the lower TRL consistent with available evidence. This addresses reviewer concerns about over-interpreting laboratory results and mixing non-comparable studies.
The TRL definitions applied in this review follow the Horizon Europe Work Programme General Annexes [24], where TRL levels are specified when required by call/topic conditions, and this approach is consistent with recent wastewater phosphorus recovery reviews that report technology maturity using TRL [25].
Mineral-based sorbents, including lanthanum, zirconium, and iron compounds, as well as zeolites, clays, and layered double hydroxides (LDHs), have been extensively studied for P removal due to their strong binding affinity, stability, and potential for regeneration. These materials exhibit diverse removal capacities, operating mechanisms, and pH applicability.
Lanthanum-Based SorbentsLanthanum (La)-based materials have shown high affinity for P due to strong ligand exchange and inner-sphere complexation. Among these, La–zeolite hybrid sorbents such as La-ZFA achieved >95% P removal across a wide pH range (pH 2.5–10.5), with an adsorption capacity of 23.5 mg P/g. P uptake was driven by ligand exchange and LaPO₄ formation, while 3M NaOH at 250 °C enabled regeneration of both La-ZFA and sorbed P [26]. Similarly, La-impregnated zeolite (NLZ) improved P uptake to 2.9 mg P/g (vs. 0.07 mg P/g for raw zeolite), primarily through formation of (LaO)(OH)PO₂, with minor pH dependence below pH 7 [27].
A cost-effective HPAL-LaOH sorbent, prepared by loading La(OH)3 onto calcined nano-porous palygorskite via hydrothermal synthesis, achieved a high P adsorption capacity (35.77 mg/g), over 13 times higher than raw palygorskite and exceeding that of commercial La(OH)3 (22.72 mg/g). HPAL-LaOH achieved near-complete P removal across pH 3–11, showed minimal impact from competing anions, and showed excellent stability, sedimentation behaviour, and reusability with negligible La leaching [28].
Similarly, in line with circular economy principles, Kasprzyk and Gajewska [29] tested two La-based natural sorbents, i.e., M1 (Rockfos®), a waste from thermally treated carbonate-siliceous rock, and M2, La-modified bentonite. They achieved P sorption capacities of 45.6 mg P/g (M1) and 5.6 mg P/g (M2) in synthetic wastewater.
Another bio-based alternative, a La-incorporated chitosan membrane (La@CS) prepared via casting, showed up to 25.0 mg P/g adsorption capacity. The main sorption mechanisms were electrostatic attraction and ion exchange between the membrane and PO43− [30].
Further advancement was made with MALZ, a La-incorporated nanostructured ternary (hydr)oxide sorbent with evenly distributed Mg, Al, and La on a zeolite [31]. MALZ showed rapid and efficient P removal across pH 4–10, reaching 80.8 mg P/g at pH 6.6 (12.5 wt% La). Coexisting anions (Cl−, SO42−, NO3−) had no significant effect on adsorption. MALZ maintained 75.8% of its capacity after four regeneration cycles using 0.5 M NaOH. Main sorption mechanisms included electrostatic attraction, ligand exchange, and inner-sphere complexation (LaPO4·xH2O), with Mg and Al enhancing La dispersion and surface charge.
Wei et al. (2020) [32] developed a La-Zr-Zn ternary oxide with 52.08 m2/g surface area, achieving >97% P removal efficiency at 0.2 g/L and pH 5–9. Adsorption followed pseudo-second-order kinetics and Langmuir model, with a capacity of 23.36 mg P/g at pH 6.8. La-modified natural (LZ) and magnetic zeolites (LMZ) reached 122.7 and 109.17 mg P/g, respectively, via inner-sphere complexation and electrostatic attraction. Additionally, LZ and LMZ acted as sediment passivators by transforming unstable iron-bound and organoclastic P into stable aluminium- and calcium-bound forms, thereby reducing its bioavailability. LMZ also demonstrated magnetic recyclability and superior capacity to adsorb active P [33].
High CO2 burden is associated with La-based adsorbent preparation, as rare earth element (REE) mining, extraction, and purification involve energy-intensive, multi-stage processes requiring strong acids and bases. Life Cycle Assessment (LCA) studies report substantial energy demand (e.g., ~177 MJ/kg for La2O3) and greenhouse gas emissions ranging from ~9 to >60 kg CO2-eq per kg of rare earth oxides, depending on the production route, highlighting a significant environmental footprint per unit of final sorbent [34]. Longer lifetime of ZnFeZr adsorbent in P desorption and adsorbent regeneration has been demonstrated with over 60 cycles using NaOH solution for the ZnFeZr adsorbent immobilised on Fe3O4/SiO2 [35]. The high cost of La salts further limits scalability relative to Fe- or Ca-based sorbents. Improving P adsorption efficiency is often achieved by immobilising La onto a wide array of stable, porous, and low-cost carriers. These diverse substrates span inorganic materials (magnetic Fe3O4, clay minerals, mesoporous silica), synthetic polymers (hydrogel, ion exchange resin), and carbonaceous derivatives (graphene, chitosan, agricultural/forestry wastes, and biochars). The spent La-phosphate product is a highly valuable, recoverable as P and La source, offering a strong economic incentive that offsets the high initial material cost [36].
Zirconium-Based SorbentsZirconium (Zr)-based sorbents have demonstrated good affinity for P due to strong ligand exchange, electrostatic interaction, and inner-sphere complexation mechanisms. Several composite materials have been developed to enhance their capacity, stability, and reusability.
A Zr4+-loaded okara sorbent (ZLO), prepared by impregnating soya bean waste with Zr4+ solution, has shown a dynamic adsorption capacity of 5.36 mg P/g in fixed-bed columns, with regeneration achieved using 0.2 M NaOH and 0.1 M HCl [37].
Novel zirconium-pillared montmorillonites (Zr-Mt and Zr/Al-Mt), prepared by introducing Zr4+ and Zr4+/Al3+ into montmorillonite clay (Mt), has shown enhanced surface area and a maximum sorption capacity of 17.2 mg P/g [38]. Adsorption followed pseudo-second-order and Langmuir models, was spontaneous and endothermic, and most effective at pH 3. Competitive ions had minor effects, except CO32−, leading to decreased adsorption efficiency. Zr leaching was negligible over pH 3–9, and the sorbents retained adsorption efficiency after three cycles.
Amorphous Zr hydroxide, tested both in batch and submerged membrane–filtration hybrid reactors (MFAH), showed Langmuir capacities from 18.5 to 54.6 mg P/g. Although performance declined after 5 h in MFAH, periodic Zr hydroxide addition restored removal efficiency for up to 3 days [39].
Zr/Fe oxide-loaded activated carbon nanofibres (ACF-ZrFe) achieved 26.3 mg P/g capacity at pH 4.0, with removal governed by ligand exchange and electrostatic attraction. Co-existing ions (F− > NO3− > Cl− > SO42−) in solution showed varied effects on P adsorption, which was affected by ligand exchange and electrostatic interactions as dominant mechanisms [40].
Chitosan–bentonite composites modified with Zr4+, Fe3+, and Ca2+ (Zr@CSBent, Fe@CSBent, Ca@CSBent) exhibited capacities of 13.33, 7.23, and 4.39 mg P/g, respectively. The sorption mechanisms varied among composites, involving ion exchange, electrostatic interaction, and inner-sphere complexation [41].
A Zn/Al/Zr-layered double hydroxide (ZARH) composite with hydrothermal carbon loading was synthesised via co-precipitation to enhance P removal from wastewater [42]. Microstructural analysis revealed that the ZARH-3 composite had a high specific surface area and abundant active sites. Under simulated conditions, it removed 99% of P (25 mg P/L) within two hours, achieving a maximum adsorption capacity of 26.64 mg P/g at pH 5. Adsorption followed Langmuir and Temkin isotherms (R2 > 0.99), driven by ion exchange, electrostatic attraction, and ligand exchange mechanisms.
Zr salts (e.g., ZrOCl2, ZrCl4) typically are not waste-derived materials but are synthesised from Zr sand (ZrSiO4) via energy-intensive thermal and acid/chlorination processes, resulting in a substantial LCA footprint [43,44].
Iron-Based SorbentsVarious iron-based sorbents have been investigated for P removal from wastewater, including zero-valent iron/sand materials [45], Cu-chitosan/Fe3O4 nanocomposites [46], Ce-incorporated zinc ferrites [47], iron doped clays [48], TiO2/Fe3O4 composites [49] and sodium alginate based (SA)-Fe(III) extracellular polymeric substances (EPS)-like hydrogels [50].
The highest P adsorption result (134.33 mg P/g) was achieved using (SA)-Fe3⁺ (EPS)-like hydrogel, a cheaper alternative to natural EPS based hydrogels. Surface adsorption was noted at initial P concentrations of 0–35 mg/L, shifting to internal diffusion control at higher concentrations [50].
All iron-based sorbents described here showed best performance in neutral pH range. In initial stages several studies demonstrated chemical P adsorption driven by electrostatic attraction and ligand exchange [45,46,50]. After equilibrium conditions were reached, adsorption shifted to P diffusion to internal layers [48,50].
P-saturated HA@SA-Fe3+ hydrogels demonstrated potential as sustainable-release P fertilisers [50], while doped clay-based sorbents were deemed for one-time applications [48], other materials may be reused up to five cycles using alkalis for P desorption [47,49]. Magnetite mineral microparticles (Mag-MM) also demonstrated high reusability. In real secondary wastewater effluent, they achieved up to 0.83 mg P/g while consistently reducing effluent P levels below 0.1 mg/L over 30 reuse cycles. P recovery was facilitated via CaCl2-induced precipitation, and alkaline regenerants such as NaOH, KHCO3, or Na2CO3 showed better desorption efficiency than sodium acetate [51].
Utilising Fe-rich industrial wastes (e.g., steel slag, Fe-rich sludge) avoids landfilling and land-use impact, providing a direct LCA credit and near-zero adsorbent producing costs. Some Fe-composites (like Fe-biochar) require pyrolysis/calcination (typically 300–700 °C). The energy input for this step contributes the most CO2 to the final material. However, the energy input is often lower than for Ca-based materials since the goal is stabilisation, not calcination. Acid mine drainage oxides, steel slag, Fe-rich sludges have low processing costs. Fe-modified biochar, Fe oxy-hydroxides (goethite, ferrihydrite), Fe-doped clays have relatively medium costs while the cost of goethite-modified biochar (BC-Gt) (80–130 $/t) is 10%–20% higher as compared to BC (80–90 $/t) and Gt (70–120 $/t) [52].
Zeolite-, Clay-, and Layered Double Hydroxide (LDH)-Based CompositesZeolite-based materials exhibit promising P removal efficiencies due to their porous structure and ion exchange capacity. A TiO2/zeolite (TZ) composite achieved ~100% P removal at low concentrations, with 12.3 mg P/g adsorption capacity, via electrostatic attraction and surface hydroxyl substitution [53]. Similarly, the hybrid sorbent ZIF-8 (a zeolitic imidazolate framework) demonstrated a monolayer chemisorption mechanism and 12.47 mg P/g sorption capacity, though performance decreased in the presence of carbonate ions [54]. Compared to ZIF-8, ZIF-67 showed significant reusability maintaining over 90% efficiency after six adsorption–desorption cycles [55]. These results suggest that zeolite-based materials not only offer effective adsorption but also have high regeneration potential.
Modified natural zeolites such as Ca (OH)2-treated zeolite (CaT-Z) demonstrated strong inner-sphere complexation (ligand exchange) and higher binding efficiency in human urine than raw zeolites. CaT-Z achieved up to 11.11 mg P/g and enabled partial P recovery via sequential desorption [56]. MgO/iron-oxide modified NaY zeolite (MNZ) further enhanced simultaneous ammonium and P removal through struvite precipitation, reaching 105.95 mg P/g and suggesting potential application in slow-release fertiliser [57].
Calcined layered double hydroxide (LDH) nano-composites exhibited P adsorption capacities exceeding 100 mg/g, primarily through ion exchange, while regeneration with NaOH induced a dissolution–reprecipitation process that facilitated LDH recrystallization. Ammonia-based regeneration facilitated struvite crystallization and produced slow-release fertilisers with enhanced P bioavailability [58]. LDH-modified biochars have also emerged as promising sorbents. Yang et al. (2019) [59] prepared Zn/Al-, Mg/Al-, and Ni/Fe-based LDH–biochar composites via co-pyrolysis, achieving adsorption capacities up to 152.1 mg P/g through interlayer anion exchange and surface complexation. P removal efficiency was affected by pH and the presence of other anions in the solution. Zhang et al. (2022) [60] further demonstrated efficient P removal from real secondary wastewater using similar LDH–biochar composites (Zn–Al, Mg–Al, and Mg–Fe LDH/BC), with capacities between 35.2 and 55.8 mg P/g. When applied as fertilisers, Mg– and Fe–based LDH/BCs promoted crop growth more effectively than Zn–based materials, linking P bioavailability and physiological impact on crops.
Finally, a clay–polymer composite membrane incorporating polyvinylidene fluoride (PVDF) demonstrated potential as an emerging clay–polymer sorbent, achieving P uptake of 0.75 mg/g within six hours due to porous and heterogeneous structure [61]. Although current performance is limited, further optimisation could enhance its applicability.
Natural zeolites and clays (e.g., bentonite, kaolin) as well as calcium-rich natural sorbents such as marl, travertine, and opoka, are geologically abundant and require only mining and minimal processing (crushing, washing). This contributes to near-zero costs and minimal CO2 footprint [62,63]. These calcium-based materials have also demonstrated high phosphorus removal efficiencies (often >90%), which can further increase after thermal modification [63]. LDHs and many modified clays exhibit excellent regenerability (often >90% capacity after multiple cycles) using dilute NaOH, which is key to offsetting the initial synthesis cost and maximizing economic life cycle.
All mineral-based sorbents are classified at TRL 3–4, corresponding to the bench-scale proof-of-concept stage. These materials, including La-modified zeolites, Zr-based composites, Fe-based hydrogels, and LDH-derived sorbents, have demonstrated high P removal efficiencies, often exceeding 90%, and substantial adsorption capacities under controlled laboratory conditions. However, the majority of studies have been conducted using synthetic solutions or spiked matrices, with limited validation in real or long-term wastewater treatment scenarios. As a result, despite promising performance, further advancement beyond TRL 4 is limited by the lack of long-term testing, standardised evaluation methods, and validation in real wastewater treatment systems.
A comparative overview of mineral-based sorbents, their removal performance, and operating conditions is presented in Table 1.
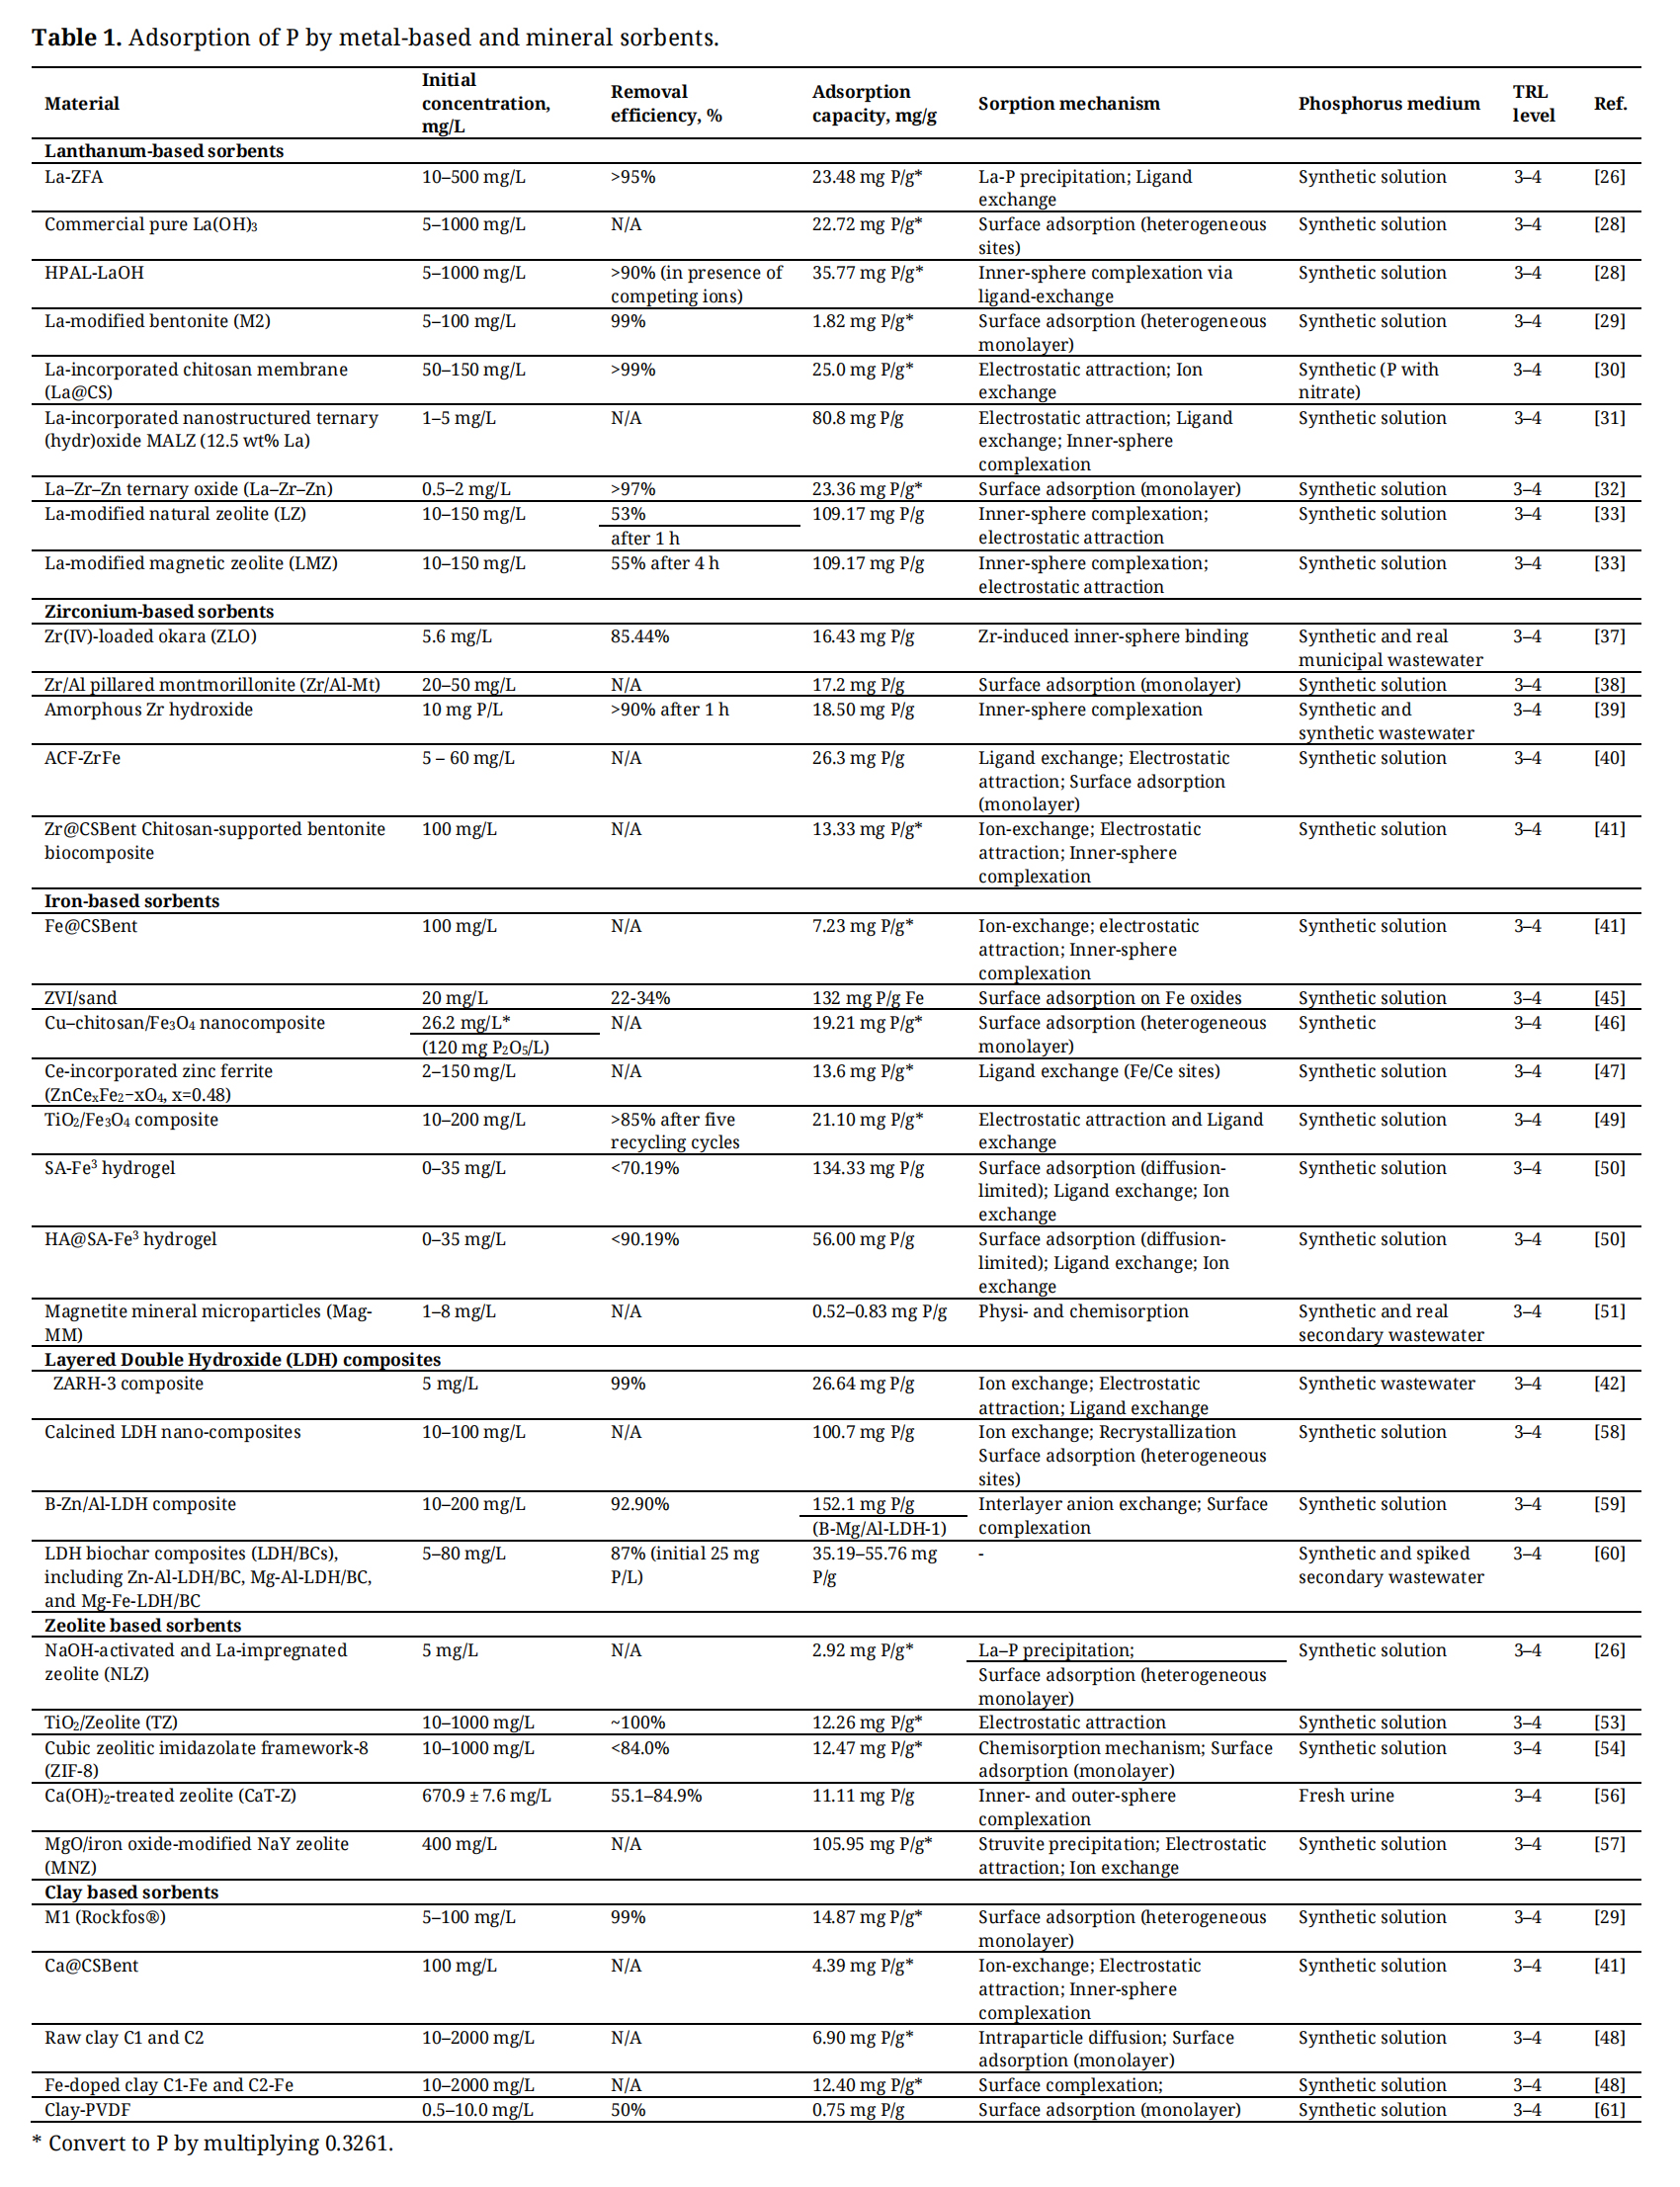 Table 1. Adsorption of P by metal-based and mineral sorbents.
Bio-based sorbents, derived from agricultural residues, shells, and other biological wastes, have gained attention for phosphate removal due to their low cost, renewability, and reuse potential. For this review, materials are grouped as biochars, modified agricultural wastes, natural and calcined shells, and calcium-doped sorbents. Though both biochar production and calcination involve heat treatment, their conditions differ: biochars are produced at 300–800 °C under limited oxygen, while calcination occurs in oxygen-rich environments at 800–1000 °C. Biochars, rich in carbon and oxygen, are commonly reused as fertilisers or soil amendments, especially when enriched with phosphorus. In contrast, calcined products are better suited for industrial applications due to their higher reactivity and precipitation potential.
BiocharsVarious biological waste materials may be utilised for production of bio-charcoal or shortened biochars including orange tree trunks [64], tea tree twigs [64], chemically modified tea waste [65], corn straw [66], soya bean stover [67], crawfish [68], pomegranate peel [69], litchi seeds [70], eggshells [71], oyster shell wastes [72], rice straw [73], palm fibres [74], sawdust [75], tobacco straw [76], walnut and almond wooden shell waste [77], bagasse [78] etc. Biochars may be used as fertilisers [66,79,80], which also decrease greenhouse gas (GHG) emissions, and immobilise heavy metals and organic contaminants [80,81].
Biochars are typically produced by pyrolysis of biomass in oxygen-limited or anoxic conditions at 300–800 °C, resulting in carbon-rich materials [78,79]. However, natural or untreated biochars have limited capacity to adsorb anionic species such as P [70,73,75]. Therefore, chemical or thermal modifications are essential to enhance P affinity. These modifications improve surface area, introduce active sites, and facilitate mechanisms such as ion exchange and ligand exchange [82]. Pretreatment often involves impregnation with metal salts like FeSO4, MgCl2, or AlCl3 [64,66,83], with pyrolysis enhancing the structure and porosity of the final product. The P adsorption capacity increases in the following sequence: raw biowaste > biochar > modified biochar.
Surface area plays a critical role in adsorption efficiency and may increase by up to 200 times after modification [84–86]. However, surface area can also decrease at excessively high pyrolysis temperatures, reducing efficiency. For example, Liu et al. (2015) [66] reported that increasing pyrolysis temperature from 400 °C to 700 °C reduced phosphate removal due to lower surface area.
Recent studies have demonstrated promising performance of advanced modified biochars. Granular iron biochar (GIB) and ball-milled iron biochar (PIB) achieved surface areas of 385 and 331 m2/g, respectively, and removed phosphate up to 16 times more efficiently than sand filters. PIB also demonstrated fast adsorption kinetics (0.144 min−1) and suitability for fertiliser reuse [87]. Similarly, ball-milled calcium-loaded biochar (BMCa@BC), synthesised from CaO and corn stover, achieved exceptionally high capacity of 329 mg P/g via hydrogen bonding, complexation, and surface precipitation mechanisms. The recovered phosphate showed high bioavailability (86.7%) and stable performance over five regeneration cycles [88].
These modifications not only increase surface area but also introduce or enhance functional groups that facilitate specific P-binding mechanisms. For example, crawfish-derived biochar pyrolyzed at 600 °C demonstrated P removal via both P adsorption primarily through ion exchange with hydrolysis products (H2PO4−, HPO42−) and precipitation with dissolved calcium ions [68].
P adsorption increases with increase of temperature of the solution [67,73]. At 25 °C, P primarily showed physical adsorption (bound with biochar as exchangeable P) while at 35 °C chemical adsorption occurred [89]. The value of pH was identified as the most important parameter for adsorption [68–70].
The pH level of the solution significantly influences both the surface charge of the adsorbent and the chemical forms of the contaminant [71,75,76]. The phosphate species present in the solution are different in different pH values, thus affecting the adsorption. H3PO42− is present in lower pH (<2.15), H2PO4− at pH values from 2.15 to 7.20), HPO4 at neutral to high pH (7.20 to 12.33), and PO43− at pH above 12.33 [75]. The adsorption capacity to biochar is typically low at lower pH levels [65,76].
Adsorption of PO43− significantly increases the presence of diverse metal elements and availability of functional groups [73,76,90]. However, under certain conditions such as redox or acidic environments, these ions may be released into aqueous solutions, posing potential toxicity to the water environment and aquatic organisms [91].
To enhance adsorption P capacity, biochar is often modified (e.g., with FeCl3, Mg, lanthanide or Ca salts). The LCA accounts and environmental impact associated with the production and use of the biochar adsorbents reach a high price (80–90 $/t), depending on the quality, activation method, and intended market [52].
Modified Agricultural WastesSeveral studies have demonstrated that various agricultural wastes, when chemically modified or iron-loaded, can serve as efficient sorbents for P removal and recovery from wastewater [65,69,70,77]. For instance, walnut and almond shell wastes enhanced with quaternary ammonium groups achieved maximum P adsorption capacities of 22.73 mg/g (modified walnut wooden shells) and 14.71 mg/g (modified almond wooden shells, MAWS) [77]. Under optimal pH conditions (4–5 for MWWS and 4–6 for MAWS), P removal efficiencies improved from 46.25% to 53.5% and from 59.5% to 70.75%, respectively. However, higher pH levels reduced removal due to diminished electrostatic attraction and increased competition with OH− ions. Additionally, the spent sorbents could be reused at least four times, ultimately serving as fertilisers to increase plant-available P.
Similarly, the amine cross-linking of spent tea leaves (ACTW) elevated its phosphate removal efficiency and maximum sorption capacity to 98.72 mg/g [65]. Increasing the ACTW dose from 0.4 to 2 g/L raised the phosphate removal from 45.3% to 92.3%, highlighting the influence of sorbent dosage on both adsorption efficiency and the availability of active sites. Both of these modified sorbents rely on electrostatic attraction and ion exchange, emphasising the importance of positively charged functional groups in binding negatively charged phosphate ions.
Iron impregnation further enhances P removal. Iron-loaded lychee (Litchi chinensis) seed wastes, both raw (FeRLW) and charred (FeCLW), achieved maximum adsorption capacities of 96.5 mg/g and 100 mg/g, respectively, within a pH range of 4–6 [70]. Similarly, iron-loaded pomegranate peel (IL-PP) exhibited improved phosphate removal efficiency as pH rose from 3 to 9, increasing from 43.5% to 64.25%. This enhanced performance arises from the greater variety of possible interactions between Fe3+ and HPO42− at higher pH [69]. The presence of Fe2+/Fe3+ provides additional active sites, facilitating robust phosphate capture through both electrostatic attraction and chemisorption mechanisms.
Modifications of agricultural wastes underscore the importance of tailoring adsorbent properties, such as surface chemistry, charge, and functional group density to enhance P uptake. By optimising pH conditions, adjusting sorbent dosage, and selecting appropriate modification techniques, these bio-based materials can achieve high adsorption capacities, maintain efficiency over multiple cycles, and facilitate P recovery for agricultural reuse.
Utilising agricultural and forestry waste (e.g., wood chips, rice husk) avoids landfilling and incineration, resulting in an LCA credit by mitigating associated GHGs and land-use impacts. The major cost driver is the energy used for thermal/chemical activation [92]. The spent, P-saturated agricultural waste material (e.g., wheat straw) is often viewed as a valuable slow-release P fertiliser or soil amendment [93].
Natural Calcium Containing Materials and Calcined ShellsSeveral studies (Feng et al. (2022) [76], Park et al. (2018) [68], Xu et al. (2023) [75]) indicated that Ca-modified (calcinated) biochar favoured P adsorption. The ability to adsorb P may also be attributed to the adsorbent particle size, pore volume and specific surface [75]. Smaller particle size is usually an indicator for larger specific surface area.
The temperature for production of adsorbent is crucial for later ability for P adsorption. When pyrolysis temperature increased from 700 °C to 900 °C, P adsorption amounts significantly increased [68,73,75,94]. This is because at 900 °C the amount of calcium is significantly higher than at 700 °C, but the amount of carbon is lower [68]. After pyrolysis at ≤700 °C Ca is in the form of calcite (CaCO3); at 800 °C lime (CaO), portlandite (Ca(OH)2), and calcite; at 900 °C CaO and Ca(OH)2 [71,75]. CaO and Ca(OH)2 are more prone to forming precipitates with P than CaCO3 [68,75]. At higher pyrolysis temperatures the primary mechanism was precipitation between dissolved calcium in CaO and Ca(OH)2 and PO43− [68]. Changes in treatment temperature affect the point of zero charge [94].
The adsorption capacity to biochars is typically low at lower pH levels [76]. However, calcined biochars tend to indicate minor decrease in adsorption of P [68,75,76]. This is because calcined biochar has a large amount of Ca(OH)2 on the surface leading to the increase in pH of the solution—due to acid-base neutralisation reaction between the OH− of Ca(OH)2 and H+ of the solution. This reaction affects chemical precipitation in phosphate solution with pH < 7 [68,76]. However, an excessive amount of calcium could potentially diminish the adsorption sites available on the adsorbent [75].
In both natural water and wastewater, several common anions have the potential to compete for adsorption sites alongside P. Feng et al. (2022) [76] and Xu et al. (2023) [75] showed that the anions Cl−, NO3−, and SO42− had a minimal impact on the P adsorption. Even at elevated ion concentrations of up to 20 mmol/L for Cl− and NO3−, the P adsorption capacity remained mostly unaffected. However, the presence of HCO3− ions had a strong negative effect on the adsorption of P [75,76]. It is hypothesized that CO32− reacts with Ca2+ from Ca(OH)2 to create a CaCO3 precipitate, which subsequently adheres to the surface, thereby obstructing the phosphate nucleation sites [76].
The material costs on usage of calcined shells as adsorbent is near zero, but the energy cost for calcination must be compared against the savings achieved by avoiding conventional chemicals usage [95]. The unit cost of tertiary P removal using calcined adsorbents remains high, largely due to the elevated temperatures required for pyrolysis during adsorbent preparation [92,95].
Calcium-Doped MaterialsSeveral studies indicate that incorporating calcium often in the form of Ca(OH)₂ or CaCO₃ into sorbent materials can significantly enhance P removal and facilitate subsequent P recovery. For example, Antunes et al. (2018) [94], Wang et al. (2018) [96], and Pérez et al. (2022) [97] demonstrated that when calcium is incorporated into biochar or biocomposite matrices, it facilitates the formation of stable calcium-phosphate (Ca-P) precipitates such as brushite (CaHPO4·2H2O), monetite (CaHPO4), and/or hydroxyapatite (Ca5(PO4)3(OH)), and improves the overall performance in wastewater treatment. Among calcined materials the highest adsorption results were obtained with a Ca-flour biochar resulting in adsorption capacity of 314.22 mg PO4/g due to the formation of hydroxyapatite crystal [96].
Bio-based materials and food byproducts offer a sustainable and versatile solution for P removal and recovery from wastewater. Agricultural residues, biosolids, shells, and plant-based wastes can be processed into biochars or modified sorbents that remove P through ion exchange, ligand exchange, complexation, and precipitation [65,69,70,77]. Sorbent performance is often enhanced by metal salt treatments or calcium doping, which facilitate stable Ca-P phase formation and improve efficiency [94,97].
While lab and pilot-scale results are promising, few studies have tested these materials in real wastewater or surface waters [66,72,76]. The limited data available indicate that bio-based sorbents can function effectively under practical conditions, broadening their applicability beyond synthetic solutions. Furthermore, one of the key benefits of bio-based P sorbents lies in their end-of-life valorisation. After adsorption, P-loaded biochars and modified wastes can be applied to soil, enhancing fertility and crop productivity, and reducing dependence on non-renewable phosphate rock [66,72,77].
Utilising Ca-rich waste (e.g., eggshells, oyster shells) assigns the environmental burden to the primary industry, offering an LCA credit and avoiding CO2 emissions [98]. The cost is competitive against conventional tertiary P removal methods, as the major input is cheap waste material [92]. The dominant economic factor is the energy cost of thermal treatment needed to generate reactive CaO.
The bio-based sorbents, including Ca-doped biochars, modified tea waste, calcined eggshells, are predominantly positioned at TRL 3–4. This category exhibits the highest reported P adsorption capacities across all reviewed materials, with values reaching up to 329 mg P/g for ball-milled Ca-loaded biochar. Despite their high adsorption performance, most investigations remain limited to laboratory-scale proof-of-concept studies using synthetic solutions. Only a small number of studies employed real wastewater matrices such as rural sewage, pond effluent, or agricultural runoff, and these were typically short-term or batch-based rather than sustained pilot-scale operations. Consequently, the absence of long-term field validation and continuous system operation prevents advancement to TRL 5. Current research efforts are primarily focused on improving binding efficiency, regeneration performance, and end-of-life valorisation pathways, particularly the reuse of P-saturated sorbents as soil amendments or slow-release fertilisers.
A comparative overview of bio-based materials, their removal performance, and operating conditions is presented in Table 2.
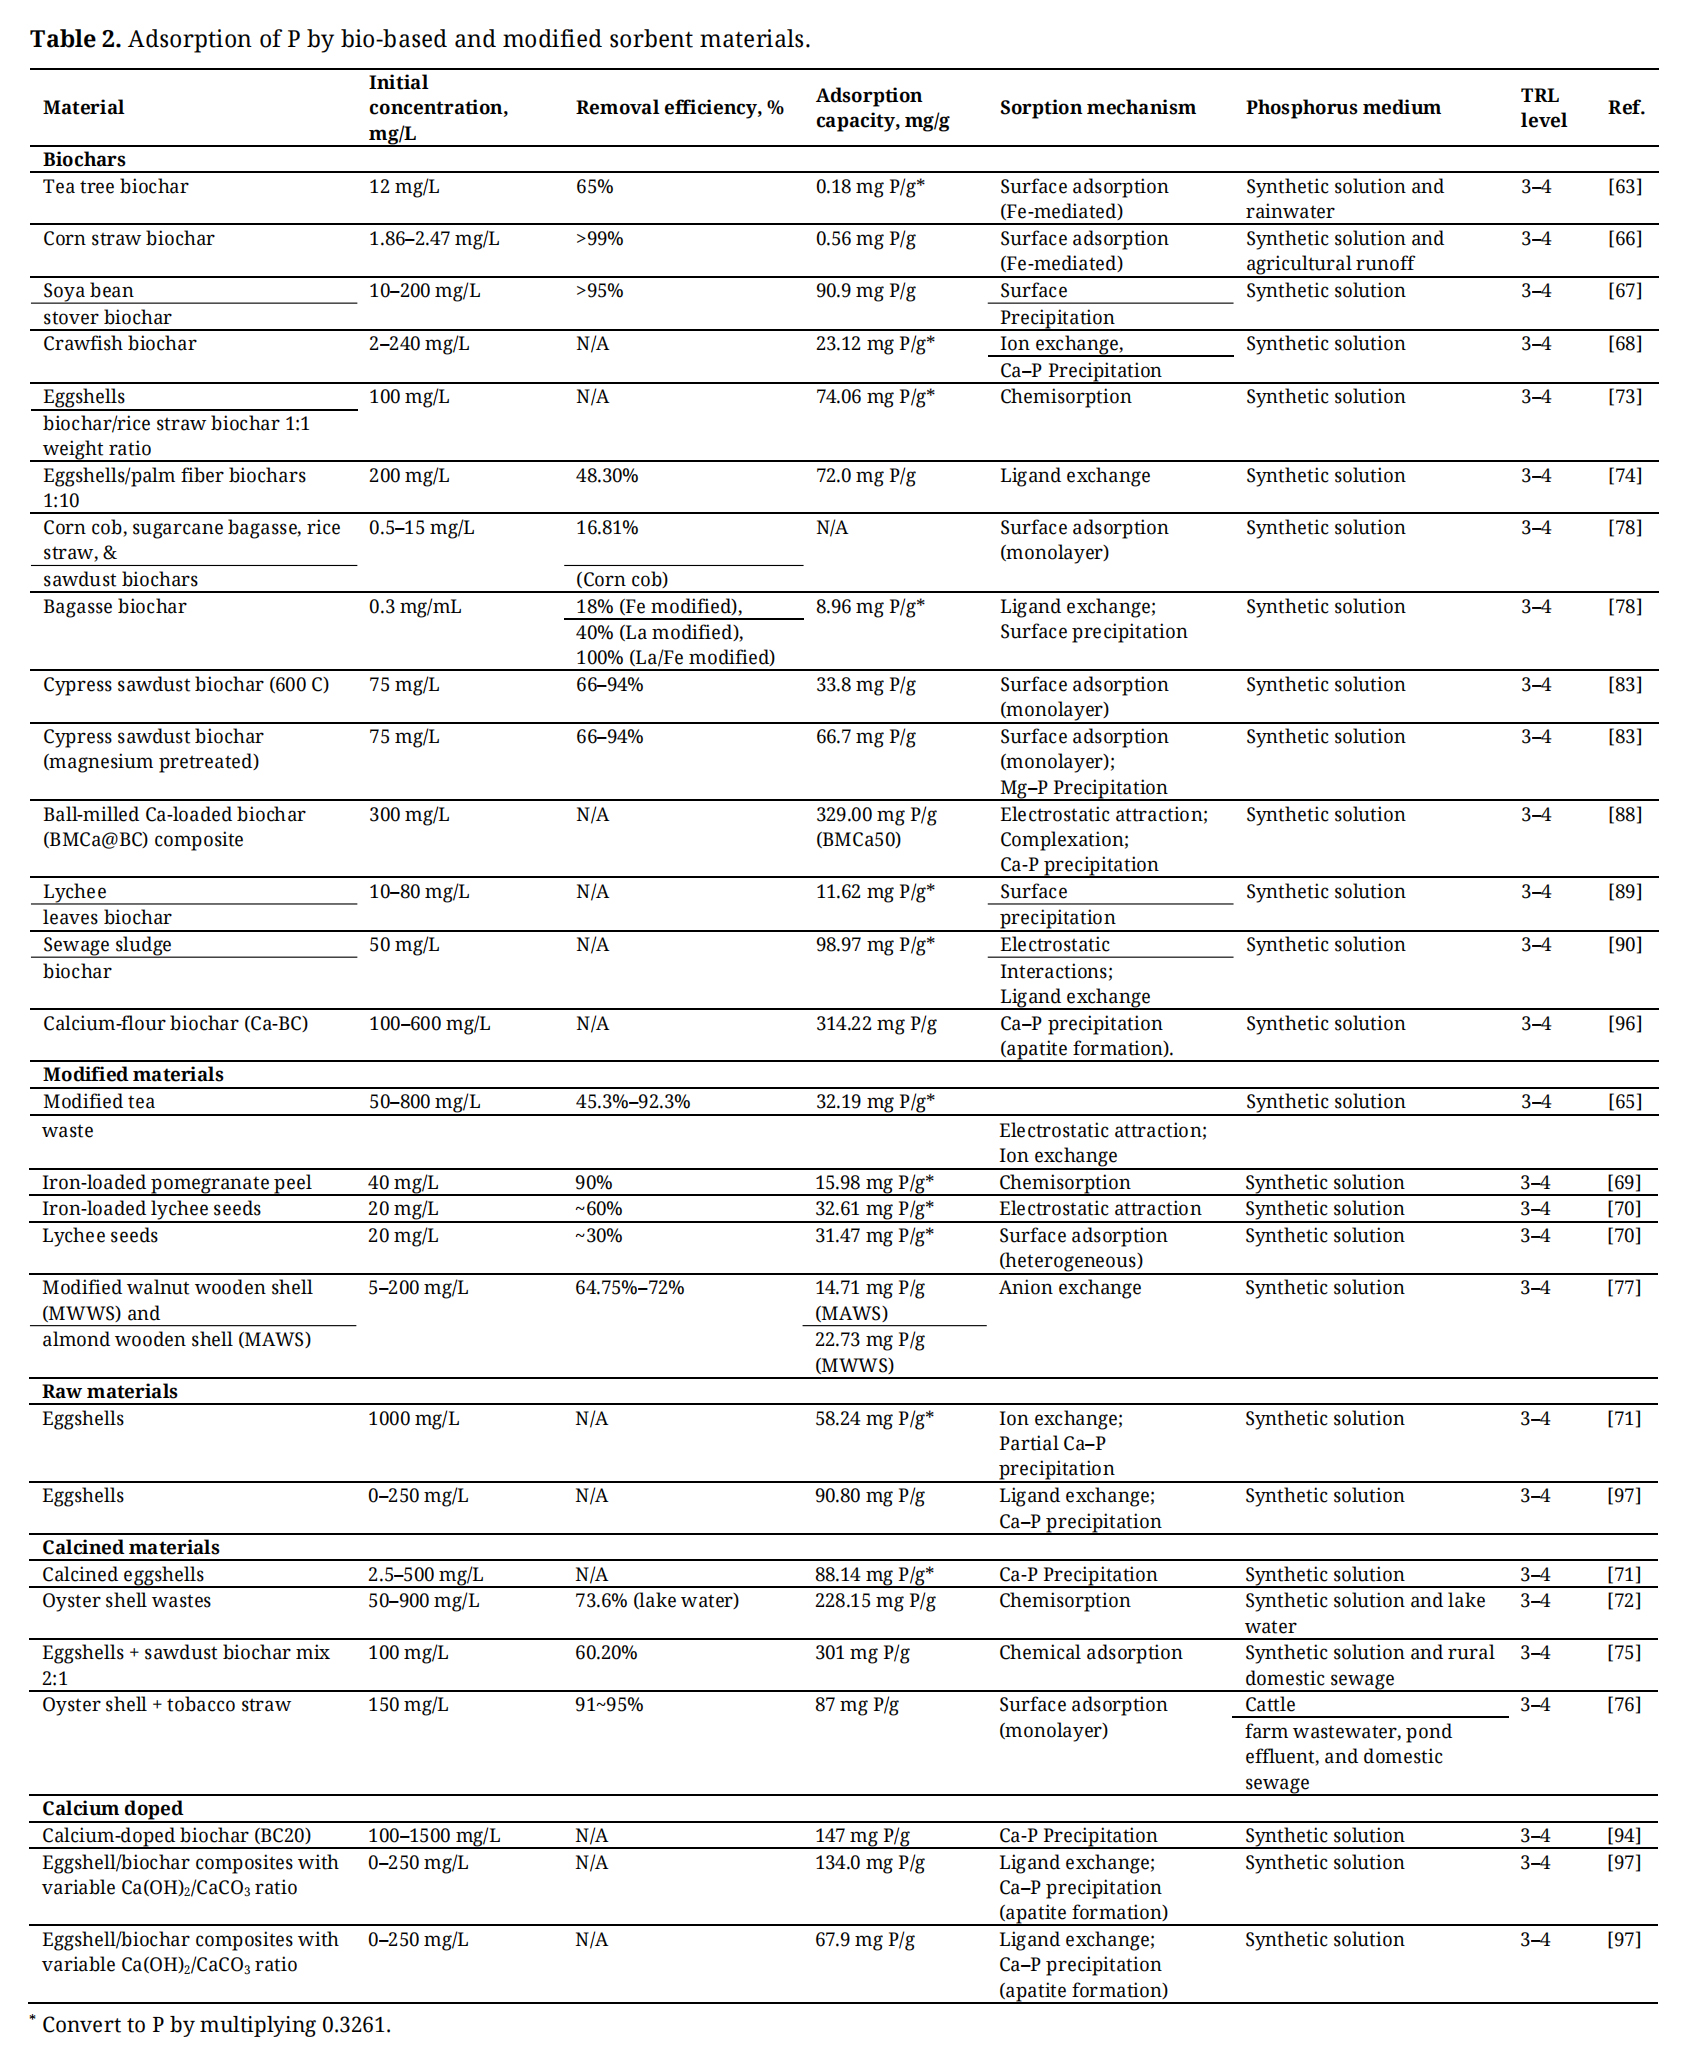 Table 2. Adsorption of P by bio-based and modified sorbent materials.
Industrial by-products such as slags, ashes, mining residues, and cement-based materials have attracted attention for phosphate removal due to their abundance, low cost, and chemical composition rich in calcium, magnesium, iron, or aluminium oxides. These materials often possess large surface areas, alkaline pH, and reactive functional groups that enable phosphate binding through mechanisms including precipitation, adsorption, ion exchange, and complexation. Their applicability depends not only on sorption capacity but also on factors such as material availability, mechanical stability, pretreatment needs, and potential for P recovery or reuse. While a wide variety of industrial residues have been studied, the most commonly investigated are slags, fly ash, biochar, hydrochar, and bauxite residues. Materials containing organic matter (e.g., sewage sludge, wood waste) are often first pyrolyzed into biochar to improve handling and minimise contaminants. Overall, industrial waste materials represent a promising resource for sustainable P removal, as long as practical limitations such as environmental safety, processing needs, and material longevity are adequately addressed.
SlagsBlast furnace slag, a byproduct of iron production with global output over 1600 million tonnes annually [99], is widely used in concrete production [100]. Due to its alkaline properties and high CaO content (~35%), slag can effectively adsorb phosphate from wastewater, primarily via calcium phosphate (Ca–P) precipitation [101,102]. Although slag’s leachability may raise environmental concerns [99], its chemical composition also supports its use in nutrient removal.
Slags are categorised into basic oxygen furnace, blast furnace, and electric arc furnace types, with some variation in CaO, SiO2, and MgO content [103]. Despite these differences, they are often studied collectively due to similar P removal mechanisms. Numerous studies [101,102,104–106] have confirmed slag’s P sorption performance, with Johansson and Gustafsson [102] reporting over 50% of P removed as CaPO4 at a Ca:P molar ratio of 2.9–4. In addition to Ca–P precipitation, adsorption and formation of CaCO₃ may also contribute to P removal under high-pH conditions.
Batch tests demonstrated 0.1–0.6 mg P/g capacity with 90–100% removal [102], aligning with Westholm (2010) [105], who observed 25–100% retention in batch and 86–100% in column systems using influent concentrations of 5–25 mg PO4-P/L. Later studies further explored mechanisms using column setups, indicating that CaCO3 formation at lower pH may reduce adsorption efficiency [101,104,106]. To improve performance, Zhang et al. (2024) [106] mixed slag with rice straw and red soil to form biofilters with lower pH and higher microbial activity, enhancing plant uptake of sorbed P. Similarly, Barca et al. (2014) [101] and Wu et al. (2021) [107] developed composite materials from slag and expanded silica. These aggregates demonstrated significantly higher P adsorption capacity (4.2 mg/g) due to combined Ca–P precipitation and microporous adsorption, supported by the presence of aluminium in silica. An important operational factor is the slag’s age, as younger slag exhibited better P removal and reduced risk of prior leaching [105]. These findings highlight slag’s viability for sustainable P removal, particularly when optimised through material combinations or conditioning.
When slags are exposed to air or CO2 (carbonisation), Ca sequesters CO2 by forming stable carbonates, offering a net CO2 reduction benefit to the treatment process, described by Bobicki et al. [108]. Regarding LCA, slag typically requires only minimal treatment, i.e., crushing and sieving, to be utilised as a filter medium. This mechanical treatment has a significantly lower energy and CO2 footprint compared to the high-temperature thermal activation (calcination or pyrolysis) required for biochar or certain fly ash adsorbents. Costs are restricted almost entirely to collection, crushing, and transportation with costs of typically 10–50 $/t, depending on transport distance. This is significantly lower than virgin commercial adsorbents like granulated activated carbon (1750–6401 $/t) [109].
Oil Shale AshThe already proven high P-binding capacity of materials containing Ca-, and Al compounds, with a porous structure and alkaline pH, presents an opportunity to study similar materials for such an approach. Such material is also oil shale ash studied by Kaasik et al. [110] and originated as solid waste from burning organic-rich sediment oil-shale in Estonia with annual waste production 5–7 million tonnes [110]. Material is highly calcareous, rich with CaO and CaSO4 and after exposure to environmental conditions and presence of water is also forming hydrated ash containing different secondary Ca-minerals. Similarly to slag also for oils shale ash dominates Ca-P precipitation (both Ca-phosphate and its hydrated form) then following by precipitation of CaCO3, but in hydrated ash there can be recognised also the third phase—reactions of Al in minerals (Ca-(aluminate)-sulphate-hydroxide) [110]. Batch experiments with different particle sizes demonstrated that adsorption on the surface, although existent, still has minor influence on total P sorption capacity. Another aspect similar to slag is lower P sorption with lower used concentration with not clearly trackable sorption mechanism. The opposite is happening for high P concentrations, where removal effectiveness reaches 67–85% and the sorption mechanism can be described using the Freundlich equation. Another study with oil shale ash performed by Kõiv et al. [111] applied in field experiments also confirmed high P retention capacity for systems (vertical and following horizontal filter) filled with oil shale ash (68.9–82.4%), although if using only horizontal filter P retention capacity increases up to 85.4–99.2%. It was found that significantly higher rates of Ca-P precipitation occur when TP concentration in water is above 0.5 mg/L, while in smaller TP concentrations the most probable mechanism for removal is adsorption [111]. The inconsistency of tracking adsorption in above-mentioned examples and its lower P retention capacity can be explained by competing agents such as organic inhibitors and other ions found in wastewaters.
P binding capacity for hydrated ash sediment has been considered high, up to 65 mg P/g [110,111]. Studies show that incorporating oil shale ash into filters can significantly reduce environmental impact (CO2, CH4, and N2O emissions) compared to traditional filter media (e.g., peat) [112]. Ash is a cost-effective alternative to commercial filter media or the high operational costs associated with conventional chemical precipitation (which requires continuous dosing of expensive chemicals like ferric sulphate or Al-salts). The cost is largely restricted to processing, transport, and filter construction, rather than material costs, being an economic advantage in regions with local ash abundance (e.g., Estonia and Jordan). The spent ash filter material, saturated with Ca-phosphate, can potentially be reused as a P fertiliser source in agriculture, creating a circular economy benefit that offsets the final disposal cost [111].
Fly AshCoal combustion by-products, including fly ash and bottom ash, are generated in vast quantities worldwide (~750 million tonnes annually) and have demonstrated potential for P sorption [113]. Xu et al. (2022) [114] reported an adsorption capacity of 1.8 mg P/g for unmodified fly ash, which increased to 10.8 mg P/g after La modification, as the BET surface area increased by a factor of 10.9. This modification also induced the formation of spherical zeolite clusters, shifting the sorption mechanism toward surface adsorption. Further improvements in fly ash performance have been achieved through chemical treatments. Zhou et al. (2019) [113] used sodium dodecyl sulphate (SDS), identifying optimal SDS concentrations of 4% for fly ash and 6% for bottom ash to enhance P uptake by reducing surface tension. In the absence of Ca–P precipitation, sorption mechanisms generally follow Freundlich or Langmuir isotherms.
Fly ash-based composites with lime, clay, or organic amendments have shown improved P capture and structural stability. Li et al. (2017) [115] developed pellets combining fly ash (60%), lime (30%), and clay (10%), achieving high porosity (14%) and P sorption capacity of 1.98 mg/g, with rapid adsorption reaching up to 80% removal within 15–28 min. Sorption was attributed to surface interactions with calcium, iron, and aluminium hydroxides, fitting the Langmuir–Freundlich model. Other hybrid approaches include combining fly ash with woodchips [116] and oyster shells [117]. While P sorption in fly ash–woodchip mixtures was limited under low P concentrations, retention rates were still adequate. In contrast, Jeong et al. (2022) [117] reported a P retention efficiency of 88.4% for oyster shell–fly ash composites over a 120-day period, demonstrating the potential for long-term application. Singh et al. (2022) [118] emphasised fly ash’s versatility, not only in P removal but also for capturing other pollutants in wastewater. Notably, sorption efficiency generally improves with higher initial P concentrations.
The primary environmental benefit of fly ash arises when it displaces energy-intensive manufactured materials, notably Portland cement. LCA highlights that while geopolymer production (a pathway similar to creating high-capacity P adsorbents) avoids massive clinker CO2 emissions, the production of chemical activators (like Na2SiO3) and the energy/heat treatment become the dominant factors determining the final environmental footprint [119]. Some highly effective treatments, such as geopolymer fly ash (GPFA), involve heating the ash/alkali mixture to high temperatures (e.g., 600 °C) [120]. The energy consumed during this thermal step and the CO2 emitted from the corresponding electricity/fuel consumption represent the major LCA hotspot. Treatment with strong chemicals (e.g., NaOH, HCl) or incorporation of specific metals (e.g., La-modified fly ash, which can reach Qmax of 8.89 mg/g) introduces the environmental impact associated with the production of those chemicals [120]. Utilising fly ash as a supplementary cementitious material (SCM) or geopolymer precursor, which are common pathways for fly ash utilisation, results in a significant reduction of GHG emissions, typically ranging from 42% to 64% compared to OPC production. This saving is attributed to avoiding the high-temperature calcination process (>1500 °C) required for clinker production [119].
BauxiteBauxite residue, a by-product of alumina extraction from bauxite ore with global production reaching 150 million tonnes annually, has attracted attention for P sorption due to its high content of Fe2O3, Al2O3, SiO2, and CaO [121,122]. Because of its strongly alkaline pH (11–13), various neutralisation techniques have been explored, including gypsum and seawater [123]. Cusack et al. (2018) [122] reported P adsorption capacities of 0.38 mg/g for untreated bauxite residue, 0.48 mg/g with seawater treatment, and 2.46 mg/g using gypsum, with finer particles showing better performance. Among the influencing factors, CaO content exhibited the strongest correlation with P sorption, followed by pH. Barca et al. (2022) [124] confirmed this by using carbonated bauxite residue (CBR), observing increased adsorption from 0.2 to 3.9 mg P/g as initial P concentrations rose from 10 to 200 mg P/L. At low concentrations, P removal occurred through adsorption, while at higher concentrations, calcium phosphate precipitation dominated. Although seawater can adjust pH, its limited availability and the resulting increase in salinity may restrict agricultural reuse [122]. Li et al. (2019) [125] suggested that mixing bauxite residue with organic amendments can mitigate pH and EC fluctuations for soil application.
Red mud, a form of bauxite residue, can be converted through soda sintering into brown mud, a more stable water treatment agent. While red mud exhibits P adsorption up to 7.1 mg/g, some modified forms have achieved as much as 202.9 mg/g [122,126]. Brown mud has demonstrated even better performance, with sorption capacities reaching 43.1 mg/g [127]. Unlike red mud, brown mud can lower solution pH (2–6), enhancing sorption efficiency. Initially, P adsorption is governed by chemical sorption at low concentrations, shifting toward Ca–P precipitation at higher ones, with the process better described by the Freundlich model [127].
Further development was proposed by Yang et al. (2023) [128], who synthesised a functional biochar (RM-BC) by co-pyrolyzing red mud with walnut shells. The optimised composite reached a maximum P sorption capacity of 15.48 mg/g—higher than either raw red mud or biochar alone. Hematite present in the red mud played a critical role in P removal through Fe–O–P bonding, surface precipitation, and ligand exchange.
The LCA of bauxite residue (BR) use generally finds that the raw material itself has a low environmental cost (often assumed to be 0 kg CO2 kg) because it is a waste product [108]. However, the CO2 footprint is generated during the activation necessary to boost its P adsorption capacity from the low capacity of untreated BR (0.2–2.7 mg P/g) to high capacities (50 to 203 mg P/g) achieved through advanced treatment. Raw bauxite cost on adsorbent could be near 0 €/t whereas highly effective treatments (acid or heat/thermal activation up to 700 °C) significantly increase capital and operating expenses, often deemed expensive and energy-consuming [122].
Other Mining-Derived Adsorbent SourceSeveral mining residues have shown potential for P removal, for example, waste from copper–nickel mining in Botswana. Iron oxide tailings, containing 25.1% Fe₂O₃, and clinker ash, rich in silicon, aluminium, calcium oxides, and SO3, demonstrated adsorption capacities of 1.29 mg/g and 0.29 mg/g, respectively [127]. XRD analysis confirmed the formation of P-bearing minerals, including AlPO4 and Mg2P2O7 in iron tailings, and Ca5PO3(OH)13 and FeP(H4O6) in clinker ash. Interestingly, only the iron tailings facilitated sorption of Ca and Al from wastewater, suggesting greater chemical interaction and potential for regeneration.
Regeneration studies indicated greater durability for iron tailings, with removal efficiencies of 87%, 84%, and 56% across three cycles. In contrast, clinker ash performance dropped more sharply, with efficiencies of 24%, 5%, and 0.6% [129]. Additional research by Christianson et al. (2017) [130] investigated P sorption using iron-rich materials from acid mine drainage, containing 68.4% Fe2O3. Column experiments with low P concentrations (1.39 ± 0.22 mg P/L) showed 58% retention within hours and up to 98% retention after 51 h, with potential for regeneration using 0.5 M NaOH. Similarly, Dobbie et al. (2009) [131] reported that hydrous iron oxides, despite a lower adsorption capacity of 0.065 mg/g, exhibited an estimated lifespan up to ten times longer than other tested sorbents.
Magnesite production waste, rich in magnesium oxide and typically collected through electrostatic separation, achieved removal efficiencies of up to 96% under high P concentrations and extended contact times after calcination, which reduced mass by 42 to 45%. At lower dosages, removal efficiency fell below 65%, whereas a concentration of 1 g/L facilitated struvite precipitation, identified as the dominant P removal mechanism [132]. The precipitation of struvite (MgNH4PO4 6H2O) is a highly efficient method for PO4 recovery, which accounts for approximately 85% of the total P content in the source material. Nättorp et al. [133] determining the specific recovery cost to be in the range of 4 to 10 €/kg of recovered P.
Alum sludge, a by-product of water treatment plants, has also been explored as a sorbent. Duranceau and Biscardi (2015) [134] tested dried alum sludge in column experiments with surface water containing less than 200 µg P/L, achieving an adsorption capacity of 6.94 mg/g and 51% retention. Similarly, Babatunde and Zhao (2010) [135] reported adsorption capacities ranging from 10.2 to 31.9 mg/g, highest at pH 4, and confirmed that sorption followed the Langmuir model. Minor aluminium leaching was observed during the initial three weeks. The mechanism was attributed to surface exchange reactions, followed by other interactions once functional sites were saturated.
Industrial Waste ProductsIndustrial waste materials rich in calcium, such as dolomite powder generated during quarry processing (blasting, grinding, and sieving) and concrete waste, have been explored for P removal. Dolomite powder exhibited relatively low sorption capacity (0.025–0.072 g PO4/g), which improved with higher P concentrations and longer contact time. Regeneration was possible using water or weak acids, though strong acids caused material loss [136]. Cement-based materials demonstrated high P removal efficiency, with cement mortar achieving up to 10.1 mg P/g (30.96 mg PO4/g) and over 94% removal across a wide concentration range. Their sorption capacity correlated positively with the total content of Al2O3, Fe2O3, and CaO, and was primarily attributed to precipitation mechanisms, complemented by weak physical interactions [137]. In addition, Egemose et al. (2012) [138] highlighted the applicability of these materials in systems like sedimentation ponds and subsurface flow treatments.
One of the main challenges in using Ca-based materials is their tendency to raise the initial pH of treated water up to 12, which, while enhancing P retention, leads to a significant decline in efficiency as the pH decreases. Additionally, the high variability in composition and particle size among different material types complicates their standardisation and consistent performance [137].
A comparative overview of industrial by-products, their removal performance, and operating conditions is presented in Table 3.
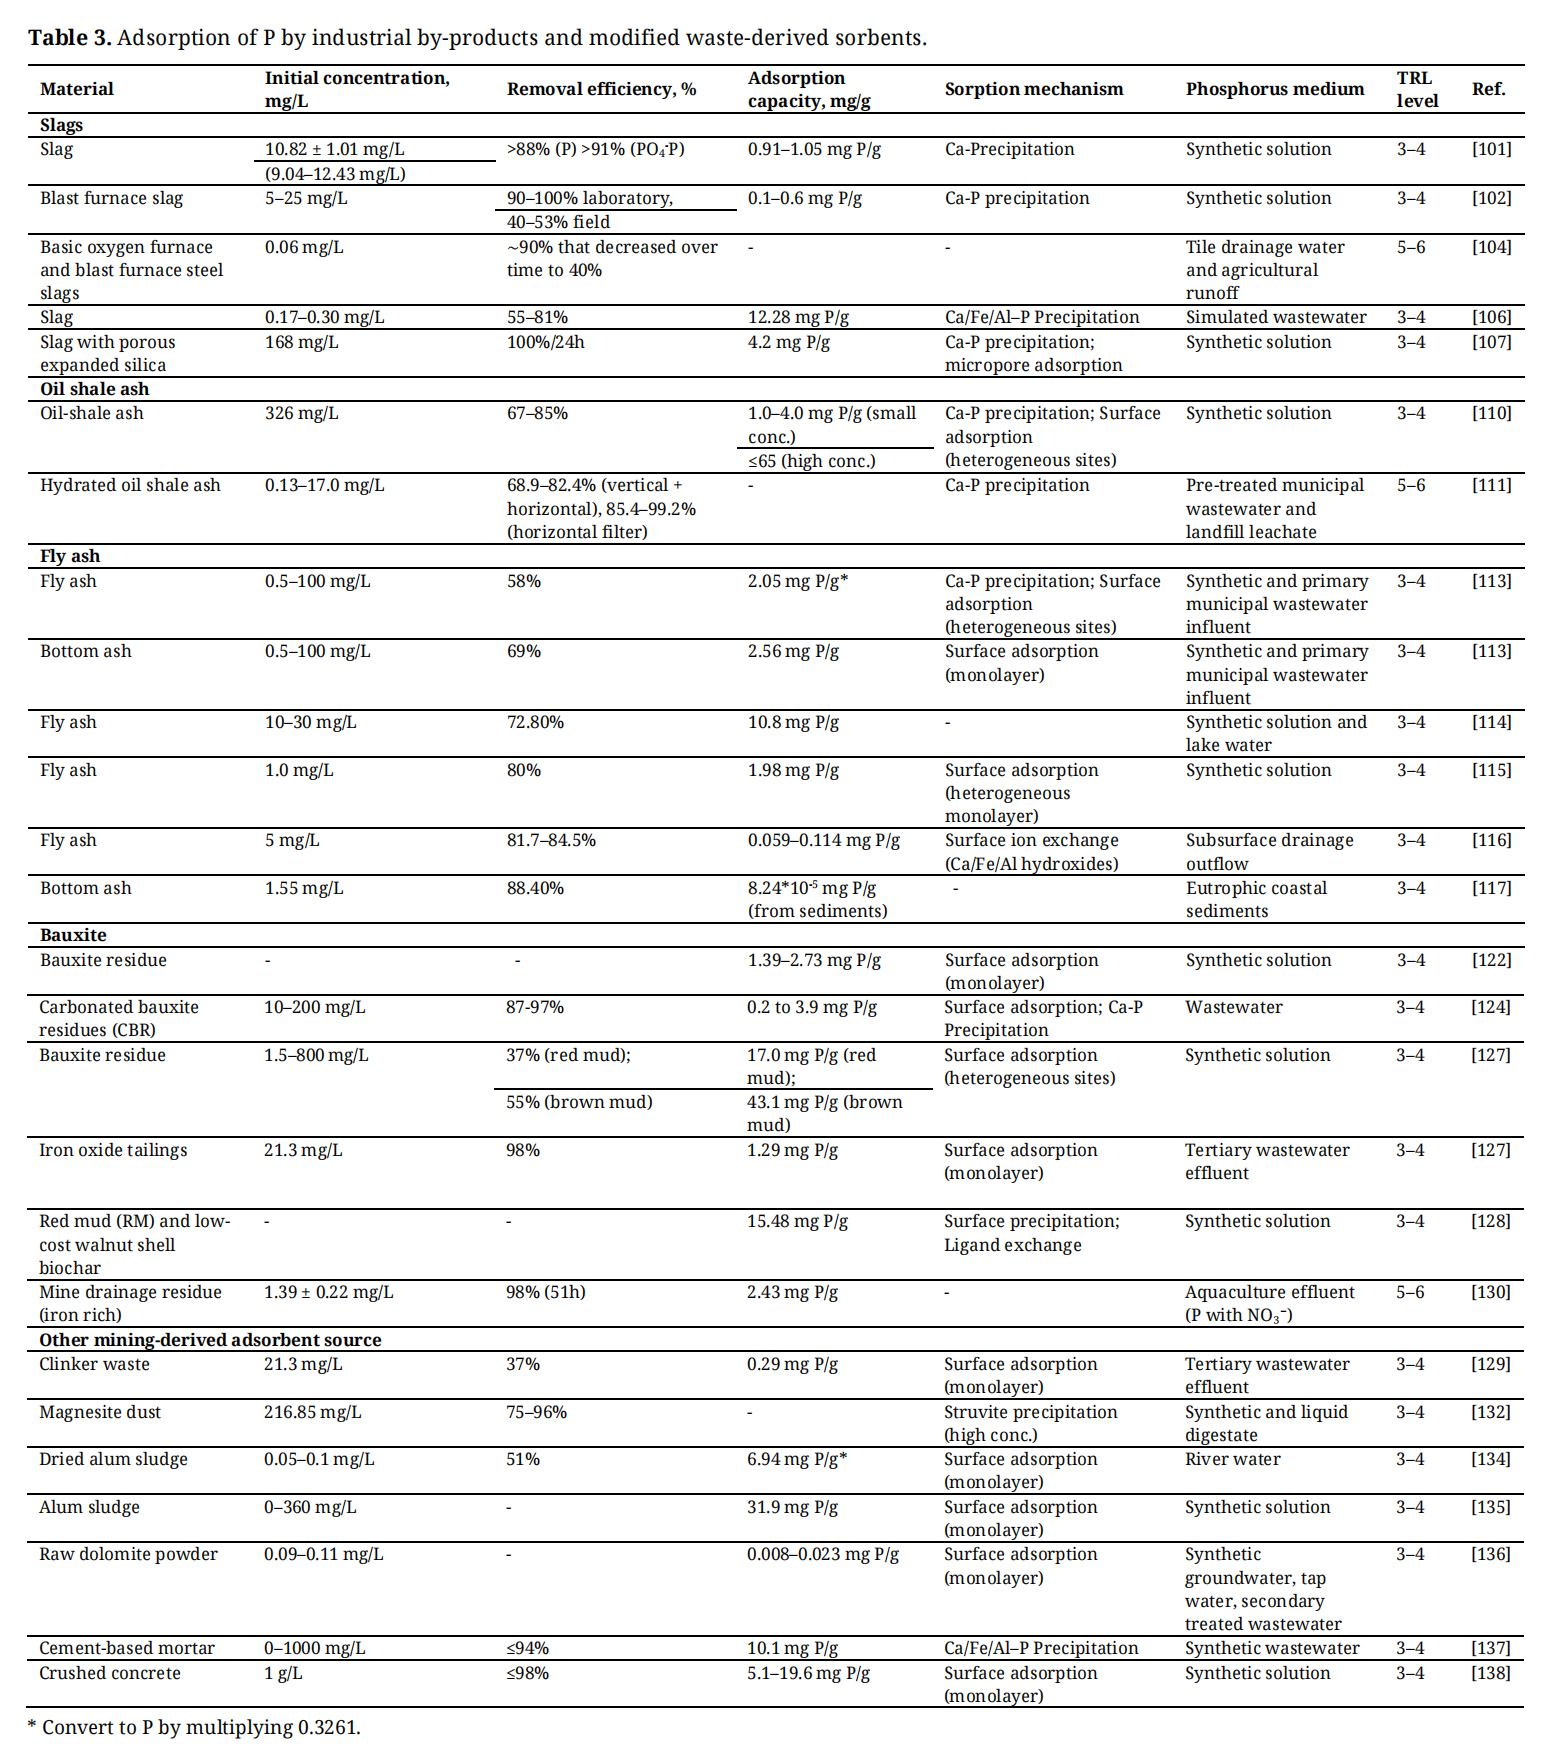 Table 3. Adsorption of P by industrial by-products and modified waste-derived sorbents.
Industrial by-products presented exhibit the widest range of technology maturity, spanning from TRL 3–4 to TRL 5–6. While many materials such as fly ash, bauxite residue, crushed concrete, and alum sludge remain at TRL 3–4 due to laboratory-scale evaluation, several Ca- and Fe-rich residues have progressed to higher maturity levels. Specifically, steel slags, oil shale ash, and mine drainage residues have reached TRL 5–6 through validation in pilot-scale or field-based systems operated with real wastewater or drainage flows. Steel slags have been tested under agricultural runoff and tile drainage conditions, oil shale ash has demonstrated high P retention in vertical and horizontal filter systems treating municipal wastewater and landfill leachate, and Fe-rich mine drainage residues combined with woodchips have shown stable performance during extended aquaculture effluent treatment. These materials are considered more technologically mature because they have been evaluated under operationally relevant conditions, demonstrating feasibility for scale-up despite variability in long-term performance. However, further advancement toward widespread WWTP integration is constrained by material heterogeneity, environmental safety considerations, and standardisation requirements.
This comprehensive review highlights the potential of sustainable sorbent materials for P removal and recovery from wastewater, focusing on three major categories: mineral-based sorbents, bio-based materials, and industrial by-products. Comparative analysis shows that bio-based sorbents, particularly calcium-doped biochars derived from biosolids or agro-waste, achieve the highest adsorption capacities, reaching up to 329 mg P/g. Mineral-based materials demonstrate intermediate performance (0.07–152.1 mg P/g), while industrial by-products such as fly ash and slags show more variable but generally lower capacities (8.2 × 10⁻⁵ to 43.1 mg P/g), depending on composition and treatment.
The observed pattern: bio-based > mineral-based > industrial, emphasises the importance of material origin and surface modification in determining P uptake. Across all sorbent types, key mechanisms include ion exchange, ligand exchange, and precipitation, often facilitated by doping with metals like Ca, Fe, La, or Zr to enhance active site availability and support the formation of stable calcium-phosphate compounds (e.g., brushite, hydroxyapatite).
Regeneration and reuse remain central to long-term sustainability. Several materials, such as La or Fe-modified biochars and Ca-loaded composites, have been successfully regenerated and reused up to ten times without significant performance loss. Moreover, many bio-based sorbents offer post-use value as soil amendments, aligning with circular economy goals and reducing reliance on mined phosphate rock.
While bio-based materials are often low-cost and renewable, mineral-based sorbents may require energy-intensive synthesis, and industrial by-products may demand pre-treatment due to heterogeneity. Additionally, sorption efficiency for industrial materials often correlates with longer contact times and higher P concentrations, limiting their versatility in wastewaters with limited P content.
Despite promising laboratory-scale results, most emerging sorbents remain below TRL 6 due to the limited evidence of long-term validation under real wastewater and operationally relevant conditions. Additional constraints include the lack of standardised testing and reporting protocols, as well as insufficiently demonstrated regeneration and P recovery or reuse pathways. Furthermore, the integration of these materials into existing wastewater treatment trains, together with alignment to regulatory requirements, remains a key challenge for large-scale implementation and technology adoption.
To accelerate the development and deployment of effective P sorbents, future research should prioritise:
1.
2.
3.
4.
5.
A multidisciplinary approach that combines material science, process engineering, environmental policy, and socio-economic analysis is essential to implement these innovations into scalable and practical solutions for sustainable P management.
The following supplementary materials are available online, Figure S1: PRISMA flow diagram of the literature search and study selection process.
All data generated in the study are available in the manuscript or supplementary files.
Conceptualisation, RO-D and KG; formal analysis, KG, AK and JK; methodology, RO-D and KG; writing-original draft, RO-D, KG, OP, AK and SK; writing-review and editing, IZ, JK and SO-G; visualisation, SO-G and JK; supervision, IZ and AK. All authors have read and agreed to the published version of the manuscript.
The authors declare that they have no conflict of interest.
This work was supported by LCS FARP project “Unused Latvia’s natural mineral resources for the development of innovative composite materials for phosphorus recovery from small municipal and industrial wastewater treatment plants to implement the principles of circular economy [CircleP, No. lzp-2021/1-0090]”, Interreg Estonia-Latvia programme project “Circular Nutrient Recovery for Sustainable Municipalities [NutriLoopWorks, EE-LV00163]” and Interreg Central Baltic programme project “Reuse of Nutrients and Water from Human based sludge” [ReNuW-Hubs, CB0700318]. Ruta Ozola-Davidane’s and Andrejs Krauklis’ contributions were supported by TEN4 project “Allocation of state budget funding for tenure professorship to the Latvia University of Life Sciences and Technologies for 2024”. Ivar Zekker was supported by EIC for “Reduction of greenhouse gas emissions in the wastewater treatment sector by autotrophic nitrogen removal as an alternative to heterotrophic processes”, “The reuse/recycling of textile waste as a biomass carrier material for the removal and recycling of organic pollutants and heavy metals from wastewater, excess sludge, compost, and ash using biological methods” and by NEUTEN MSCA fellowships, and further COST actions: CA20101, CA20127, CA20138, CA22102, CA22110, CA22123, CA22162, and CA22146.
Authors are greatly thankful to Diana Mikanova who made the artwork for the graphical abstract.
1.
2.
3.
4.
5.
6.
7.
8.
9.
10.
11.
12.
13.
14.
15.
16.
17.
18.
19.
20.
21.
22.
23.
24.
25.
26.
27.
28.
29.
30.
31.
32.
33.
34.
35.
36.
37.
38.
39.
40.
41.
42.
43.
44.
45.
46.
47.
48.
49.
50.
51.
52.
53.
54.
55.
56.
57.
58.
59.
60.
61.
62.
63.
64.
65.
66.
67.
68.
69.
70.
71.
72.
73.
74.
75.
76.
77.
78.
79.
80.
81.
82.
83.
84.
85.
86.
87.
88.
89.
90.
91.
92.
93.
94.
95.
96.
97.
98.
99.
100.
101.
102.
103.
104.
105.
106.
107.
108.
109.
110.
111.
112.
113.
114.
115.
116.
117.
118.
119.
120.
121.
122.
123.
124.
125.
126.
127.
128.
129.
130.
131.
132.
133.
134.
135.
136.
137.
138.
Ozola-Davidane R, Gruskevica K, Purmalis O, Kostjukova S, Karasa J, Zekker, I, et al. Sustainable sorbent materials for phosphorus removal and recovery from wastewater: a comprehensive review and TRL-based evaluation. J Sustain Res. 2026;8(2):e260043. https://doi.org/10.20900/jsr20260043.

Copyright © Hapres Co., Ltd. Privacy Policy | Terms and Conditions


