Location: Home >> Detail
J Sustain Res. 2026;8(3):e260078. https://doi.org/10.20900/jsr20260078

proMetheus, Research Unit on Energy, Materials and Environment for Sustainability, Instituto Politécnico de Viana do Castelo, Rua da Escola Industrial e Comercial de Nun’Alvares, 4900-347 Viana do Castelo, Portugal
Although Portugal enjoys a temperate climate by European standards, it records some of the highest levels of self-reported thermal discomfort in the European Union: in 2024, 15.7% of the resident population declared being financially unable to keep the home adequately warm, compared with an EU-27 average of 9.2%, while 29.9% reported being unable to keep the dwelling comfortably cool during the summer. This article argues that conventional energy-poverty metrics, based on expenditure shares or on arrears, are poorly suited to this reality, since many households respond to unaffordable energy by restricting consumption below the level required for thermal comfort, a phenomenon known as hidden energy poverty that remains invisible to expenditure-based statistics. Portugal’s principal protective instrument, the Social Energy Tariff, has been assigned automatically since 2016 on income and social-benefit criteria and covered approximately 775,000 electricity clients in the third quarter of 2025, yet its territorial correspondence with the geography of energy deprivation has never been systematically evaluated. The article therefore develops a municipal, spatiotemporal framework in which economic vulnerability, dwelling-stock vulnerability, climatic exposure, and an underconsumption indicator derived from administrative electricity records are integrated into a latent Hidden Energy Poverty Index, estimated with Bayesian spatiotemporal methods for the 308 Portuguese municipalities over 2016–2024. The framework distinguishes winter from summer vulnerability, quantifies municipal gaps between estimated need and tariff coverage, and pre-specifies a quasi-experimental test of the tariff’s protective role during the 2021–2023 price shock, with descriptive evidence from official statistics supporting its premises. The framework is additionally implemented in reduced form with published data: a cross-national regression for the EU-27 confirms that dwelling-stock quality predicts thermal deprivation conditional on income; the structural core of the index is computed for the twenty-four NUTS III subregions of mainland Portugal, revealing distinct climatic geographies of winter and summer vulnerability bridged by a socially vulnerable interior belt; and the published territorial footprint of the tariff is shown to track winter need while leaving the geography of summer need comparatively unprotected.
BYM2, Besag–York–Mollié (scaled parameterization); CDD, cooling degree days; DGEG, Direção-Geral de Energia e Geologia (Directorate-General for Energy and Geology); EPC, energy performance certificate; ERSE, Entidade Reguladora dos Serviços Energéticos (Energy Services Regulatory Authority); EU-SILC, European Union Statistics on Income and Living Conditions; FCT, Fundação para a Ciência e a Tecnologia; HDD, heating degree days; ICOR, Inquérito às Condições de Vida e Rendimento (Survey on Income and Living Conditions); IDEF, Inquérito às Despesas das Famílias (Household Budget Survey); INE, Instituto Nacional de Estatística (Statistics Portugal); IPMA, Instituto Português do Mar e da Atmosfera (Portuguese Institute for Sea and Atmosphere); LIHC, Low Income High Costs; LPG, liquefied petroleum gas; SCE, Sistema de Certificação Energética (national Energy Certification System)
Energy poverty, commonly understood as the inability of a household to secure the domestic energy services that ordinary life requires, has traditionally been associated with the cold climates of Northern Europe, yet the available comparative evidence indicates that the Member States in which the population most frequently reports being unable to keep the home adequately warm are concentrated in the south and east of the continent, a pattern that has been characterized as the European energy divide [1–3]. The phenomenon has meanwhile acquired considerable weight within the climate and cohesion agenda of the European Union, insofar as Commission Recommendation (EU) 2020/1563 invited Member States to define, quantify, and monitor energy poverty [4], while the Social Climate Fund established by Regulation (EU) 2023/955 makes the identification of vulnerable households a condition for access to compensatory resources from 2026 onward [5,6]. Both instruments presuppose measurement infrastructures capable of locating energy-poor households in space and time, and it is precisely such infrastructures that remain incomplete in most Southern European countries, among which Portugal is no exception.
The Portuguese case illustrates the magnitude of the problem with particular clarity. In 2024, 15.7% of the resident population reported being financially unable to keep the home adequately warm, a value that represented an improvement of more than five percentage points relative to the 20.8% recorded in 2023 and constituted the largest single-year reduction observed in the Union, but that nonetheless kept the country among the five worst performers of the EU-27, whose average stood at 9.2% [7,8]. It should be noted that the harmonized Eurostat series currently reports 14.5% for Portugal in 2024 following revision, and the circumstance that a headline indicator can shift by almost one percentage point between the national release and its harmonized counterpart is in itself indicative of the sensitivity of consensual measures to survey processing. The seasonal dimension of the phenomenon is even more pronounced, although it has received considerably less attention: in the same year, 29.9% of the population declared being unable to keep the dwelling comfortably cool during the summer, a proportion that rose to 39.2% among people at risk of poverty and to 33.0% among those aged 65 or over, while winter incapacity exhibited an analogous social gradient, reaching 30.9% and 22.0% in the same groups [7]. The disproportionately high incidence recorded among older people is not incidental, and the recent literature has begun to conceptualize it as energy ageism, an age-differentiated pattern of energy deprivation and of exclusion from the benefits of the energy transition, to which the Discussion returns at greater length [9]. According to the regional breakdown published by Statistics Portugal, the Autonomous Region of the Azores and the Norte region combined elevated levels of winter and summer incapacity simultaneously [10].
These outcomes are rooted in the characteristics of the building stock rather than in the severity of the climate. According to the 2021 Census, 83.4% of conventional dwellings occupied as usual residence had no air-conditioning equipment, a proportion that declined only to 63.5% among dwellings built in the preceding decade, while central heating was present in barely 14% of dwellings and approximately one third of households did not make regular use of any form of heating [11]. Survey data for 2023 indicate, in turn, that 26.6% of the population lived in dwellings in which no heating whatsoever was used, with values of 24.0% on the mainland, 72.6% in the Azores, and 86.0% in Madeira, and with the share rising to 39.7% among people at risk of poverty; among the households that did heat their homes, electricity constituted the dominant energy carrier, accounting for 48.5% of cases [12]. The expenditure data, by contrast, convey an apparently reassuring picture, since the Household Budget Survey of 2022/2023 places electricity, gas, and other fuels at 5.2% of household monetary income on average, even though the burden exceeded one quarter of income for 14.2% of households at risk of poverty [13]. The coexistence of moderate average expenditure with widespread thermal discomfort constitutes, in analytical terms, the statistical signature of consumption rationing, given that households which contain their bills by heating and cooling less than they need leave no trace in arrears statistics and appear entirely unremarkable in expenditure data [14,15].
This form of deprivation, which the literature has designated hidden energy poverty, has been documented in a growing number of European contexts: it has been identified in Belgian expenditure data [16], operationalized through a dedicated indicator for Italy [17], examined through the housing costs of Central and Eastern Europe [18], linked to deliberate self-restriction in household energy use in Austria [19], analyzed as the forced curtailment of energy needs in Greece [20], and investigated in Spain with respect to the profile and motivations of underconsuming households [21]. A parallel strand of research has emphasized that summer energy poverty, understood as the inability to maintain safe indoor temperatures during hot periods, remains largely invisible in Europe’s heating-centered metrics [22,23], a limitation whose consequences are particularly serious for Iberian territories exposed to increasingly frequent and intense heat waves. Portuguese scholarship has prepared the ground for the present study in several respects, since fuel poverty has been mapped at regional scale [24], a vulnerability index has been constructed at civil-parish level on the basis of census and climatic data [25], the gap between actual and required thermal energy use has been quantified for the dwelling stock [26], and vulnerability maps have been confronted with household interviews [27]. To the best of the author’s knowledge, however, no study has yet measured underconsumption directly from administrative consumption records within a municipal panel, articulated winter and summer geographies within a single latent structure, or evaluated the territorial performance of the country’s principal protective policy.
That policy is the Social Energy Tariff (Tarifa Social de Energia), created by Decree-Law No. 138-A/2010 as a discount on network-access tariffs for electricity and natural gas and profoundly reconfigured on July 1, 2016, when Law No. 7-A/2016 rendered its attribution automatic: since that date, the Directorate-General for Energy and Geology (DGEG) has cross-checked, on a monthly basis, the client files of energy suppliers against the records of the Tax Authority and of Social Security, so that eligible customers receive the discount without submitting any application [28]. Eligibility is established either through the receipt of designated minimum-income, family, unemployment, or old-age and disability benefits, or through an annual household income at or below €6272.64, increased by 50% for each household member without income up to a maximum of ten [28,29], and the discount is far from negligible, corresponding in 2025 to an average of 33.8% of the pre-tax price of the transitional electricity tariffs and to 31.2% in the case of natural gas [29]. The reach of the scheme is equally substantial, given that in the third quarter of 2025 a monthly average of 775,006 electricity clients benefited from the tariff, corresponding to approximately 7.6% of the mainland resident population, with district-level prevalence peaking at 13.0% in Vila Real and 11.6% in Bragança and with the largest absolute counts concentrated in Lisbon and Porto [30], while the fourth-quarter bulletin reports approximately 730,000 beneficiaries, or 7.2%, with the lowest district prevalence recorded in Évora [31]. A caveat that runs through the entire article should be made explicit at the outset: beneficiary counts refer to supply contracts, and therefore essentially to households, whereas EU-SILC deprivation rates refer to persons, which means that the two magnitudes cannot be compared directly and that the construction of a common territorial and unit basis constitutes, in itself, one of the methodological tasks addressed in this study.
In light of the foregoing, the central research question can be formulated as follows: to what extent does the territorial distribution of the Social Energy Tariff coincide with the actual distribution of energy poverty in Portugal, once the analysis incorporates the households that ration consumption below their thermal-comfort needs? Five hypotheses, corresponding to distinct but complementary facets of this question, structure the inquiry.
H1 (structural energy poverty). The age and thermal inefficiency of the dwelling stock exert a significant influence on energy poverty even after household income is controlled for.
H2 (hidden energy poverty). Indicators based on arrears or on energy expenditure underestimate the extent of energy poverty, because part of the population avoids indebtedness precisely by reducing heating and cooling below the level of need.
H3 (tariff misalignment). The coverage of the Social Tariff does not fully coincide with estimated energy vulnerability, and municipalities combining high need with comparatively low coverage can therefore be expected to exist.
H4 (distinct seasonal geographies). Winter energy poverty is more intense in the North and in the Interior of the country, whereas summer energy poverty tends to concentrate in the South, in dense urban areas, and in territories exposed to heat waves.
H5 (protective effect). Municipalities that displayed higher Social Tariff coverage before the 2021–2023 energy crisis experienced a smaller deterioration of deprivation and underconsumption indicators during the price shock.
The contribution of the article is threefold, and its components are designed to operate jointly: the specification of a Spatiotemporal Hidden Energy Poverty Index for the 308 Portuguese municipalities, in which arbitrary additive weighting is replaced by model-based latent aggregation and results are reported as probabilities accompanied by uncertainty intervals; the operationalization of an underconsumption indicator that converts administrative electricity records into a measure of deprivation expressed in kilowatt-hours and in euros; and the design of the first territorial evaluation of the Social Tariff, including a pre-specified quasi-experimental assessment of its role during the price crisis. The nature of the article should likewise be stated with precision, since its character is deliberately methodological and descriptive: the Materials and Methods section presents the data and methods, the Results section assembles the national-scale evidence that substantiates the premises of the framework and defines its decision products, and the Discussion and the Conclusions draw out the implications, while the municipal estimation itself constitutes the subsequent empirical stage that the protocol defined here is intended to support and, by fixing the analytical rules before the results are known, to discipline. The scope of the empirical material should be stated with equal precision. H1 to H4 are confronted with data in the Results section, at the finest scales at which published, independently verifiable series currently allow: H1 cross-nationally for the twenty-seven Member States, H2 at national scale, and H3 and H4 through a reduced-form computation of the structural core of the index for the twenty-four NUTS III subregions of mainland Portugal, confronted with the district-level footprint of the Social Tariff. What published data do not yet permit is the estimation at municipal scale with the underconsumption dimension included, and any test of H5, because the municipal beneficiary files underlying the automatic attribution process are not released in the DGEG bulletins; those components of the protocol are specified here in full and their analytical rules remain fixed in advance of estimation.
The municipality (concelho) was adopted as the unit of analysis for two complementary reasons: it is the lowest administrative tier at which the required administrative and census series can be jointly assembled, and it is simultaneously the tier at which renovation programs, social services, and local energy agencies operate in practice. The resulting universe comprises 308 units, of which 278 are located on the mainland and 30 in the Autonomous Regions of the Azores and Madeira, and the core dataset takes the form of a municipality–year panel covering 2016–2024, that is, the interval over which Social Tariff statistics, available from 2016, and municipal residential electricity consumption, available through 2024, overlap, with extensions into 2025 wherever the series remain comparable. Since the design is ecological, the inferences drawn from it concern territorial concentrations of risk rather than individual households, and both the modifiable areal unit problem and the associated risk of ecological fallacy are addressed explicitly, chiefly through the validation of municipal estimates against survey-based indicators at NUTS II level, as described in the Validation and Robustness subsection.
Data SourcesAll the sources mobilized in this study are official and publicly accessible, and they are summarized in Table 1; three of them, however, require explicit handling rules rather than implicit confidence. In the first place, energy performance certificates issued under the national certification system cover only the certified stock, which consists predominantly of new buildings, transactions, leases, and renovated dwellings, and they are therefore treated throughout as a characterized sample of the stock rather than as its full representation. In the second place, DGEG has itself documented completeness problems in some Social Tariff processings of 2024 and 2025, for which reason the affected months are flagged and, in robustness analyses, either excluded or replaced by quarterly and annual medians, without ever being treated as observations fully comparable to the remainder of the series. In the third place, climatic exposure is computed from the ERA5-Land reanalysis, which provides hourly records since 1950 at a native resolution of approximately 9 km under a CC-BY license [32] and is aggregated to municipalities by area-weighted averaging of grid cells; heating and cooling degree days follow the Eurostat convention, heat waves are identified as sequences of at least six consecutive days with maximum temperature above the local 90th percentile, and the resulting aggregates are benchmarked against the station-based climatological series of the Portuguese Institute for Sea and Atmosphere (IPMA).
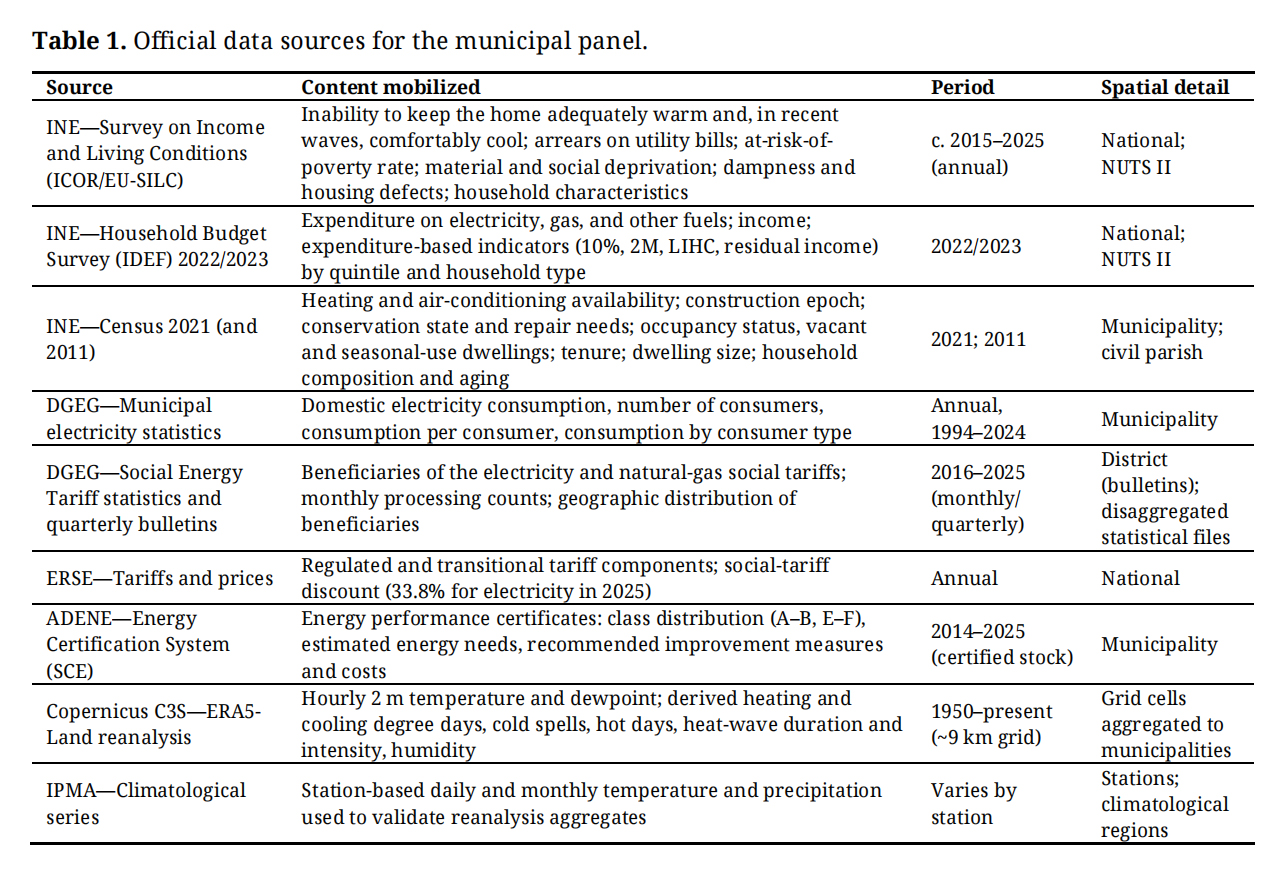 Table 1. Official data sources for the municipal panel.
The index combines four dimensions, namely economic vulnerability (D1), dwelling-stock vulnerability (D2), climatic exposure (D3), and energy underconsumption (D4), whose candidate indicators are listed in Table 2 and whose articulation is summarized in Figure 1, and all indicators are standardized within each year in order to remove common national trends. The central methodological difficulty resides in the aggregation of these dimensions, given that composite indices are highly sensitive to their weighting schemes and that equal weighting constitutes a convention rather than a substantiated analytical choice. Two complementary strategies are accordingly pursued: as a transparent benchmark, each dimension is summarized by its first principal component and the four dimensions are combined with equal weights, subject to sensitivity analysis over alternative weight vectors, whereas the preferred specification treats energy poverty as a latent municipal propensity on which the standardized indicators load, endowed with a BYM2 spatially structured prior [33,34], a first-order random-walk temporal effect, and a space–time interaction, and estimated by integrated nested Laplace approximation. The output of this specification consists, for each municipality and year, of a posterior distribution, and hence of a probability of belonging to the most deprived quantiles accompanied by credible intervals, rather than of a single point score whose apparent precision the underlying data could not sustain; winter and summer variants are obtained by conditioning the climatic block on heating-related versus cooling-related exposure and the dwelling block on heating versus cooling equipment.
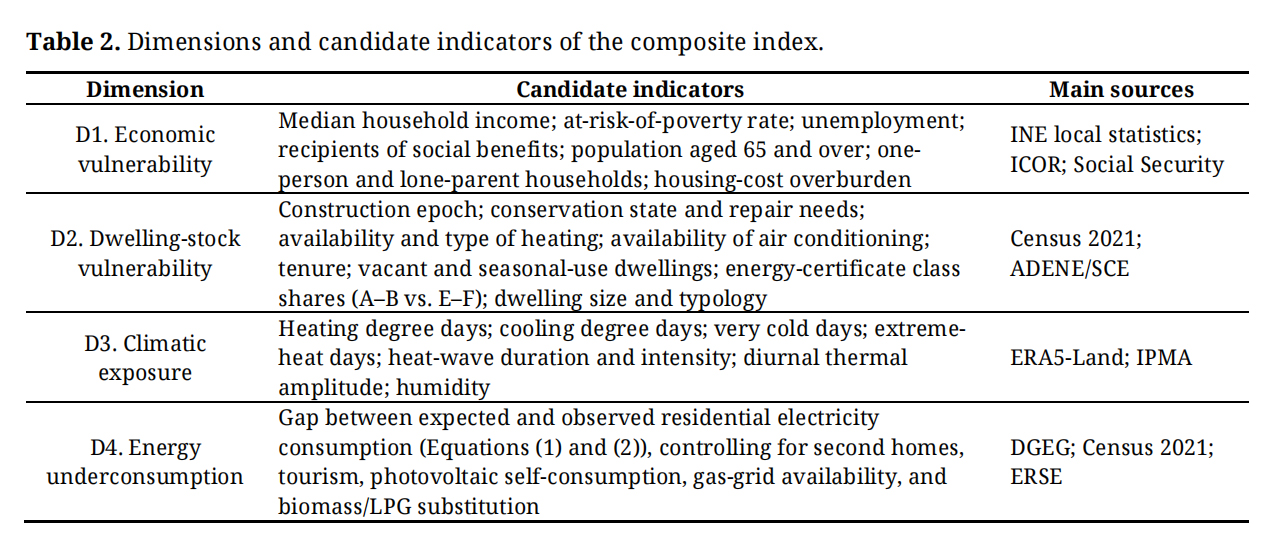 Table 2. Dimensions and candidate indicators of the composite index.
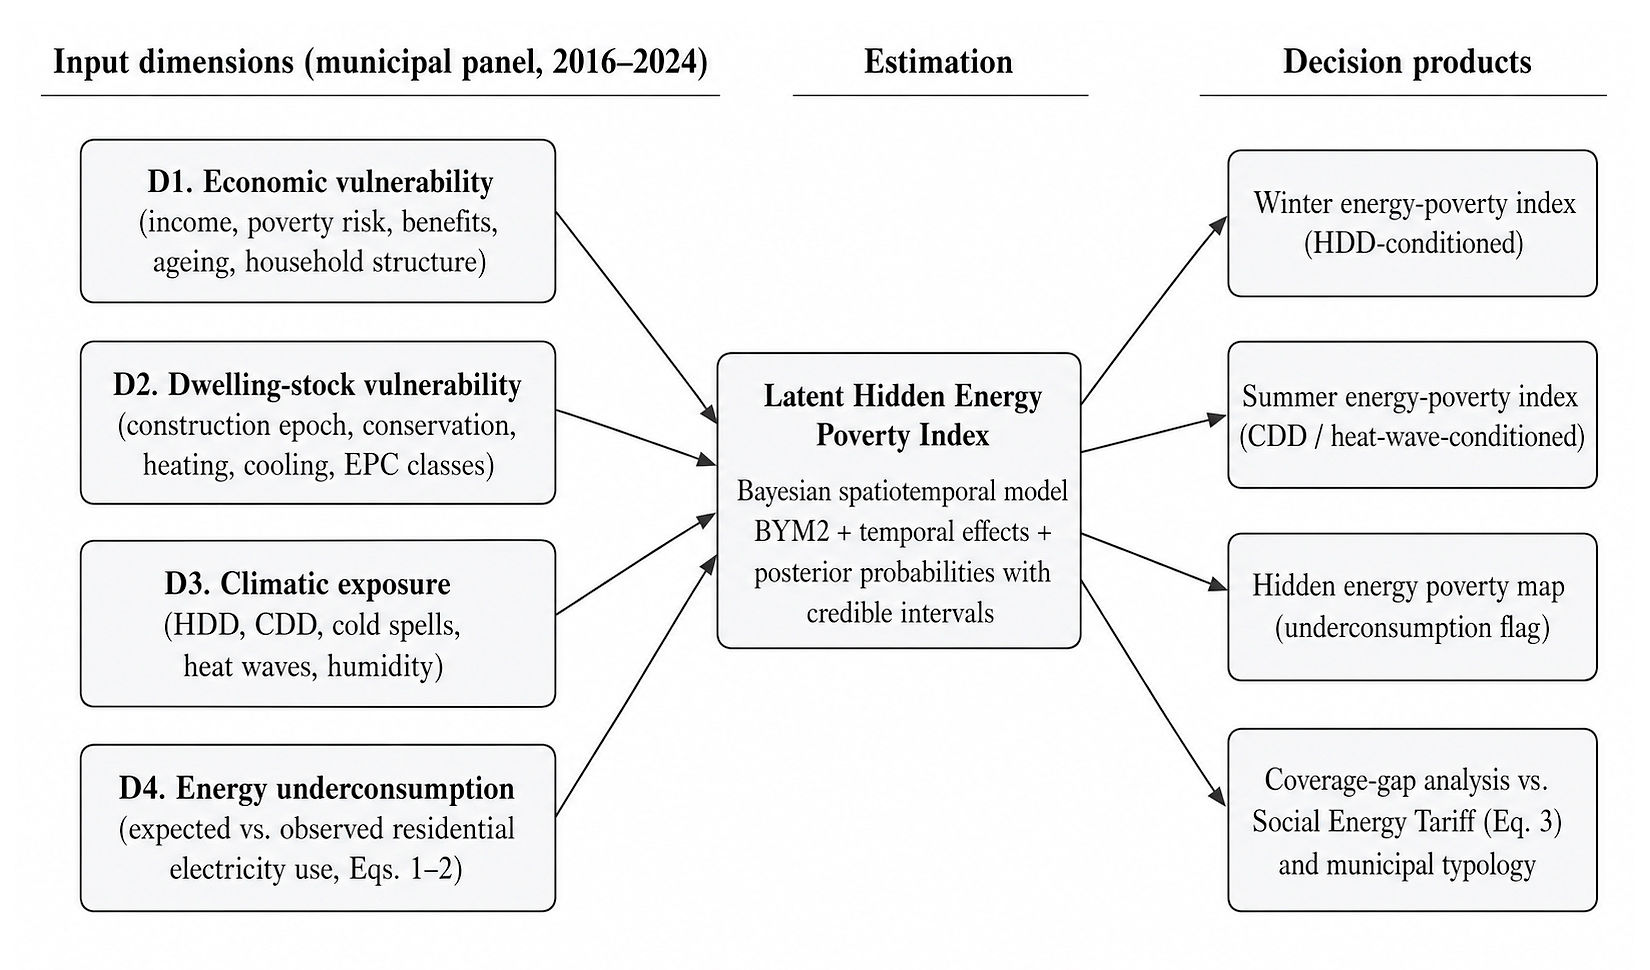 Figure 1.
Architecture of the Spatiotemporal Hidden Energy Poverty Index: input dimensions, latent estimation, and decision products. HDD/CDD: heating/cooling degree days; EPC: energy performance certificate; BYM2: Besag–York–Mollié spatial prior (scaled parameterization).
Figure 1.
Architecture of the Spatiotemporal Hidden Energy Poverty Index: input dimensions, latent estimation, and decision products. HDD/CDD: heating/cooling degree days; EPC: energy performance certificate; BYM2: Besag–York–Mollié spatial prior (scaled parameterization).
The component that most clearly distinguishes this framework from previous vulnerability indices consists in confronting the residential electricity consumption that a municipality would be expected to register, given its climate, population, and housing conditions, with the consumption actually observed in DGEG administrative records, and expected consumption is for this purpose modeled as
where E*it denotes expected, needs-consistent residential consumption in municipality i and year t; HDD and CDD denote heating and cooling degree days; H summarizes dwelling characteristics such as construction-epoch shares, size, and certificate-class composition; P is the resident population; EFF proxies the efficiency of the stock; Y is income; and T is tourism intensity. Equation (1) is estimated as a two-way fixed-effects panel regression of consumption per consumer, or alternatively per capita, on these covariates, while a complementary normative variant derives expected consumption from the energy that a reference dwelling would require in order to reach standard comfort temperatures under local degree days, in line with the required-energy approach of Palma et al. (2019) [26]. The underconsumption indicator is then defined as
large positive values of this indicator signal consumption below what climatic and housing conditions would predict, although such values do not, by themselves, constitute evidence of deprivation, since a municipality may consume little because its dwellings are genuinely efficient, because a substantial share of its housing remains unoccupied outside the tourist season, because photovoltaic self-consumption reduces metered demand, or because households rely on firewood and bottled gas that no electricity meter records. For this reason, the census share of vacant and seasonal-use dwellings, tourism intensity, registered photovoltaic self-consumption capacity, the availability of the natural-gas grid, and the prevalence of firewood and liquefied petroleum gas as heating carriers are included as controls, and a municipality is flagged as “hidden energy poor” only when a high standardized value of Equation (2) coincides with high vulnerability in dimensions D1 to D3, so that low consumption arising from efficiency or from fuel substitution is not misinterpreted as deprivation. The regulated price components published by ERSE are subsequently used to translate the resulting gap into euros as well as kilowatt-hours, thereby expressing the deprivation in the units in which policy decisions are ordinarily formulated.
Spatial AnalysisGiven that spatial dependence constitutes a defining feature of the phenomenon under study rather than a mere statistical nuisance, spatial structure is characterized by means of the global Moran’s I statistic, and statistically significant clusters of vulnerability are delimited through local indicators of spatial association [35,36]. H1 is subsequently tested with spatial-lag and spatial-error regressions of the estimated index, and of the survey-anchored deprivation measures, on dwelling-stock characteristics conditional on income, complemented by two-way fixed-effects panel specifications with standard errors robust to spatial dependence.
Coverage of the Social Tariff and the Alignment IndicatorTariff coverage is defined as the number of electricity social-tariff beneficiaries divided by the number of classical family households of usual residence in each municipality, a definition that places the contract-based beneficiary count on a household denominator, while a person-based sensitivity bound is obtained by combining beneficiary counts with the local distribution of household size. The alignment between protection and need is then measured through the coverage gap
where θ denotes the posterior latent energy-poverty index rescaled to the coverage metric and C denotes Social Tariff coverage. On the basis of this indicator, municipalities are classified into the four groups represented in Figure 2, among which the off-diagonal quadrants carry the greatest analytical interest: the combination of high vulnerability with low coverage identifies the priority gap, whereas the combination of low vulnerability with high coverage should be read not as an anomaly requiring correction of the analysis but as a diagnosis in its own right, insofar as it delimits the territories where income-defined vulnerability and thermal need diverge, a divergence that a tariff assigned on income and benefit criteria may reasonably be expected to produce somewhere in the national territory.
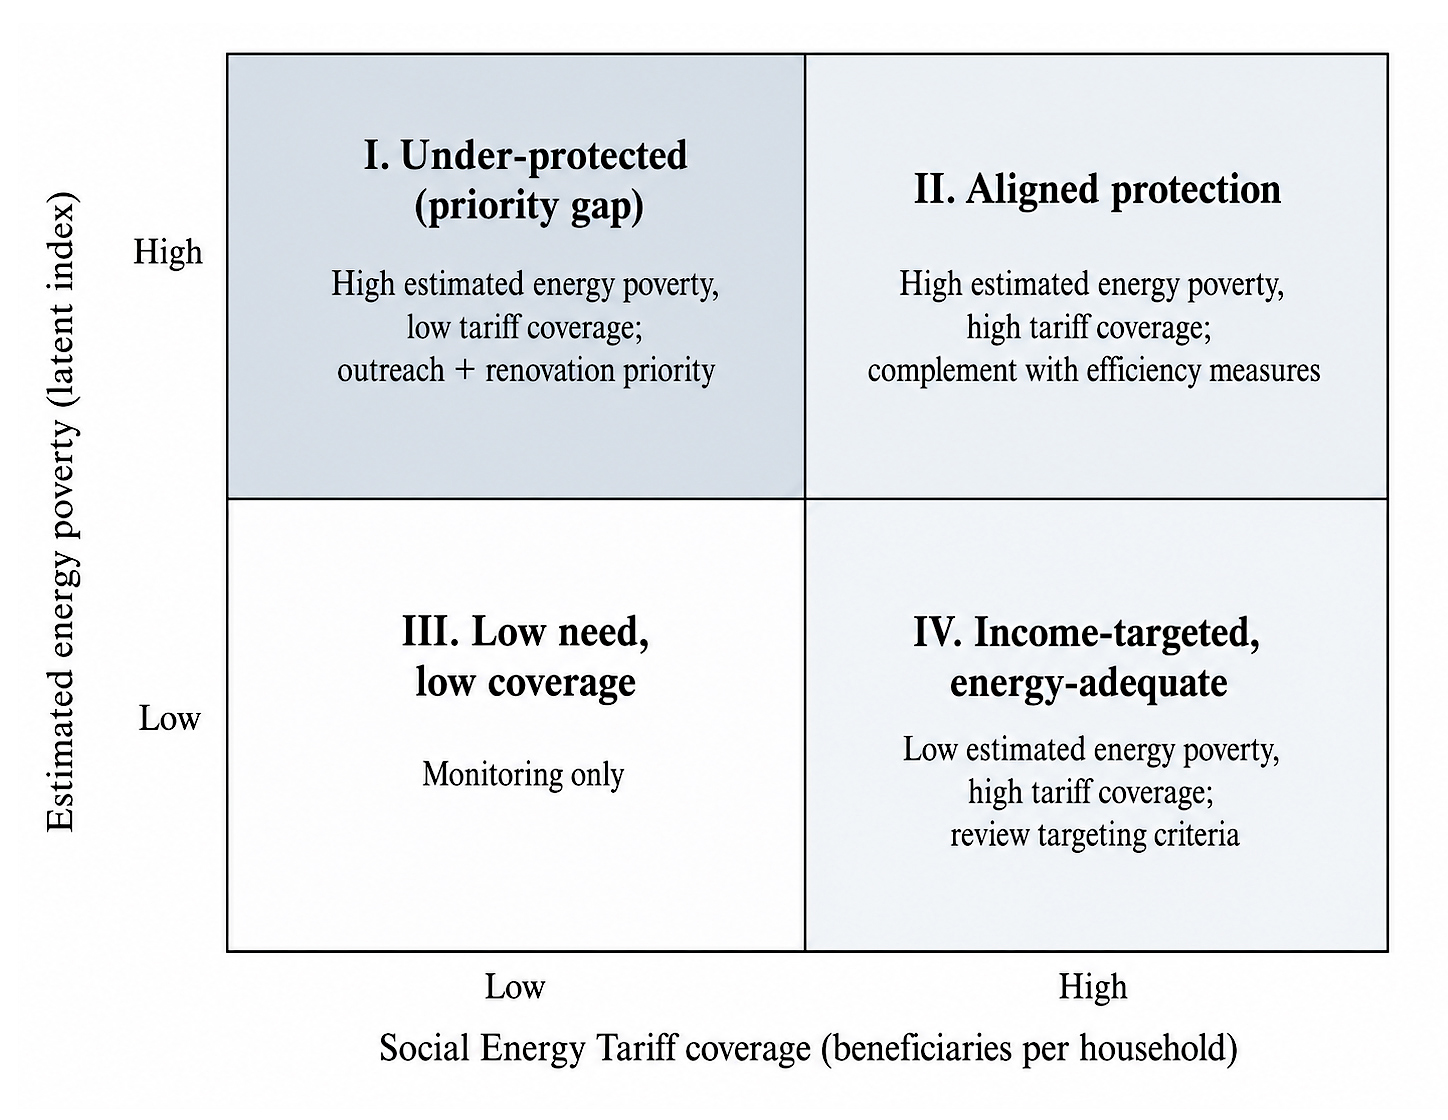 Figure 2.
Coverage-gap typology combining estimated energy poverty with Social Energy Tariff coverage, and the policy response associated with each quadrant. Quadrant membership is an empirical outcome of the estimation stage.
Figure 2.
Coverage-gap typology combining estimated energy poverty with Social Energy Tariff coverage, and the policy response associated with each quadrant. Quadrant membership is an empirical outcome of the estimation stage.
The 2021–2023 price shock provides a demanding but informative setting in which to examine H5. Municipalities with higher and lower pre-crisis coverage, measured as the 2016–2019 average and discretized into terciles, are compared across the crisis window within an event-study and difference-in-differences design whose outcomes include the underconsumption indicator, consumption per domestic consumer, and, at the regional level, survey-based arrears and deprivation rates, with estimation relying on methods robust to treatment-effect heterogeneity and staggered exposure [37] and with the decomposition proposed by Goodman-Bacon (2021) [38] serving as a diagnostic. It must nonetheless be acknowledged that identification is far from guaranteed, since coverage is not randomly assigned but mechanically associated with income poverty and benefit receipt; the protocol therefore requires parallel pre-trend tests over 2016–2019, conditioning on dimensions D1 to D3, matching on pre-period trajectories, alternative comparison groups, and placebo years, and the commitment is made in advance to interpret the resulting estimates as protective associations unless these identifying assumptions withstand scrutiny.
Validation and RobustnessBecause municipal estimates are only as credible as the external checks to which they are subjected, the results are triangulated against three independent benchmarks: the national and NUTS II series of the Survey on Income and Living Conditions, for winter and summer incapacity alike; the expenditure-based indicators computable from the Household Budget Survey, namely the 10% threshold, twice the median share, the Low Income High Costs measure, and residual income after energy expenditure, which belong to the analytical tradition inaugurated by Boardman (1991) [39] and critically reviewed by Tirado Herrero (2017) [40]; and the indicator set of the National Observatory of Energy Poverty. Robustness analyses vary the aggregation weights, the degree-day bases, the treatment of the flagged 2024–2025 tariff processings, the inclusion of the autonomous regions, and the threshold defining underconsumption, and the framework is re-estimated under alternative definitions of energy poverty.
Reduced-Form Implementation with Published DataBecause the assembly of the full municipal panel depends on disaggregated administrative files that are not published in the DGEG quarterly bulletins, the framework is additionally implemented, within this article, in a reduced form that relies exclusively on published and independently verifiable series. Three analyses are specified. First, H1 is tested cross-nationally on the twenty-seven Member States by regressing the share of population unable to keep the home adequately warm in 2024 [8] on the share of population living in a dwelling with a leaking roof, damp walls, floors or foundation, or rot in window frames or floor in 2023 [41], conditional on the logarithm of median equivalised income in purchasing power standards in 2024 [42], by ordinary least squares; the dwelling-defect indicator is the only harmonized measure of stock quality available for all Member States and serves here as the proxy for thermal inefficiency. Second, the structural core of the index defined in Table 2 is computed for the twenty-four NUTS III subregions of mainland Portugal, the finest territorial level at which the required inputs are published: heating and cooling degree days for 2023 from the Eurostat regional series [43], the share of population aged 65 and over on 1 January 2024 [44], and gross domestic product per inhabitant in 2023 [45] are standardized across subregions and combined with equal weights into a winter composite (heating degree days, aging, and log income with inverted sign) and a summer composite (cooling degree days, aging, and log income with inverted sign), and subregions are classified by the median split of the two composites; the autonomous regions are excluded because the regional degree-day series does not cover them, and gross domestic product per inhabitant, which overstates household resources in commuting-intensive metropolitan areas, is used only because subregional household income is not published at this level. Third, national final energy consumption in households per capita [46] is confronted with the deprivation and expenditure series already presented, as a consistency test of H2. The limits of this reduced form are stated at once: it contains no consumption-based underconsumption indicator (dimension D4), no dwelling-stock block beyond what climate and income capture indirectly (dimension D2), and no municipal resolution, and it therefore complements, but does not replace, the estimation on the full panel specified above.
The results are organized in two parts. The subsections that follow first assemble the national-scale evidence that substantiates the premises of the framework; the final subsection then reports the reduced-form empirical implementation and the tests of H1 to H4 that published data permit, together with the status of H5.
National Evidence of Seasonal and Hidden Thermal DeprivationFigure 3 situates the Portuguese trajectory of winter thermal deprivation against the EU-27 aggregate for 2015–2024, and three features of this trajectory deserve emphasis. The first concerns the persistent distance separating Portugal from the European average, given that the national share of the population unable to keep the home adequately warm ranged, across the decade, between approximately 1.7 and 2.7 times the EU-27 value, declining from 23.8% in 2015 to 15.7% in 2024. The second concerns the reversal produced by the energy price crisis, in the course of which seven years of steady improvement were undone within a single year, with the indicator rising from 17.5% in 2022 to 20.8% in 2023 and thereby returning Portugal, jointly with Spain, to the worst position in the Union, before the largest single-year decline among Member States brought the value back down in 2024 [7,8]. The third concerns the persistence of the national disadvantage, since even at its 2024 minimum the Portuguese value remained above the EU-27 level observed in any year of the series.
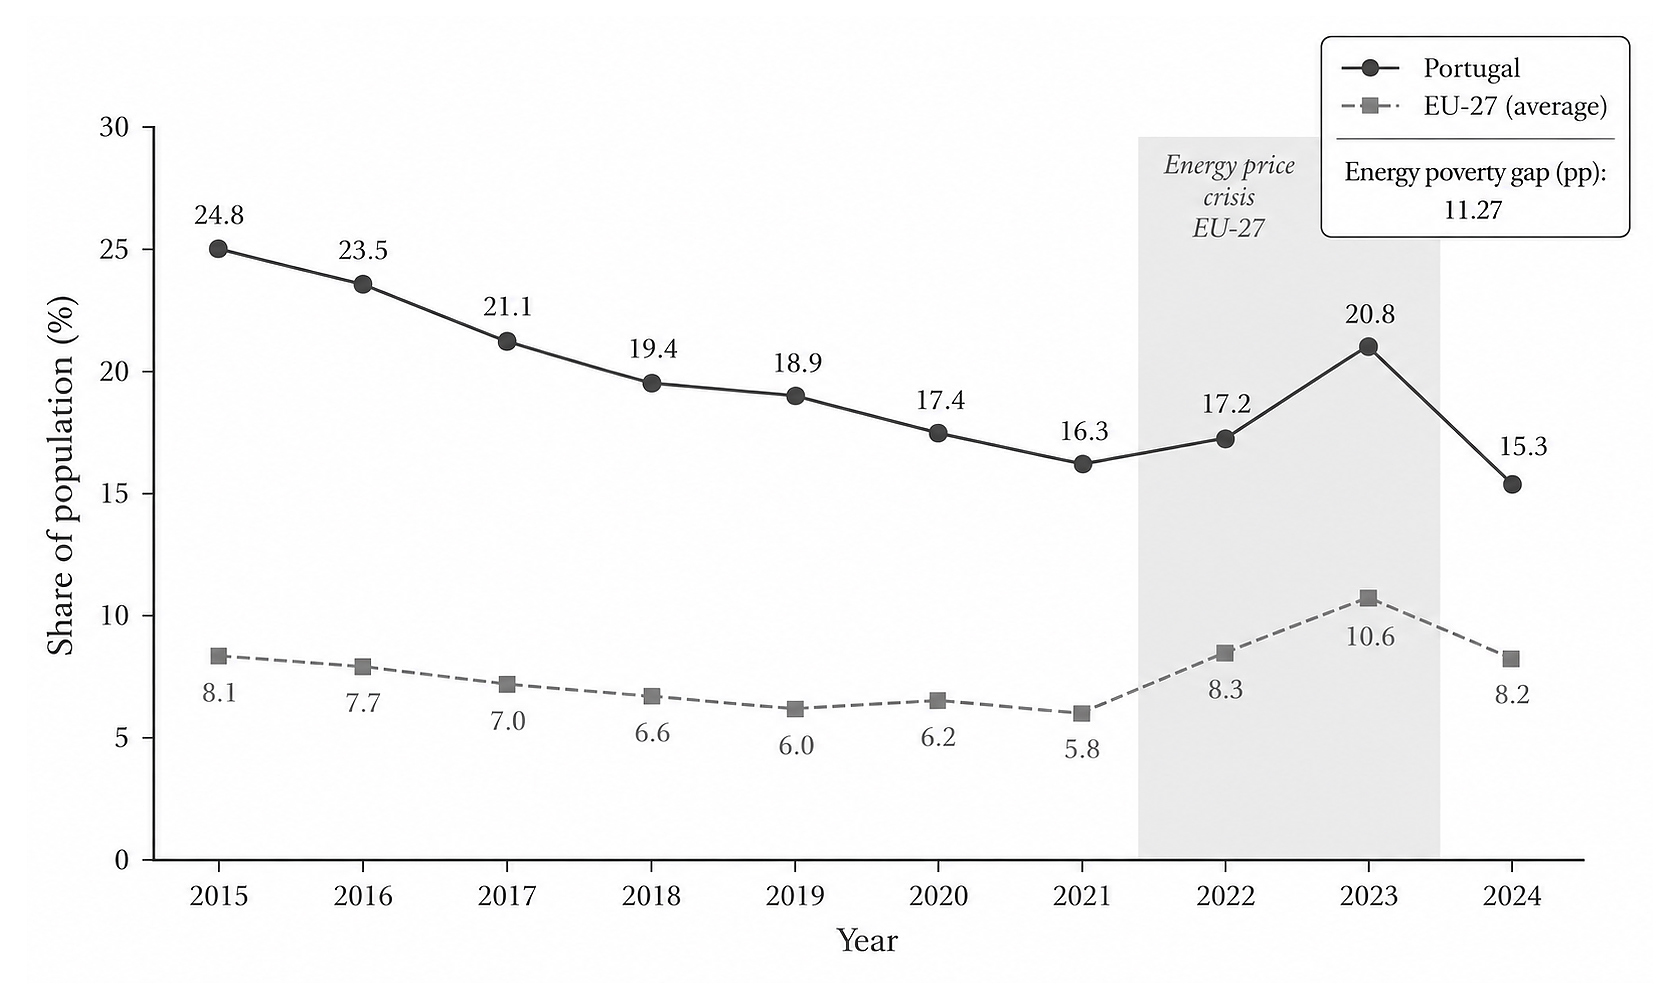 Figure 3.
Share of the population unable to keep the home adequately warm, Portugal and EU-27, 2015–2024. Source: Eurostat (EU-SILC, indicator ilc_mdes01) [8] and INE (ICOR) [7]. The 2024 value for Portugal corresponds to the figure released by INE (15.7%); the harmonized Eurostat series reports 14.5% after revision. The shaded band marks the 2021–2023 energy price crisis.
Figure 3.
Share of the population unable to keep the home adequately warm, Portugal and EU-27, 2015–2024. Source: Eurostat (EU-SILC, indicator ilc_mdes01) [8] and INE (ICOR) [7]. The 2024 value for Portugal corresponds to the figure released by INE (15.7%); the harmonized Eurostat series reports 14.5% after revision. The shaded band marks the 2021–2023 energy price crisis.
The seasonal decomposition available for 2024, presented in Figure 4, inverts the hierarchy of concern that has traditionally guided European measurement. The proportion of the population unable to keep the dwelling comfortably cool in summer, at 29.9%, was nearly twice the corresponding winter figure of 15.7%, and both dimensions displayed pronounced social gradients, reaching 30.9% and 39.2% among people at risk of poverty and 22.0% and 33.0% among those aged 65 and over [7]. The equipment record of the 2021 Census renders these results intelligible, insofar as air conditioning was absent from 83.4% of usual-residence dwellings, central heating was present in barely 14% of them, and the use of heating ranged from 86.2% of dwellings in Alto Tâmega and 84.8% in Terras de Trás-os-Montes to 65.0% in the Lisbon Metropolitan Area, 58.6% in Madeira, and 52.2% in the Azores, where air-conditioning availability fell to 6.3%, and to as little as 2.5% in Madeira [11]. In 2023, moreover, 26.6% of the population lived in dwellings in which no heating at all was used, a share that rose to 39.7% among people at risk of poverty [12]. When these figures are set against an average energy budget share of 5.2% [13], the premise underlying H2 acquires substantial empirical support, since a considerable part of the Portuguese population evidently adjusts on the quantity margin, remaining invisible to expenditure and arrears statistics, and since this adjustment possesses a summer dimension that heating-centered indicators are structurally unable to detect.
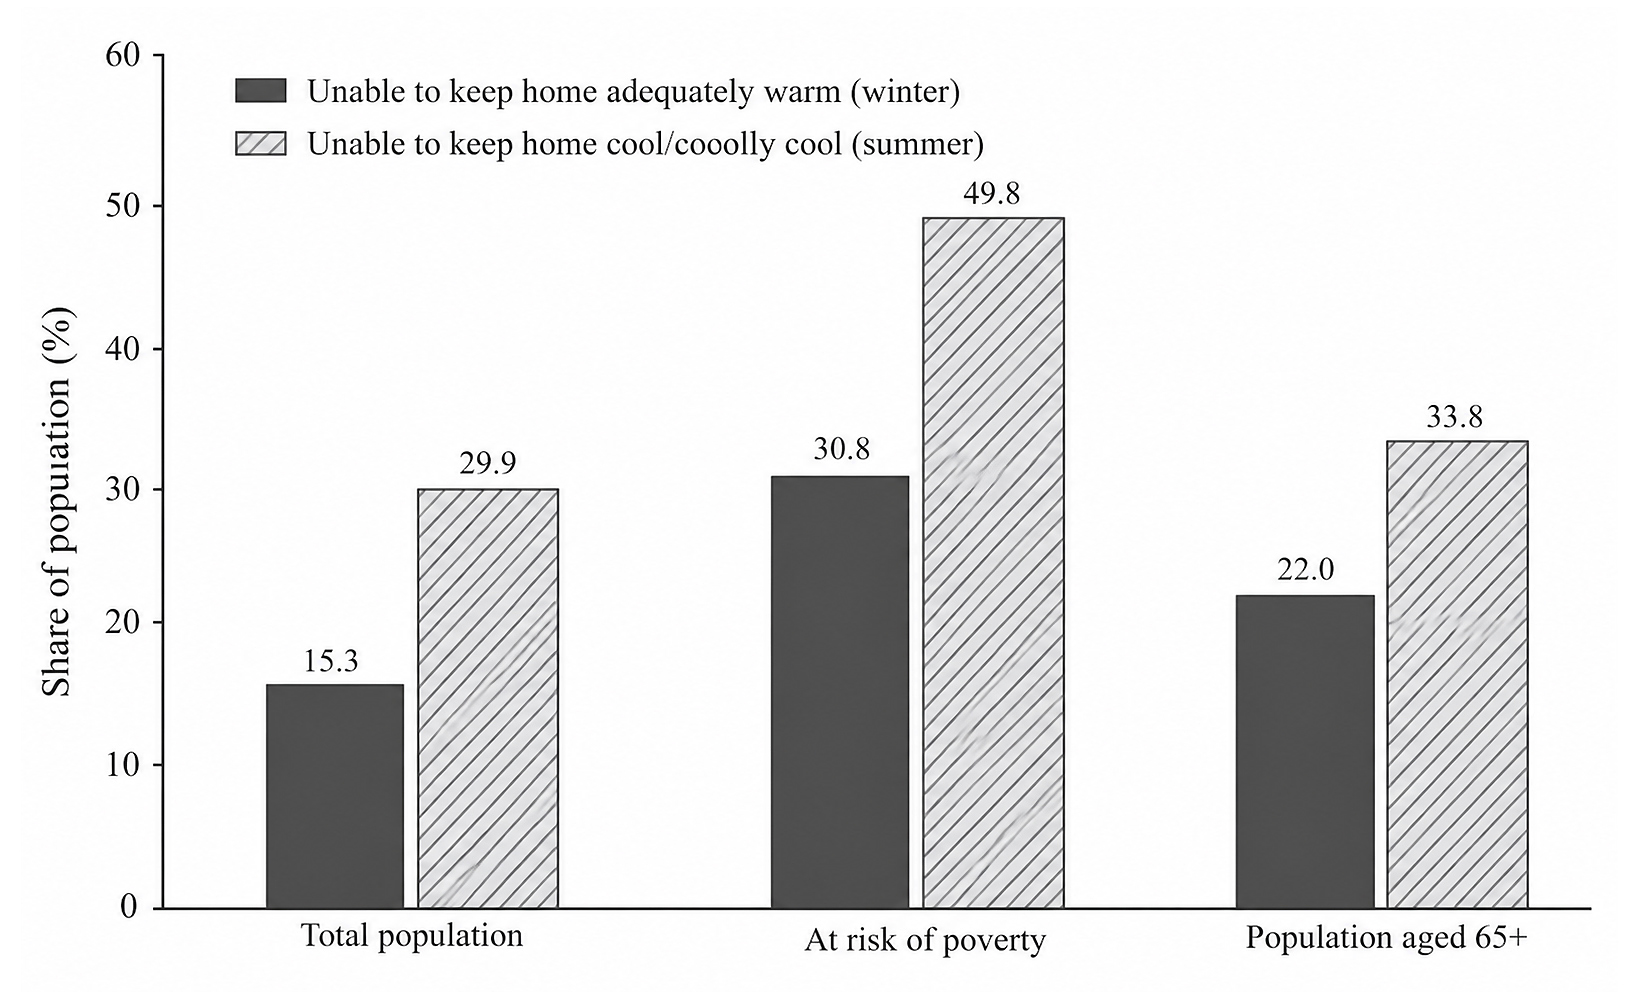 Figure 4.
Share of the population financially unable to keep the home adequately warm in winter and comfortably cool in summer, by population group, Portugal, 2024. Source: INE, Survey on Income and Living Conditions (ICOR 2024) [7].
Figure 4.
Share of the population financially unable to keep the home adequately warm in winter and comfortably cool in summer, by population group, Portugal, 2024. Source: INE, Survey on Income and Living Conditions (ICOR 2024) [7].
The administrative record confirms both the scale of the Social Tariff and the unevenness of its territorial distribution. In the third quarter of 2025, a monthly average of 775,006 electricity clients held the tariff, corresponding to approximately 7.6% of the mainland resident population, alongside 57,746 natural-gas beneficiaries, or 0.6% [30], while the fourth-quarter bulletin reports approximately 730,000 electricity beneficiaries, or 7.2% [31]. Prevalence reaches its highest values in the aging, low-income districts of the northeastern interior, namely 13.0% in Vila Real and 11.6% in Bragança, and its lowest value in Évora, whereas Lisbon and Porto concentrate the largest absolute numbers of beneficiaries [30,31]. This gradient, although suggestive, does not admit of direct interpretation, for two reasons that the framework is expressly designed to address. On the one hand, since beneficiaries correspond to supply contracts rather than to persons, a contract-based coverage rate of 7.6% is compatible with markedly different person-based rates depending on the household-size distribution of beneficiaries, which the weight of old-age benefits among the eligibility criteria renders plausibly skewed toward small, elderly households; the framework therefore reports coverage on a household denominator, as described in the Materials and Methods, and treats the contract-to-person conversion as an explicit estimation output rather than as an assumption. On the other hand, a prevalence map documents the location of the tariff rather than the location of energy poverty, and the degree of coincidence between the two distributions, which is precisely the question raised by H3, can only be assessed against a measure of need constructed independently of the tariff’s own eligibility rules, which is the function performed by the index specified in the Materials and Methods.
Decision Products of the FrameworkWhen applied to the assembled panel, the estimation stage yields four decision products, all of which are fixed in advance and represented schematically in Figure 1. The first two consist of municipal maps of winter and summer energy poverty, each reporting the posterior probability that a given municipality belongs to the most deprived national quintile, together with 95% credible intervals that render the uncertainty of small-area estimates explicit. The third consists of the hidden energy poverty map, which identifies the municipalities in which the underconsumption indicator of Equation (2) assumes high values in conjunction with high economic, residential, and climatic vulnerability, and for which the framework additionally expresses the deprivation gap, understood as the annual energy service deficit that observed consumption fails to cover, in kilowatt-hours and, through the price components published by ERSE, in euros. The fourth consists of the coverage-gap classification defined by Equation (3) and Figure 2, which converts the confrontation between estimated need and tariff coverage into a four-group municipal typology. Under H4, the winter and summer maps are expected to diverge, with the former concentrated in the northern and interior municipalities where cold climates coincide with old, heating-poor stock and the latter in southern, densely urbanized, and heat-exposed territories, and the extent of this divergence constitutes, in itself, a reportable result with direct implications for the degree of seasonality that protection instruments ought to incorporate.
From Classification to Policy AssignmentThe typology is constructed with a view to policy assignment. Quadrant I, which combines high estimated poverty with comparatively thin coverage, identifies the situations in which automatic attribution fails to reach need, and the plausible explanations for such failures are concrete and, in principle, remediable, including contracts not held in the eligible person’s name, informal housing situations, and address mismatches across administrative registers, all of which can be addressed through outreach and register reconciliation. Quadrant II, which combines high poverty with high coverage, corresponds to the territories in which the tariff arrives but cannot by itself suffice, given that no price discount is capable of compensating for an inadequate thermal envelope, and it is in these territories that renovation programs should be prioritized. Quadrant IV, which combines high coverage with low estimated poverty, should be interpreted not as a failure of the instrument but as a finding in its own right, since it delimits the territories in which income-based eligibility and thermal need have diverged and in which any future recalibration of the eligibility criteria would most usefully begin. It should be emphasized that no assertion is made here regarding the quadrant membership of specific municipalities, precisely because the classification rule is fixed ex ante in order to ensure that the eventual assignment cannot be adjusted to expectations. The reduced-form results reported below nonetheless already populate the typology at the scales that published data permit: the correspondence of Vila Real and Bragança, the districts of highest tariff prevalence, with the top of the winter vulnerability ranking places their territories in Quadrant II, where protection arrives but renovation is the binding constraint, whereas the correspondence of Évora, the district of lowest mainland prevalence, with the summer-vulnerable Alentejo Central identifies a concrete candidate for Quadrant I on the summer margin.
Empirical Implementation and Hypothesis TestsThe reduced-form implementation yields four results. The first concerns H1. Across the twenty-seven Member States, the prevalence of dwelling defects is positively and significantly associated with winter thermal deprivation once income is controlled for: a one percentage point increase in the share of population living in dwellings with leaks, damp, or rot is associated with an increase of 0.31 percentage points in the share unable to keep the home adequately warm (p = 0.020), the coefficient on log median income is strongly negative (−8.9, p = 0.005), and the two regressors jointly account for approximately one third of the cross-country variance (R2 = 0.35, n = 27) [8,41,42]. It is instructive that the unconditional correlation between defects and deprivation is weak (r = 0.30, p = 0.13) and becomes significant only when income is held constant, which is precisely the structure that H1 asserts: dwelling quality matters conditional on income, and analyses that omit income understate its role. Portugal’s position in this configuration is extreme, since it combines the second-highest dwelling-defect prevalence of the Union (29.0%, exceeded only by Cyprus at 32.1%) with a median income approximately one third below the EU-27 median (14,446 versus 21,245 PPS) [41,42]. At European scale, therefore, H1 is not rejected; its municipal counterpart, which requires the certificate and census blocks of Table 2, is estimable only on the full panel.
The second result formalizes the consistency test of H2. In 2023, final energy consumption in Portuguese households stood at 273 kg of oil equivalent per capita, against an EU-27 average of 509, that is, 46% below the European average [46], while the preceding subsections have documented an average energy budget share of 5.2% [13], winter and summer incapacity of 15.7% and 29.9% [7], 26.6% of the population living in dwellings in which no heating was used [12], and the second-worst dwelling-defect prevalence of the Union [41]. If expenditure- and arrears-based indicators were sufficient statistics for energy deprivation, a country with the fifth-highest winter deprivation of the EU-27 could not simultaneously exhibit one of the Union’s lowest levels of household energy consumption and an unremarkable average budget share; the joint configuration is consistent only with adjustment on the quantity margin. H2 therefore survives the strongest test that published aggregates permit, and its household-level quantification through the underconsumption indicator of Equation (2) is what the full panel estimation is designed to deliver.
The third result concerns the seasonal geographies of H4. Table 3 reports, for the twenty-four NUTS III subregions of mainland Portugal, the climatic inputs, the demographic and economic amplifiers, and the two structural composites, and Figure 5 represents the resulting classification. The purely climatic geographies of winter and summer are distinct to the point of inversion, since the rank correlation between heating and cooling degree days across subregions is negative (Spearman ρ = −0.35): the five highest heating burdens are all located in the North and Center interior (Alto Tâmega e Barroso, with 1953 degree days, followed by Terras de Trás-os-Montes, Beiras e Serra da Estrela, Douro, and Viseu Dão Lafões), whereas the five highest cooling burdens are all located in the South and in the interior Tejo basin (Baixo Alentejo, with 462, followed by Alentejo Central, Beira Baixa, Alto Alentejo, and the Algarve) [43]. The composites nonetheless overlap more than climate alone would imply, because the social amplifiers, population aging and low income, are concentrated in the same interior territories that bear the climatic extremes: nine subregions, all interior, lie above the median on both composites, three are vulnerable on the winter dimension only, three on the summer dimension only, among them Alentejo Central and Baixo Alentejo, and nine, essentially the coastal and metropolitan territories, lie below both medians, with Grande Lisboa at the minimum of both. H4 is therefore supported in its climatic formulation and refined in its social one: winter and summer energy poverty possess distinct geographies, but in Portugal they are bridged by an interior belt in which cold winters, hot summers, old populations, and low incomes coincide, so that seasonally differentiated protection instruments would in practice have to serve overlapping rather than disjoint territories.
The fourth result confronts these estimates with the published territorial footprint of the Social Energy Tariff, to the extent that the bulletins permit, and speaks directly to H3. On the winter margin, protection and estimated need are visibly aligned: the two districts with the highest beneficiary prevalence in the third quarter of 2025, Vila Real (13.0%) and Bragança (11.6%) [30], correspond territorially to Alto Tâmega e Barroso, Douro, and Terras de Trás-os-Montes, which occupy the first, fourth, and second positions of the winter composite. On the summer margin the alignment inverts: the district with the lowest mainland prevalence reported in the fourth-quarter bulletin is Évora [31], whose territory corresponds to Alentejo Central, the subregion with the second-highest cooling burden of the mainland (425 cooling degree days) and an above-median summer composite. The published aggregates thus document, without any modeling, the central asymmetry that H3 anticipates: an income-targeted instrument whose territorial incidence tracks the geography of winter need, historically correlated with income poverty in the northern interior, while leaving the geography of summer need comparatively unprotected. A complete adjudication of H3, municipality by municipality, and any test of the protective H5 require the monthly beneficiary files at municipal level, which DGEG compiles for the automatic attribution process but does not release in the bulletins; on the evidence that is public, H3 is supported on the summer margin, and H5 remains untested, with its quasi-experimental design and identification requirements fixed in advance as specified in the Materials and Methods.
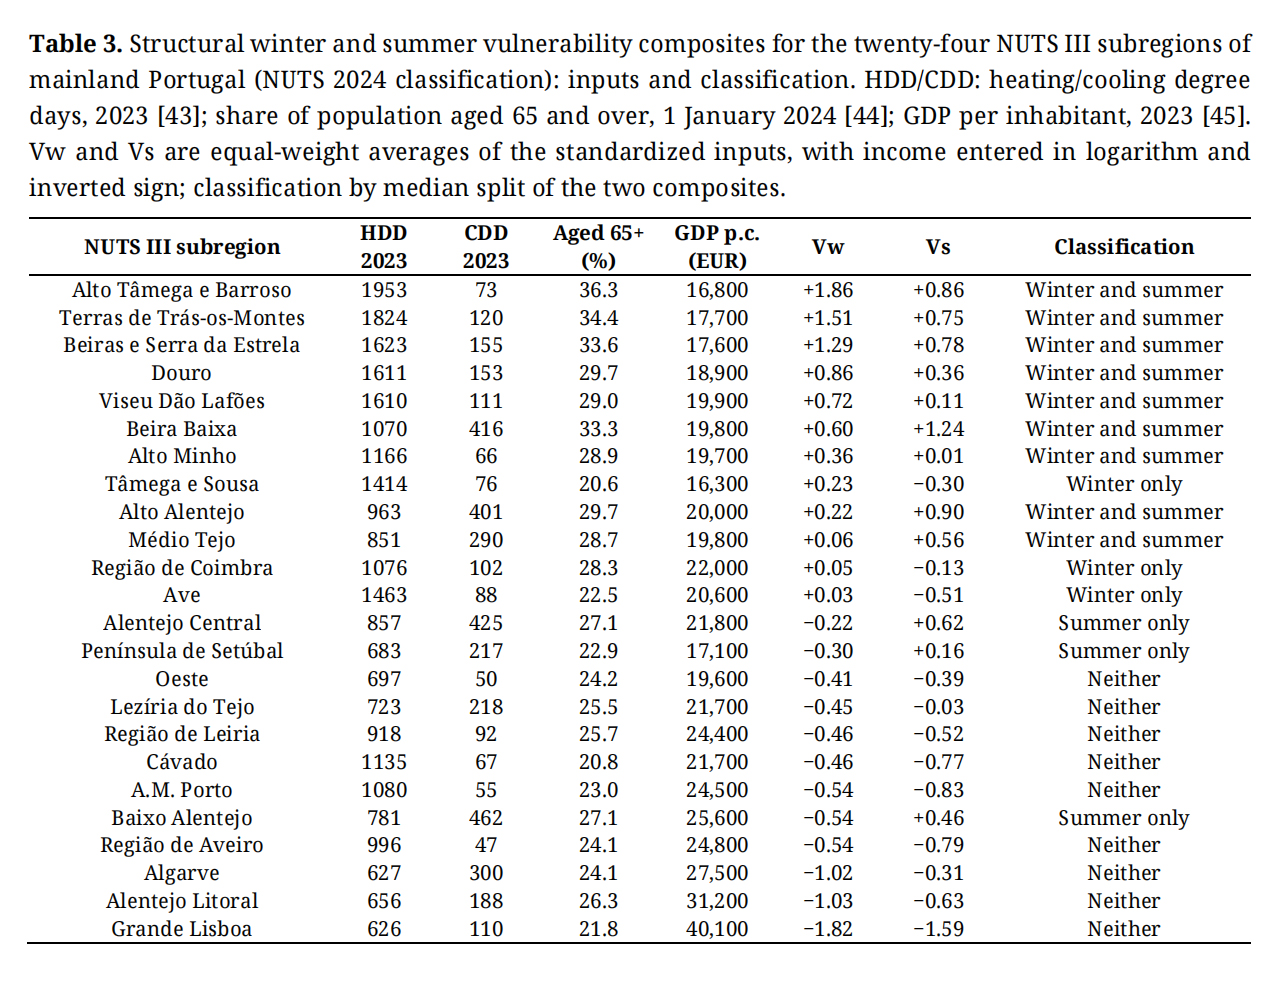 Table 3. Structural winter and summer vulnerability composites for the twenty-four NUTS III subregions of mainland Portugal (NUTS 2024 classification): inputs and classification. HDD/CDD: heating/cooling degree days, 2023 [43]; share of population aged 65 and over, 1 January 2024 [44]; GDP per inhabitant, 2023 [45]. Vw and Vs are equal-weight averages of the standardized inputs, with income entered in logarithm and inverted sign; classification by median split of the two composites.
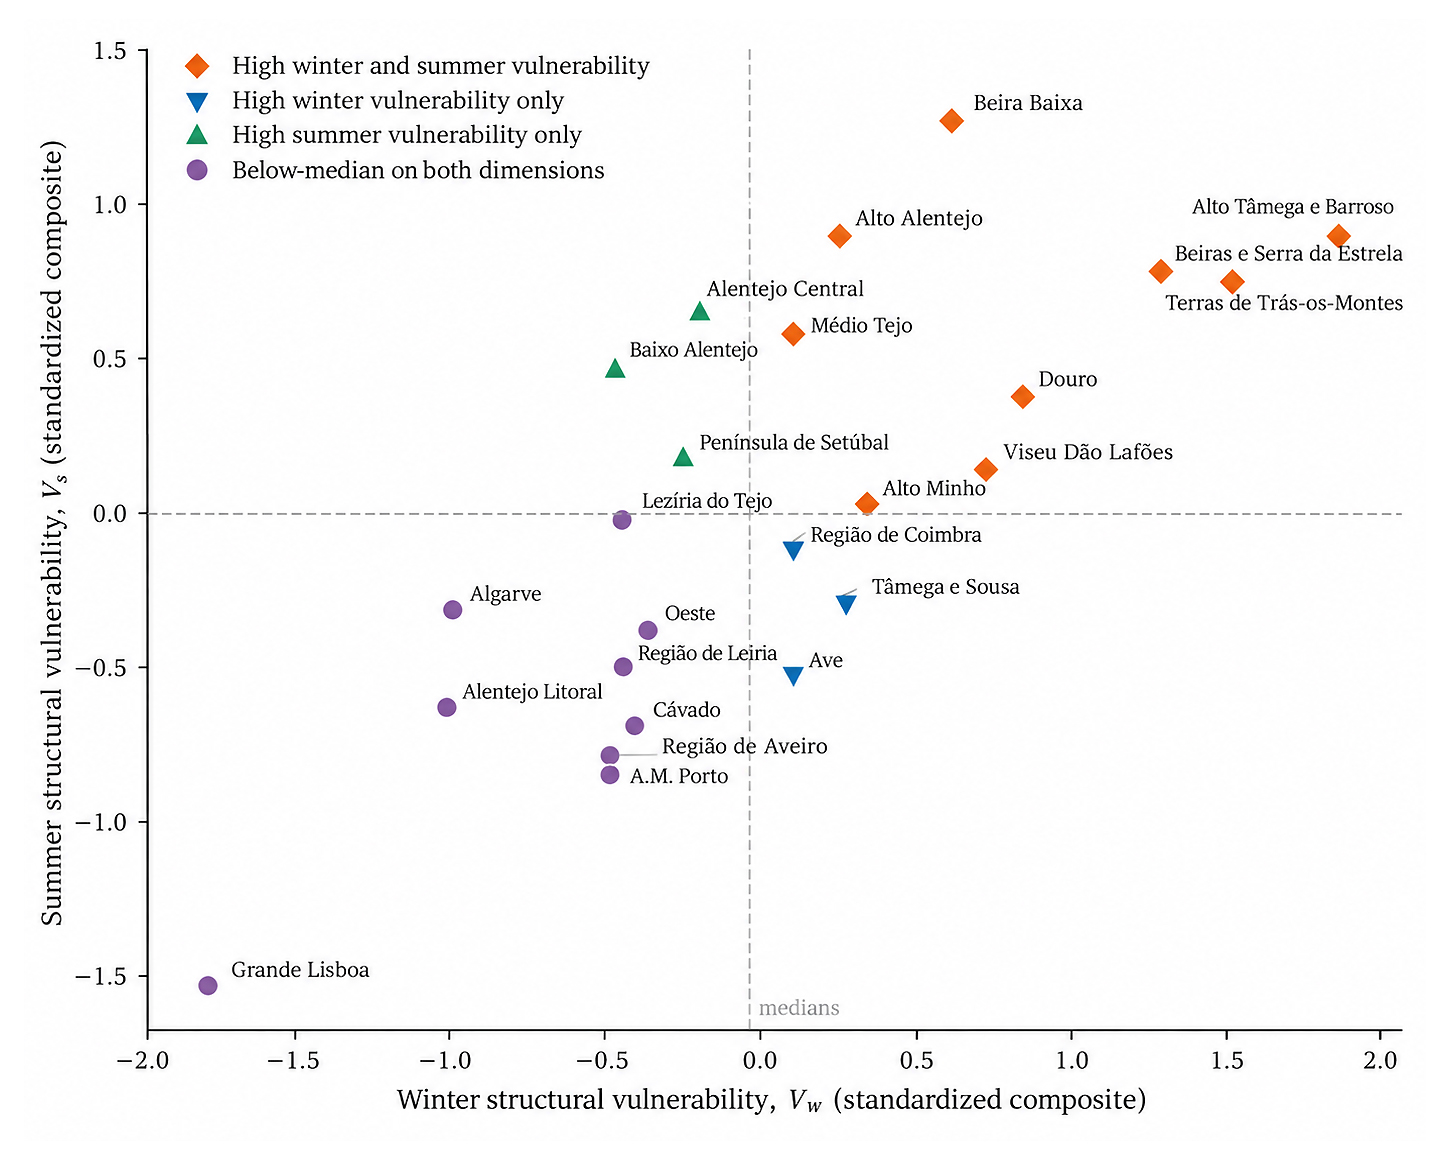 Figure 5.
Classification of the twenty-four NUTS III subregions of mainland Portugal by the winter (Vw) and summer (Vs) structural vulnerability composites. Dashed lines mark the medians of the two composites. Sources: Eurostat regional series [43–45]; author’s calculations.
Figure 5.
Classification of the twenty-four NUTS III subregions of mainland Portugal by the winter (Vw) and summer (Vs) structural vulnerability composites. Dashed lines mark the medians of the two composites. Sources: Eurostat regional series [43–45]; author’s calculations.
The evidence assembled in the Results carries a measurement lesson whose relevance extends beyond the Portuguese case. A country in which the average household devotes 5.2% of its monetary income to energy, while 15.7% of the population is unable to keep warm and 29.9% is unable to keep cool, is a country in which the dominant adjustment margin is the quantity of energy consumed rather than its price or the accumulation of debt [14,15]. Expenditure thresholds and arrears-based counters, which belong to the analytical tradition inaugurated by Boardman [39], were conceived for households that continue to consume and struggle to pay, and they are for that reason structurally blind to households that cease to consume in order not to struggle [40]. This configuration corresponds closely to what hidden energy poverty research has repeatedly uncovered in household expenditure data across Europe [16,17,19,21], and the framework proposed here extends that analytical logic to administrative consumption records observed exhaustively at municipal scale, an extension that liberates the analysis from the sample-size constraints that afflict surveys at fine geographies and adds a decade of temporal depth. The framework likewise incorporates the argument that the cooling literature has been advancing for several years, namely that indoor cooling constitutes a distinct and growing dimension of energy deprivation [22,23]; in the Portuguese data for 2024, summer incapacity was nearly twice the winter figure, from which it follows that a heating-only metric fails to capture not merely a part of the phenomenon but its larger part.
The cross-national distribution summarized in Figure 6 reinforces this reading. According to the harmonized Eurostat data for 2024, the highest shares of population unable to keep the home adequately warm were recorded in Bulgaria and Greece (both 19.0%), Lithuania (18.0%), Spain (17.5%), and Portugal (14.5% in the harmonized series, 15.7% in the national release), whereas Finland (2.7%), Poland and Slovenia (both 3.3%), and Estonia and Luxembourg (both 3.6%) reported the lowest values, so that the distance between the extremes of the Union approached a sevenfold ratio around an EU-27 average of 9.2% [7,8]. The predominance of southern and eastern Member States at the upper end of this distribution is consistent with the diagnosis of a European energy divide [3], and it implies that the measurement problem examined here for Portugal, namely the invisibility of quantity-based adjustment to expenditure- and arrears-based indicators, is likely to affect precisely the group of countries in which energy poverty is most severe, since mild-climate housing traditions, incomplete heating and cooling equipment, and constrained incomes jointly favor rationing as the dominant coping strategy [21,23].
Widening the comparative lens beyond the extremes of the distribution reinforces the same conclusion. In the harmonized data for 2024, intermediate positions were occupied by France (11.8%), Romania (10.8%), Italy (8.6%), the Netherlands (7.1%), and Germany (6.3%), while Denmark (4.4%) and Sweden (4.1%) joined Finland at the lower end of the distribution [8]. What is analytically decisive in this ordering is the weakness of the relationship between climatic severity and reported thermal deprivation: Finland, whose winters are among the harshest in the Union, records the lowest value of the EU-27, at 2.7%, and Estonia, Poland, and Slovenia, all markedly colder than Portugal, report values between 3.3% and 3.6%, whereas the upper tail of the distribution is dominated by the comparatively mild countries of Southern Europe [8]. The paradox is longstanding: the seminal cross-country analysis of excess winter mortality had already located the highest relative winter death rates precisely in the mild-climate countries of Southern Europe, Portugal included, and had attributed this inversion to the poor thermal efficiency of dwellings rather than to outdoor temperature [47], and comparative measurement work on fuel poverty in the Union has repeatedly confirmed that the countries in which homes are hardest to keep warm are not those in which winters are coldest [3,48]. The explanation is structural rather than meteorological. Countries with severe climates were historically compelled to build thermally efficient dwellings, to develop district-heating infrastructures, and to embed domestic energy within universalist welfare arrangements, whereas countries with mild climates accumulated a building stock erected on the implicit assumption that active heating and cooling were dispensable, so that thermal discomfort became a socially normalized condition around which neither building codes nor social policy were calibrated until recently. To this technological and regulatory legacy must be added the more general configuration of each country’s political economy: the position of a Member State in the distribution reflects, jointly, its income level and degree of social inequality, the generosity and universality of its welfare state, the technological composition of its residential heating systems, and the weight of energy prices relative to household income, dimensions that co-vary systematically along the north–south and west–east gradients of the Union and that the notion of a European energy divide condenses [3,48,49].
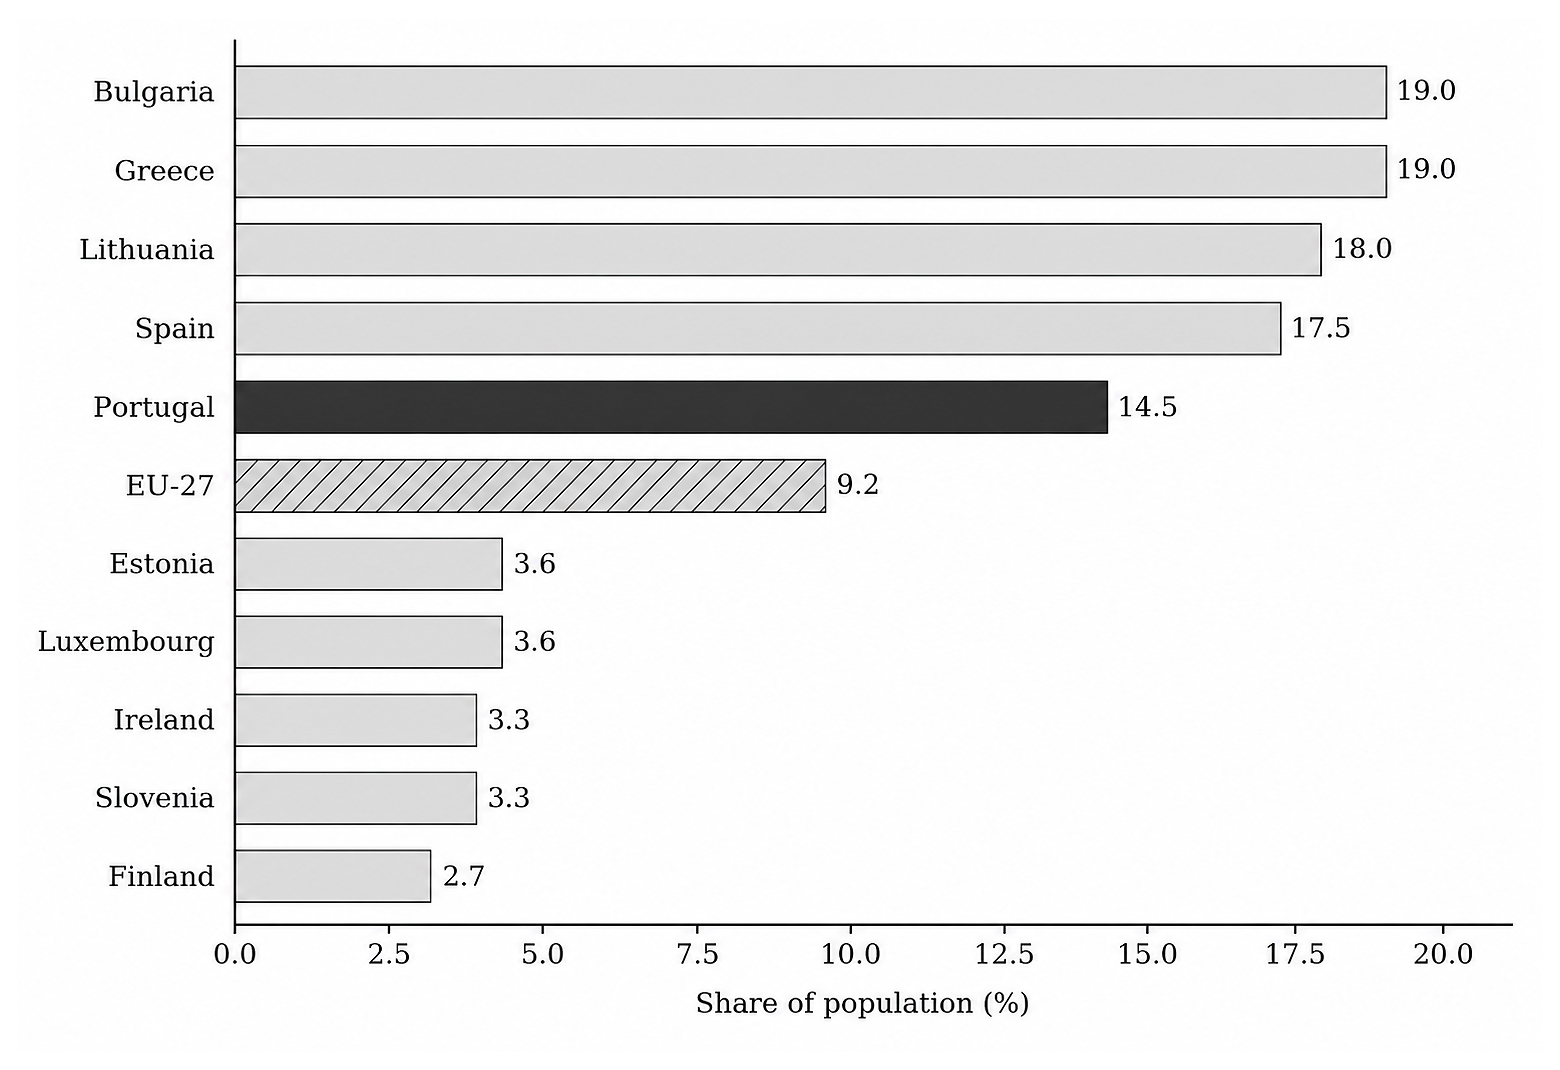 Figure 6.
Share of the population unable to keep the home adequately warm in 2024, EU-27 average and the Member States with the highest and lowest values. Source: Eurostat (EU-SILC, indicator ilc_mdes01) [8]. For Portugal, the harmonized Eurostat figure (14.5%) is shown; the corresponding national release by INE reports 15.7% [7].
Figure 6.
Share of the population unable to keep the home adequately warm in 2024, EU-27 average and the Member States with the highest and lowest values. Source: Eurostat (EU-SILC, indicator ilc_mdes01) [8]. For Portugal, the harmonized Eurostat figure (14.5%) is shown; the corresponding national release by INE reports 15.7% [7].
The level of welfare provision, which derives directly from a country’s economic model, can accordingly serve as an indirect indicator of the probable scale of energy poverty within a society, and it simultaneously conditions the social distribution of the costs of decarbonization. The comparative analysis of elderly populations in Poland and Norway by Szulecki et al. (2024) [49] is instructive in this respect: Norwegian pensioners, protected by widespread home ownership, stable pension incomes, and dwellings of high thermal quality increasingly heated by heat pumps, traversed the 2022 price shock largely unscathed despite record electricity prices, whereas Polish seniors, who devote up to roughly one quarter of their household budgets to housing and energy and frequently depend on coal or on inefficient electric heating, experienced the same continental crisis as acute insecurity, and the authors conclude that a robust and functioning welfare state is a necessary condition for an inclusive energy transition and that material standing and welfare robustness outweigh chronological age as determinants of energy insecurity [49]. The implication for the relationship between welfare and decarbonization is twofold: where welfare arrangements are encompassing, the costs of the transition are absorbed collectively and decarbonization can proceed without translating into deprivation, whereas where they are thin, the same carbon prices, tariff reforms, and technology requirements become regressive in their incidence and are correspondingly more likely to erode the social acceptance of the transition itself [9,49]. Portugal, whose social protection system is less encompassing than its Nordic counterparts and whose building stock shares the Southern European legacy described above, thus combines the two conditions under which decarbonization policy most requires the measurement infrastructure proposed in this article: a high underlying prevalence of energy deprivation and a limited capacity of the welfare system to absorb transition costs silently.
Positioning within the Hidden Energy Poverty LiteratureTable 4 situates the present framework within the European literature on hidden energy poverty. Read together, the studies reveal a striking methodological convergence, since all of them operationalize the phenomenon through some variant of the comparison between the energy a household actually purchases and the energy it would require, a logic whose origins can be traced to the required-expenditure tradition inaugurated by Boardman [39]; they diverge, however, in the data on which that comparison is performed, in the thresholds adopted, and in the scale at which the results are reported. The Belgian barometer identifies households whose energy expenditure falls below half the national median share [16], the Italian and Spanish contributions reconstruct a theoretical required expenditure against which observed spending is judged [17,21], the Greek and Austrian studies incorporate the household’s own account of restriction [19,20], and the Central and Eastern European analysis infers underconsumption from abnormally low expenditure in the presence of high housing costs [18]; in every case, the evidentiary basis consists of household survey microdata, the unit of analysis is the household, the temporal dimension is essentially cross-sectional, and the seasonal focus is heating. The Portuguese vulnerability index of Gouveia et al. (2019) [25] departs from this pattern in two respects that the present framework retains, namely the territorial unit of analysis and the joint consideration of heating and cooling needs, but it remains a cross-sectional composite built from census and climatic data, without recourse to observed consumption and without any confrontation with policy coverage. Against this background, the distinctive features of the framework proposed here are the use of exhaustive administrative consumption records, which removes the sample-size constraints that confine survey-based approaches to national or regional aggregates; the panel structure, which permits the crisis dynamics of 2021–2023 to be examined rather than assumed away; the symmetrical treatment of winter and summer deprivation; and the explicit confrontation of estimated need with the coverage of the Social Energy Tariff. The caution that household-level studies exercise in filtering out benign low spenders, such as households heating with unmetered fuels or occupying genuinely efficient dwellings, is transposed to the municipal scale through the controls specified in the Materials and Methods, so that the change of analytical unit does not relax the identification discipline that the literature has established.
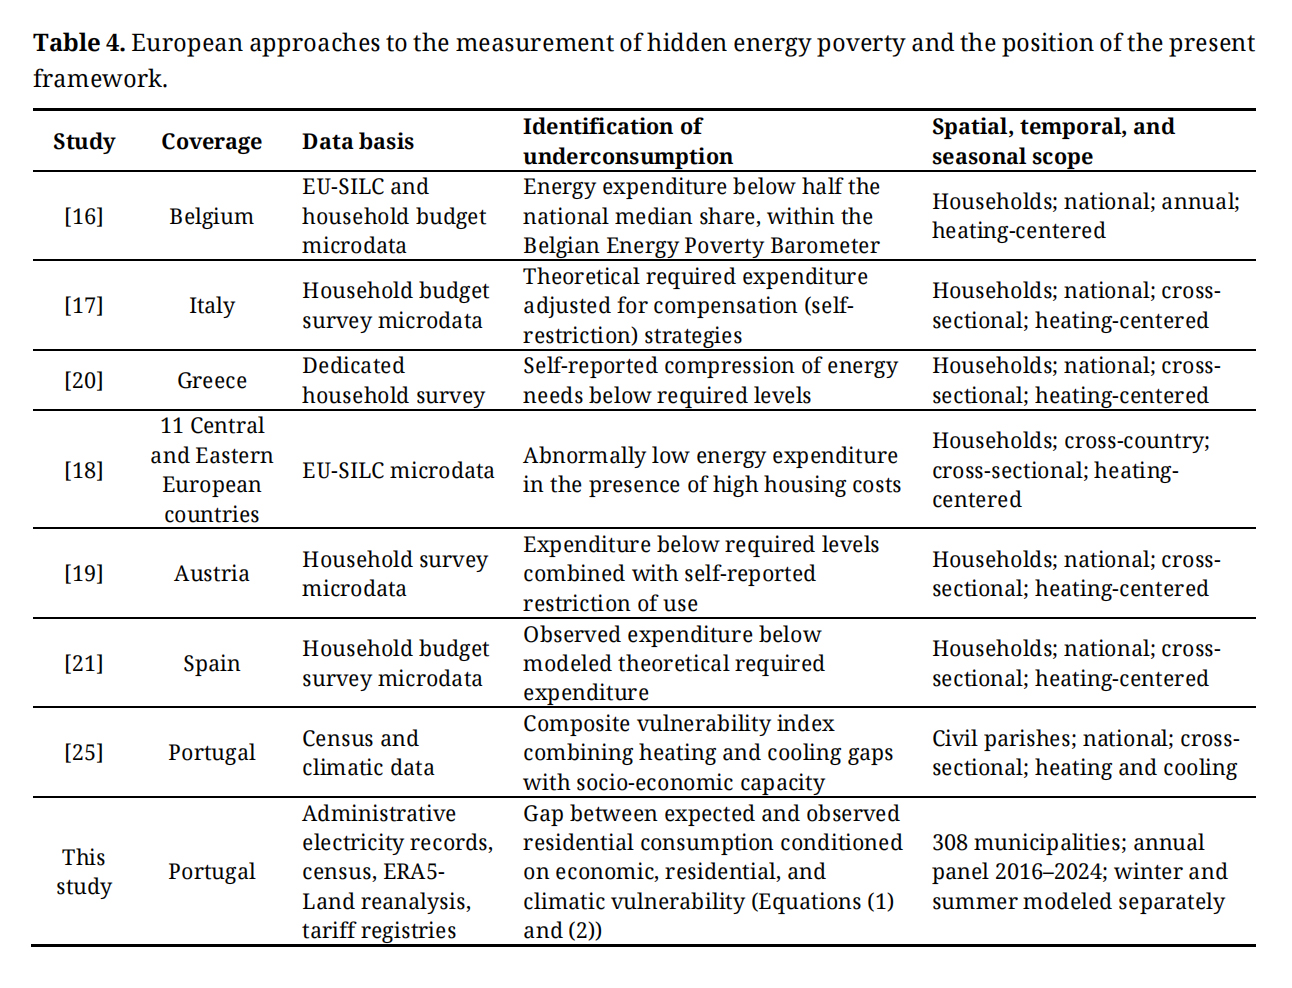 Table 4.
European approaches to the measurement of hidden energy poverty and the position of the present framework.
Table 4.
European approaches to the measurement of hidden energy poverty and the position of the present framework.
A further question raised by the aggregate figures is whether energy poverty can today be regarded as one of the indicators of class membership. The Portuguese data leave little doubt that the phenomenon is strongly patterned by socio-economic position, since winter incapacity reached 30.9% and summer incapacity 39.2% among people at risk of poverty, against 15.7% and 29.9% in the population as a whole [7], and the qualitative literature has long documented that the lived experience of fuel poverty is embedded in broader trajectories of labor-market precarity, tenure insecurity, and ill health rather than constituting an isolated budgetary accident [50]. In this sense, energy poverty behaves as a class-graded condition, and the economic dimension D1 of the framework, which incorporates income, unemployment, benefit receipt, and household composition, is designed to capture precisely this gradient. It would nonetheless be reductive to treat energy poverty as a synonym of income poverty, given that the two populations overlap only partially [1,15]: households of modest but not poor income that occupy thermally inefficient dwellings, rent in the private sector, or reside in demanding climatic zones may experience severe deprivation while escaping every income-based classification, and it is exactly this imperfect overlap that justifies a multidimensional index in preference to income proxies. Energy poverty is therefore best understood as an expression of class inequality refracted through the housing stock and the climate, a refraction that endows it with a spatial and material specificity that income statistics alone cannot capture.
The spatial contrasts examined in this article operate at municipal scale, but the question of whether areas and neighborhoods with higher and lower concentrations of energy poverty can be identified within Portuguese cities admits an affirmative answer. The civil-parish vulnerability index of Gouveia et al. (2019) [25] reveals pronounced heterogeneity within the metropolitan areas of Lisbon and Porto, where historic cores dominated by aged masonry buildings, degraded rental housing, and elderly resident populations coexist at short distance with recently built neighborhoods of far higher thermal performance, and the census equipment record points in the same direction, since the availability of air conditioning, absent from 83.4% of usual residences overall but from only 63.5% of dwellings built in the preceding decade, is largely a function of when, and for whom, a neighborhood was built [11]. Intra-urban differences are accordingly not confined to the affluence of residents: they encompass construction epoch and building typology, from the masonry buildings of the historic centers to the social housing estates of the post-war decades and the concrete-framed condominiums of recent construction; they encompass the technologies embedded in those buildings, which range from the absence of any fixed heating or cooling system to central installations and reversible heat pumps; and they encompass the urban microclimate itself, given that the nocturnal urban heat island documented for Lisbon attains its maximum intensity in the dense city center and weakens toward greener and better-ventilated districts [51], so that proximity to green spaces differentiates summer exposure at scales far finer than any municipal average. Research conducted in a large city of Central and Eastern Europe has shown how such social and spatial determinants—district, building type, and access to modern heating technologies—combine to produce sharply differentiated conditions among older residents in particular, and has argued that social policy under the energy transition must be calibrated to this fine-grained geography [52], while the intra-urban analyses of Madrid and London cited above document an equally fine sociospatial differentiation of summer risk [23]. The municipal resolution of the present framework, imposed by the spatial detail of the administrative consumption data, cannot resolve these contrasts, and the limitation is acknowledged explicitly: what the framework can deliver is the identification of the municipalities in which intra-urban analysis is most urgent, and its transposition to civil-parish scale is identified below as a priority for subsequent research.
Energy Ageism and the Heterogeneity of Old-Age Energy PovertyThe elevated incidence of thermal deprivation among people aged 65 and over, documented in the Results, likewise deserves more than a demographic footnote, and the emerging literature on energy ageism provides the appropriate conceptual frame. Żuk and Żuk [9] define energy ageism as the systematic disadvantage of older people in the energy domain, arising not only from constrained pension incomes but also from the design of transition policies around digitally competent, investment-capable consumers, and subsequent work has consolidated age-based energy equity as a distinct analytical category within the study of social equity in the energy sector [53]. Advanced age does not, however, operate as a uniform condition, and the Portuguese figures themselves demonstrate that most people over 65 are not energy poor: winter and summer incapacity in this age group, at 22.0% and 33.0% respectively [7], although clearly above the population averages, leaves the majority of the group unaffected. The literature identifies with growing precision the characteristics and mechanisms that convert age into deprivation. Low pensions and the erosion of savings define the economic channel; residence in the oldest and least efficient segments of the housing stock, frequently in dwellings acquired or rented decades earlier and never renovated, defines the residential channel; living alone, and especially living alone as an older woman on a survivor’s or minimum pension, concentrates fixed energy costs on a single reduced income, a configuration that the recent conceptualization of gendered energy ageism situates at the intersection of age and gender inequality [54]; longer time spent at home and greater physiological sensitivity to heat and cold raise the thermal needs of precisely the group least able to fund them [9,53]; and limited digital literacy restricts access to supplier switching, to dynamic tariffs, and to the online procedures through which support and renovation schemes are increasingly administered, a barrier that comparative research identifies as a specifically ageist feature of the current transition [49,52]. The comparative finding that socioeconomic conditions outweigh chronological age as determinants of energy insecurity [49] reinforces rather than contradicts this reading: age amplifies vulnerability where income, housing quality, and welfare provision are already deficient, and remains comparatively innocuous where they are not. Within the framework, these mechanisms are represented at ecological scale through the inclusion in dimension D1 of the share of population aged 65 and over and of one-person households, and one institutional observation follows directly: the Portuguese mechanism of automatic attribution, which requires neither application nor digital competence, already neutralizes one recognized channel of energy ageism, and whether it actually reaches the elderly households that accumulate the remaining risk factors is precisely the kind of question that the coverage-gap analysis is designed to answer.
Policy ImplicationsThe Social Tariff, in turn, is an income-targeted instrument operating in a problem space that is jointly determined by income, buildings, and climate. Automatic attribution constituted a genuine institutional achievement, insofar as it removed, from 2016 onward, the take-up barriers that application-based schemes habitually entail and reaches benefit-defined vulnerability by construction; nothing in the attribution mechanism, however, responds to the thermal quality of the dwelling or to the local climatic burden, with the consequence that the same percentage discount purchases very different quantities of thermal comfort in a cold interior municipality dominated by pre-1970 housing and in a mild coastal municipality of recent construction [25,26]. The coverage-gap map converts this observation into an operational targeting tool whose usefulness extends well beyond the discount itself, since renovation vouchers under the Recovery and Resilience Plan already employ Social Tariff status as an eligibility gate, which renders the tariff registry, in practice, the country’s targeting infrastructure, and since both the national action plan against energy poverty for 2025–2030 and the Social Climate Plan through which Portugal will draw on the Social Climate Fund will require precisely the kind of territorial prioritization evidence that the framework produces [5]. The summer results, finally, argue for the extension of protection logics to cooling, whether through the tariff itself, through targeted equipment support, or through renovation criteria that weight overheating risk, given that no instrument in the current Portuguese policy landscape is designed around the season in which deprivation is now most widespread.
The results of the reduced-form implementation indicate, in concrete terms, how public authorities could revise the allocation of the Social Energy Tariff on the basis of territorial estimates, moving from the territorial diagnosis toward the level of individual households. In territories of the Quadrant I type, exemplified on the summer margin by Alentejo Central, where estimated need exceeds observed coverage, the appropriate response is not a change in the eligibility rules but an administrative search for the households that the automatic mechanism misses: targeted reconciliation of the registers already cross-checked monthly by DGEG with suppliers’ client files could identify supply contracts held in a name other than that of the eligible resident, informal housing situations, and address mismatches, which are the remediable causes of under-coverage enumerated above [28]. In territories of the Quadrant II type, exemplified by Alto Tâmega e Barroso and Terras de Trás-os-Montes, where the tariff already arrives, the beneficiary registry itself could be used to direct renovation support and efficient heating and cooling equipment to the dwellings of current recipients, household by household, so that the price discount is progressively complemented by the structural intervention that alone reduces need. Where coverage exceeds estimated need, the indicated revision is not the withdrawal of the discount from current beneficiaries but a recalibration of the eligibility criteria, for instance through the progressive incorporation of dwelling-level thermal information from the energy-certificate registry and of local climatic burden, notably cooling burden, alongside the existing income and benefit conditions, so that automatic attribution gradually internalizes determinants of need, above all summer need, that the current income-based rule ignores. Because attribution is already automatic and processed monthly, none of these revisions requires new administrative infrastructure: they consist in adding information that the state already holds to a cross-checking routine that already exists, and the territorial estimates provide the prioritization that makes such household-level action operationally tractable.
Future ResearchThree extensions of the present framework appear particularly promising. Smart-meter data, as the roll-out of intelligent metering approaches completeness, would permit underconsumption to be observed at sub-annual frequency and related to specific temperature episodes rather than to annual degree-day totals. The linkage of tariff registries with Social Security and Tax Authority microdata, under the legal framework that already sustains automatic attribution, would allow person-level incidence analysis and a direct estimation of the contract-to-person conversion that the present design can only bound. Household validation surveys, accompanied by indoor temperature monitoring in municipalities drawn from different quadrants of the typology, would in turn provide the ground truth that ecological designs ultimately require. Two further extensions follow directly from the preceding discussion: the transposition of the framework to civil-parish scale, which would connect the municipal diagnosis to the intra-urban contrasts of building typology, green-space proximity, and equipment endowment discussed above [25,52]; and the incorporation, in the household validation surveys, of the age, gender, household-composition, and digital-competence variables that the energy-ageism literature identifies as decisive, so that the heterogeneity of old-age energy poverty can be observed directly rather than inferred ecologically [9,52–54].
Portugal enters the final stretch of the European decarbonization agenda carrying a paradox that this article has sought to render analytically tractable: energy expenditure that appears moderate on average coexists with thermal deprivation that ranks among the worst in the Union, in winter and, even more markedly, in summer. It has been argued that the paradox dissolves once consumption rationing is taken seriously, since households that cannot afford thermal comfort do not necessarily accumulate arrears but frequently live at indoor temperatures below and above what health and wellbeing would require, in a manner that the standard indicators were not constructed to register. The framework specified here constitutes an attempt to make this invisible adjustment visible at the scale at which policy actually operates: it assembles official, public data into a municipal panel for 2016–2024; it estimates a latent Hidden Energy Poverty Index endowed with explicit spatial structure, temporal dynamics, and quantified uncertainty; it separates winter from summer geographies and expresses the underconsumption gap in kilowatt-hours and in euros; and it confronts the resulting estimates with the territorial footprint of the Social Energy Tariff, including a pre-specified quasi-experimental assessment of the tariff’s role during the 2021–2023 crisis. The descriptive record already establishes the premises of this exercise, insofar as deprivation in Portugal is demonstrably seasonal, socially graded, anchored in the building stock, and poorly proxied by expenditure, and what the completed framework will add is the capacity to state, municipality by municipality and with quantified uncertainty, where need and protection coincide and where they diverge, a form of knowledge without which neither tariff reform, nor the prioritization of renovation, nor the national and European instruments now entering into force can aspire to territorial rationality. The reduced-form implementation presented in the Results converts part of this program into findings: dwelling-stock quality predicts thermal deprivation across the Union once income is controlled for, so that H1 is not rejected; the coexistence of the Union’s fifth-highest winter deprivation with household energy consumption 46% below the European average confirms the quantity-margin adjustment that H2 asserts; the winter and summer climatic geographies of mainland Portugal diverge to the point of rank inversion, supporting H4, while an interior belt accumulates both burdens together with aging and low income; and the published footprint of the Social Tariff tracks the winter geography of need while leaving its summer geography comparatively unprotected, supporting H3 on the summer margin. The estimation of the full index at municipal scale, with the underconsumption dimension and the quasi-experimental test of H5, requires the municipal beneficiary files that the bulletins do not release, and the analytical rules fixed in this article are designed to discipline exactly that estimation.
Data are available upon request to the corresponding author. The reduced-form implementation uses exclusively published Eurostat and DGEG series, cited in the references; the assembled subregional dataset and the analysis code are available from the corresponding author.
The author declares that there is no conflict of interest.
LJRN was supported by proMetheus, Research Unit on Energy, Materials and Environment for Sustainability—UIDP/05975/2020, funded by national funds through FCT—Fundação para a Ciência e Tecnologia. The funding source had no involvement in the study design, data collection and interpretation, manuscript preparation, or the decision to submit the work for publication.
1.
2.
3.
4.
5.
6.
7.
8.
9.
10.
11.
12.
13.
14.
15.
16.
17.
18.
19.
20.
21.
22.
23.
24.
25.
26.
27.
28.
29.
30.
31.
32.
33.
34.
35.
36.
37.
38.
39.
40.
41.
42.
43.
44.
45.
46.
47.
48.
49.
50.
51.
52.
53.
54.
Nunes LJR. Does the Social Energy Tariff Reach Energy-Poor Households? A Municipal Framework for Assessing Hidden Winter and Summer Energy Poverty in Portugal. J Sustain Res. 2026;8(3):e260078. https://doi.org/10.20900/jsr20260078.

Copyright © Hapres Co., Ltd. Privacy Policy | Terms and Conditions


